
Author: Jinfiniti Science

Hemoglobin A1C (HbA1c) Test Featured Image

Hemoglobin A1C (HbA1c) Test: Ranges, Benefits and Limitations

If you’ve ever wondered how well your blood sugar has been controlled over the past few months, the HbA1c test gives you that answer. Unlike a standard glucose test that captures just one moment in time, HbA1c measures your average blood glucose levels over the preceding 8-12 weeks.

This blood test is one of the most valuable tools for diagnosing diabetes, monitoring treatment effectiveness, and predicting long-term health risks.

What You Should Know

  • HbA1c measures average blood glucose over 2-3 months by checking how much sugar has attached to your red blood cells
  • Results below 5.7% are normal, 5.7-6.4% indicate prediabetes, and 6.5% or higher suggests diabetes
  • The test doesn’t require fasting and provides better insight into complications risk than single glucose measurements
  • Certain conditions like anemia can affect accuracy, so HbA1c should be interpreted alongside other health markers

What is the Hemoglobin A1C (HbA1c) Test?

The hemoglobin A1c test measures glycated hemoglobin, which is hemoglobin with glucose molecules attached.

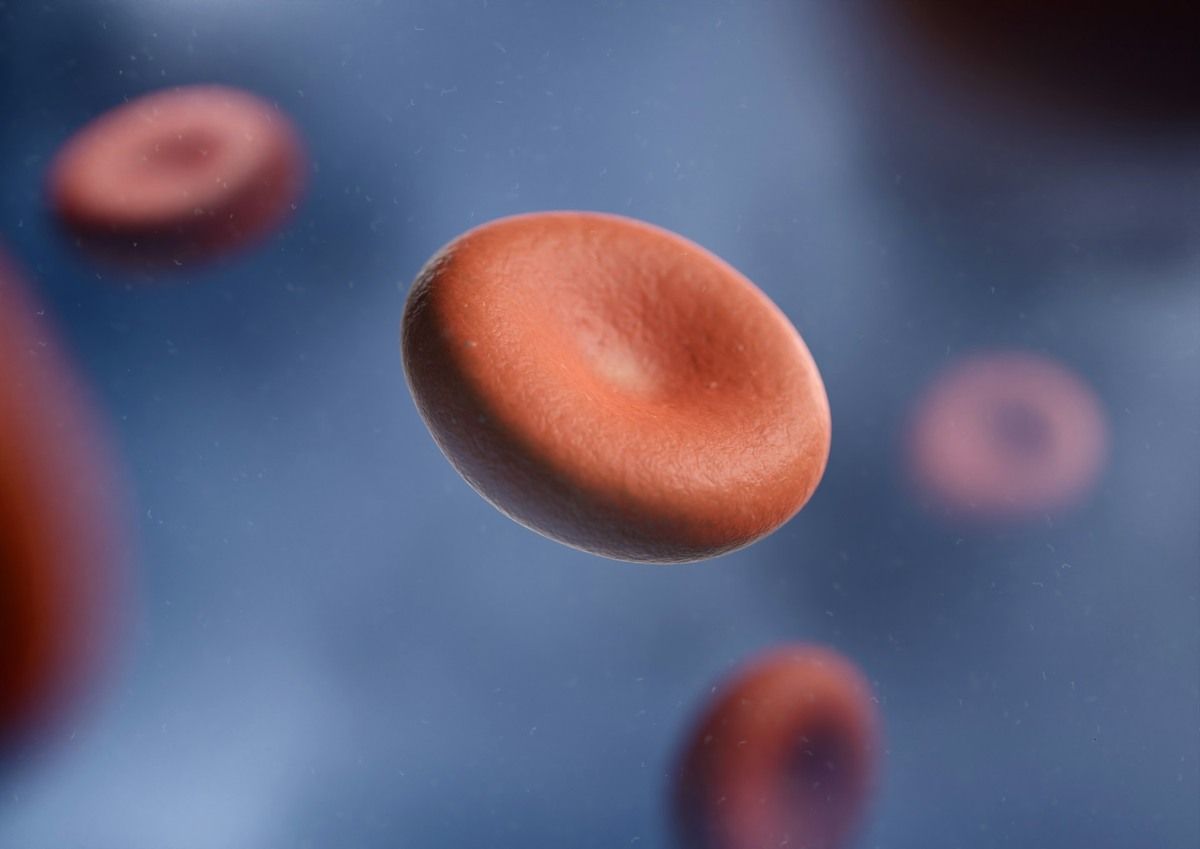
Hemoglobin is a protein in your red blood cells that carries oxygen throughout your body. When glucose enters your bloodstream, some of it binds to hemoglobin through a process called glycation.

As your blood sugar levels increase, more glucose attaches to your hemoglobin.

Since red blood cells live for about 120 days, the HbA1c test shows your blood sugar levels over that entire period. The test results are given as a percentage. A higher percentage means more glucose has been in your blood.

How Glycation Works

Glycation happens when glucose binds to the NH₂-terminal valine on hemoglobin’s beta chain. First, it forms an unstable structure called a Schiff base. This then undergoes something called an Amadori rearrangement to create stable HbA1c[1].

This process is irreversible. Once glucose attaches to hemoglobin, it stays there for the life of that red blood cell.

Dr. David B. Sacks from the National Institutes of Health explains: “Formation of HbA1c is essentially irreversible, and its concentration in the blood depends on both the life span of the red blood cell, which averages ~120 days, and the blood glucose concentration.”

Your HbA1c is a weighted average. Blood sugar levels from the past 30 days contribute more to your result than levels from 90-120 days ago.

Comprehensive Metabolic Testing

Test HbA1c with 27 other key longevity biomarkers.

Jinfiniti AgingSOS green gradient background

Why HbA1c Testing Matters for Long-Term Health

HbA1c doesn’t just diagnose diabetes. It also predicts your risk for serious complications such as kidney disease, vision loss, and nerve damage.  

These complications come from long-term exposure to high blood sugar. This condition harms blood vessels and speeds up cellular aging.  

A1C levels are now seen as essential for diabetes care around the world. Two important studies established this link.

The DCCT and UKPDS Studies

The Diabetes Control and Complications Trial (DCCT) followed 1,441 people with type 1 diabetes from 1983 to 1993. Participants who kept their HbA1c levels around 7% through intensive treatment had a 35-76% lower risk of microvascular complications compared to those with an HbA1c around 9%[2].

Specific reductions included:

The UK Prospective Diabetes Study (UKPDS) showed similar findings for type 2 diabetes. Even a modest difference in HbA1c (7.0% versus 7.9%) resulted in approximately 25% fewer microvascular complications[3].

Both studies revealed a “legacy effect”—early intensive glucose control produced lasting benefits years later, even after HbA1c levels converged between treatment groups. This metabolic memory indicates that getting your HbA1c under control early is important for your long-term health.

HbA1c and Complications Risk

The relationship between HbA1c and complications risk is dose-dependent. Higher levels mean higher risk.

A Swedish study tracking 10,398 people with type 1 diabetes found[4]:

  • HbA1c of 7.0-7.4% showed 1.31-fold increased retinopathy risk compared to 6.5-6.9%
  • HbA1c above 8.6% demonstrated 5.98-fold increased risk of proliferative retinopathy
  • HbA1c above 8.6% carried 3.43-fold increased risk of macroalbuminuria (kidney damage)

Over 16-20 years of follow-up, each 1% increase in HbA1c resulted in an odds ratio of 2.87 for proliferative diabetic retinopathy and 3.83 for macroalbuminuria.

According to UKPDS analysis, each 10% relative reduction in HbA1c resulted in[5]:

  • 43% relative risk reduction for retinopathy progression
  • 25% relative risk reduction for nephropathy

Understand Your HbA1c Results

The World Health Organization and major diabetes organizations have established clear thresholds for interpreting your results.

Normal, Prediabetes, and Diabetes Ranges

HbA1c LevelClassification
Below 5.7% (39 mmol/mol)Normal
5.7% to 6.4% (39-47 mmol/mol)Prediabetes
6.5% or higher (48 mmol/mol)Diabetes

The WHO states: “HbA1c can be used as a diagnostic test for diabetes providing that stringent quality assurance tests are in place and assays are standardised to criteria aligned to the international reference values… An HbA1c of 6.5% is recommended as the cut point for diagnosing diabetes.”

For people already diagnosed with diabetes, treatment targets differ. The American Diabetes Association recommends an HbA1c target of less than 7% for most non-pregnant adults. The American Association of Clinical Endocrinologists suggests 6.5% if achievable safely.

For children and adolescents with type 2 diabetes, the 2025 ADA guidelines recommend an HbA1c goal of less than 6.5%.

How HbA1c Translates to Average Blood Glucose

To make HbA1c more intuitive, researchers developed estimated average glucose (eAG). This converts your percentage into the average blood sugar level you’ve maintained.

The A1c-Derived Average Glucose study included 507 people across 10 international centers. It demonstrated a tight correlation (r = 0.92) between HbA1c and average glucose[6].

HbA1c (%)Estimated Average Glucose
5%97 mg/dL (5.4 mmol/L)
6%126 mg/dL (7.0 mmol/L)
7%154 mg/dL (8.6 mmol/L)
8%183 mg/dL (10.2 mmol/L)
9%212 mg/dL (11.8 mmol/L)
10%240 mg/dL (13.4 mmol/L)

The formula is: eAG (mg/dL) = 28.7 × HbA1c − 46.7

Benefits of HbA1c Over Standard Glucose Tests

HbA1c offers several practical advantages over traditional glucose testing.

You don’t need to fast. The test can be performed any time of day, regardless of when you last ate. This eliminates the inconvenience of overnight fasting required for fasting plasma glucose tests.

Results are stable and reproducible. Blood glucose fluctuates widely throughout the day. HbA1c varies minimally (approximately 1%) in healthy individuals.

Acute factors don’t affect it. Your results aren’t thrown off by stress, exercise, or what you ate yesterday.

It reflects chronic exposure. HbA1c provides a comprehensive view of glucose control over 2-3 months, which better correlates with long-term complication risk than single glucose measurements[7].

When HbA1c Results Can Be Misleading

Despite its utility, HbA1c has limitations that can affect accuracy.

Conditions That Affect Red Blood Cells

Any condition that changes how long your red blood cells survive will affect your HbA1c.

Conditions causing falsely low HbA1c:

  • Hemolytic anemia (red blood cells break down too quickly)
  • Chronic kidney disease (shortened RBC survival)
  • Recent blood transfusion
  • Treatment with erythropoietin

Conditions causing falsely high HbA1c:

  • Iron deficiency anemia
  • B12 or folate deficiency anemia
  • Asplenia (absence of spleen)

Hemoglobin variants like HbS, HbE, HbD, and HbC can interfere with some HbA1c assay methods. Depending on the variant and testing method, results can be spuriously increased or decreased[8].

Individual Variations in HbA1c

Research shows that some people have higher average HbA1c levels independent of their actual blood glucose control.

Studies consistently demonstrate that individuals who identify as Black or African American have approximately 0.3-0.5% higher HbA1c levels compared with non-Hispanic White individuals, even after adjusting for glucose measures.

Dr. Mary Rhee from the Atlanta VA Health Care System and Emory University has highlighted the clinical implications: “HbA1c mismatches are not widely appreciated, but we found that they are not uncommon, and can have important clinical implications. Because HbA1c mismatches could lead to errors, the diagnoses of diabetes/prediabetes should include measurement of fasting glucose levels and/or oral glucose tolerance tests in addition to HbA1c in most Veterans.”

A UK study found that children and young people from Black ethnic backgrounds demonstrated approximately 4-5 mmol/mol higher HbA1c than their White and South Asian counterparts, independent of mean blood glucose levels[9].

This is why your test result should be interpreted within the context of individual patient factors and combined with other assessments.

How Often Should You Test HbA1c?

Diabetes Canada and other organizations provide clear guidance on testing frequency.

  • For patients not meeting glucose targets or with recent therapy changes: every 3 months
  • For patients with stable, well-controlled diabetes: every 6 months

HbA1c should not be measured more than 4 times yearly in most circumstances. Since the test reflects 2-3 months of glucose exposure, testing more frequently doesn’t provide new information.

🧬 MORE BIOMARKER TESTING

  • HbA1c isn’t the only glycation marker worth tracking. The glycated serum protein test captures shorter-term glucose patterns.
  • Elevated levels can signal metabolic trouble ahead. Understanding uric acid testing helps identify inflammation and insulin resistance.
  • Chronic inflammation drives diabetes complications. Learn what C-reactive protein levels reveal about your risk.
  • Your immune response affects blood sugar control. Discover how cytokine testing measures inflammatory pathways.

Test Your HbA1c with AgingSOS

Jinfiniti’s AgingSOS includes HbA1c testing as part of a comprehensive longevity assessment.

You’ll get HbA1c measured alongside 27 other biomarkers including intracellular NAD+, Klotho (the longevity protein), inflammation markers, oxidative stress indicators, and cardiovascular risk factors.

This complete picture helps you detect metabolic issues years before symptoms appear. You can track how your interventions—whether supplements, diet changes, or exercise—affect your HbA1c and other aging markers over time.

The AgingSOS Longevity Panel includes a free consultation to help you interpret your results and develop a personalized optimization strategy.

Mobile phlebotomy is available for convenient at-home blood collection.

Referenced Sources

  1. Sacks DB. Hemoglobin A1c in Diabetes: Panacea or Pointless? American Diabetes Association; 2012. https://doi.org/10.2337/db12-1485
  2. Nathan DM. The Diabetes Control and Complications Trial/Epidemiology of Diabetes Interventions and Complications Study at 30 Years: Overview. American Diabetes Association; 2013. https://doi.org/10.2337/dc13-2112
  3. King P, Peacock I, Donnelly R. The UK Prospective Diabetes Study (UKPDS): clinical and therapeutic implications for type 2 diabetes. Wiley; 1999. https://doi.org/10.1046/j.1365-2125.1999.00092.x
  4. Lind M, Pivodic A, Svensson AM, Ólafsdóttir AF, Wedel H, Ludvigsson J. HbA1c level as a risk factor for retinopathy and nephropathy in children and adults with type 1 diabetes: Swedish population based cohort study. BMJ; 2019. https://doi.org/10.1136/bmj.l4894
  5. Regier L. DIABETES LANDMARK OUTCOME TRIALS- Glycemic Control & Prevention Summary. 2019.
  6. Borg R, Kuenen JC, Carstensen B, Zheng H, Nathan DM, Heine RJ, et al. Associations Between Features of Glucose Exposure and A1C. American Diabetes Association; 2010. https://doi.org/10.2337/db09-1774
  7. Chen Z, Shao L, Jiang M, Ba X, Ma B, Zhou T. Interpretation of HbA1c lies at the intersection of analytical methodology, clinical biochemistry and hematology (Review). Spandidos Publications; 2022. https://doi.org/10.3892/etm.2022.11643
  8. Sreeram S, Gupta D, Hanaganahalli Basavaiah S, Hegde A. HbC Revealed in A1C Assay: A Lesson Learnt From a Routine Health Checkup. SAGE Publications; 2020. https://doi.org/10.1177/1932296820935527
  9. Pemberton JS, Fang Z, Chalew SA, Uday S. Ethnic disparities in HbA1c and hypoglycemia among youth with type 1 diabetes: beyond access to technology, social deprivation and mean blood glucose. BMJ; 2025. https://doi.org/10.1136/bmjdrc-2024-004369
A nurse inserts a blood test vial into a tray in the lab.

Glycated Serum Protein (GSP) Test: What You Should Know

Your doctor orders an HbA1c test and the results don’t match your daily glucose readings. Or maybe you have sickle cell trait and standard diabetes tests aren’t giving accurate information.

The glycated serum protein (GSP) test provides another way to monitor blood sugar control. While HbA1c shows your average glucose over 2-3 months, GSP testing offers a look at the past 2-3 weeks.

This shorter timeframe makes GSP testing especially useful for assessing quick changes in blood sugar or when standard tests do not yield trustworthy results.

What You Should Know

  • GSP measures glucose attached to blood proteins, reflecting 2-3 weeks of blood sugar levels
  • The test works better than HbA1c for people with anemia, kidney disease, or hemoglobin variants
  • Research links elevated GSP levels to increased risk of heart disease, stroke, and diabetes complications
  • Normal fructosamine values range from 200-285 µmol/L, while diabetic ranges run higher

What is a Glycated Serum Protein Test?

GSP testing measures how much glucose has attached to proteins in your blood. When glucose molecules encounter proteins in your bloodstream, they bond through a chemical reaction called non-enzymatic glycation.

This process occurs naturally in everyone. The difference lies in how much glycation takes place.

Your body’s main blood protein is albumin, which makes up about 60-65% of total serum protein. Albumin has a lifespan of roughly 14-21 days; that’s much shorter than red blood cells, which live about 120 days.

Since albumin breaks down faster, glycated albumin reflects more recent blood sugar patterns than HbA1c. The rate of glycation for albumin is actually 9-10 times higher than for hemoglobin, making it a sensitive marker of glucose exposure.

Comprehensive Metabolic Testing

Know your glycation status and 27 other key biomarkers.

Get AgingSOS®
Jinfiniti AgingSOS green gradient background

Fructosamine vs Glycated Albumin: What’s the Difference?

Fructosamine is the general term for all glycated proteins in your plasma. This includes albumin, globulins, and lipoproteins.

Glycated albumin (GA) specifically measures the percentage of your albumin that has undergone glycation. The test presents this as a ratio compared to total albumin.

Research published in the Journal of Diabetes Science and Technology shows that glycated albumin has better diagnostic efficiency than fructosamine in different clinical settings. The ratio format reduces interference from changes in protein concentration, providing more reliable results[1].

What Do Your Test Results Mean?

Normal Reference Ranges

Here’s how different GSP values break down:

MarkerNon-Diabetic RangeDiabetic RangePoorly Controlled
Fructosamine200-285 µmol/L210-563 µmol/L268-870 µmol/L
Glycated Albumin~14%>17%2-5× upper limit

A fructosamine value of 285 µmol/L—the upper limit of normal—correlates to an HbA1c of about 6.5%. That’s the diagnostic threshold for diabetes.

How GSP Relates to HbA1c

The conversion formula used clinically is:

HbA1c (%) = 0.017 × fructosamine (µmol/L) + 1.61

Research from the Atherosclerosis Risk in Communities (ARIC) Study found strong correlations between glycated proteins and HbA1c. The Pearson’s correlation coefficient was 0.81 for fructosamine and 0.85 for glycated albumin[2].

These correlations tell you that GSP values track closely with HbA1c in most people. But the real value of GSP testing shows up when HbA1c becomes unreliable.

When Should You Get a Glycated Serum Protein Test?

Conditions Where HbA1c Isn’t Reliable

Your HbA1c results depend on having normal red blood cells with typical lifespans. Anything that disrupts this gives you inaccurate readings.

GSP testing bypasses these issues because it measures proteins instead of red blood cells. You should consider GSP testing if you have:

Blood disorders affecting red cells:

  • Sickle cell disease or sickle cell trait
  • Hemoglobin C, D, E, or other variants
  • Hemolytic anemia (shortened red cell lifespan leads to falsely low HbA1c)
  • Iron, B12, or folate deficiency (can cause falsely elevated HbA1c)

Chronic kidney disease: Advanced CKD and dialysis patients often get unreliable HbA1c results. A meta-analysis in Endocrine Practice examining 24 studies with 3,928 patients concluded that glycated albumin is superior to HbA1c for assessing blood glucose control in diabetes patients with advanced kidney disease[3].

Pregnancy: Rapid glycemic changes during pregnancy and altered red cell turnover make short-term monitoring critical. GSP testing can track changes more quickly than HbA1c.

Recent blood transfusion: Donor blood affects your HbA1c measurement because you’re now carrying someone else’s red blood cells. GSP testing avoids this problem entirely.

When You Need Short-Term Monitoring

Sometimes you need to know if a treatment change is working right now, not two months from now.

GSP testing shines when you’re adjusting diabetes medications and want to see results within weeks. It mirrors poorly controlled glucose metabolism better than HbA1c for rapid assessment of treatment effectiveness.

If you’re managing gestational diabetes, tracking your glycemic control every 2-3 weeks provides more actionable information than waiting for HbA1c results.

🧬 MORE BIOMARKER TESTING

What Research Shows About GSP and Health Outcomes

Cardiovascular Disease Risk

The landmark ARIC Study published in Circulation followed 11,104 participants for approximately two decades. During follow-up, there were 1,096 cases of coronary heart disease, 605 ischemic strokes, 1,432 heart failure cases, and 2,860 deaths[2].

Elevated baseline concentrations of fructosamine and glycated albumin were significantly associated with each cardiovascular outcome. For individuals without diagnosed diabetes but with values above the 96th percentile:

  • Coronary Heart Disease: Hazard Ratio 1.33 (fructosamine), 1.61 (glycated albumin)
  • Ischemic Stroke: HR 1.93 (fructosamine), 1.46 (glycated albumin)
  • Heart Failure: HR 1.32 (fructosamine), 1.38 (glycated albumin)
  • All-Cause Mortality: HR 1.30 (fructosamine), 1.53 (glycated albumin)

These associations persisted even after adjusting for HbA1c. This suggests that GSP provides independent prognostic information about your cardiovascular risk.

Dr. Elizabeth Selvin, lead author and researcher at Johns Hopkins Bloomberg School of Public Health, stated: “The results of the study suggest that fructosamine and glycated albumin may be useful substitutes for monitoring glucose control in patients” where HbA1c testing is problematic.

Chronic Kidney Disease

Kidney disease creates a double problem for diabetes monitoring. Not only does it make HbA1c less reliable, but poor glycemic control also accelerates kidney damage.

In advanced chronic kidney disease, the pooled correlation coefficient between glycated albumin and average glucose was 0.57, compared to only 0.49 for HbA1c. That better correlation translates to more accurate tracking of your actual blood sugar patterns.

Diabetes Complications

A 2014 Lancet Diabetes & Endocrinology study of over 12,000 ARIC participants[4] found strong associations between GSP levels and:

  • Retinopathy: Odds ratios exceeding 20 at high values among persons with diabetes
  • Chronic Kidney Disease: HR 1.48-1.50 for values above the 95th percentile
  • Incident Diabetes: HR 4.96 (fructosamine) and 6.17 (glycated albumin) for the highest categories

These findings show that elevated GSP levels predict not just cardiovascular problems, but microvascular complications as well.

Advantages of Glycated Serum Protein Testing

GSP testing fills an important gap in diabetes monitoring. The 2-3 week timeframe sits right between daily glucose checks and the longer 2-3 month window of HbA1c.

You get results that reflect recent changes in your blood sugar control. This makes GSP testing ideal for assessing whether medication adjustments are working.

The test doesn’t depend on normal red blood cell function. If you have any condition affecting red blood cells—whether that’s anemia, hemoglobin variants, or rapid cell turnover—GSP gives you more accurate information than HbA1c.

Research shows GSP levels predict cardiovascular and microvascular complications independently of HbA1c. You’re getting additional prognostic information, not just a substitute marker.

For people with chronic kidney disease, GSP testing is particularly valuable. The correlation between glycated albumin and actual glucose levels stays strong even in advanced CKD, while HbA1c becomes progressively less reliable.

Limitations You Should Know

Lack of Standardization

Unlike HbA1c, GSP testing lacks standardization across different laboratory assays. According to the NIH’s StatPearls, “there is a serious lack of standardization across the different fructosamine assays.”

Reference intervals show considerable variation depending on the testing method. Glycated albumin ranges can vary from 0.8-1.4% to 18-22% across different assays.

This makes it harder to compare results between different labs or tracking systems.

When Albumin Levels Are Abnormal

GSP testing becomes unreliable when your serum albumin drops below 30 g/L. Conditions affecting albumin levels include:

  • Liver cirrhosis (decreased albumin production)
  • Nephrotic syndrome (protein loss through kidneys)
  • Thyroid disease
  • Protein-losing enteropathies

If you have any of these conditions, your GSP results may not accurately reflect your glycemic control.

No Established Treatment Targets

Dr. David B. Sacks, NIH Senior Investigator and Chair of the National Glycohemoglobin Standardization Program steering committee, has noted: “A major limitation of the fructosamine assay is the lack of an evidence base linking the test to long-term complications of diabetes. Unlike HbA1c, there are no generally accepted treatment targets for fructosamine.”

You can use GSP testing to track changes over time. But there’s no equivalent to the HbA1c target of <7% that guides treatment decisions.

The BMI Paradox

An intriguing finding from multiple studies shows an inverse correlation between body mass index and glycated albumin. The ARIC Study found Spearman’s correlations of -0.15 for glycated albumin with BMI.

This contrasts with the positive correlation (+0.26) seen with HbA1c. The mechanism remains unexplained, but it suggests glycated albumin may underestimate glycemic status in obese individuals.

What Current Guidelines Say About GSP Testing

The 2024-2025 American Diabetes Association Standards of Care acknowledges GSP testing’s clinical utility while noting its limitations:

“Fructosamine and glycated albumin are alternative measures of glycemia that are approved for clinical use for monitoring glycemic status. Fructosamine and glycated albumin have been linked to long-term complications in epidemiologic cohort studies.”

The ADA recommends considering fructosamine or glycated albumin “in people with diabetes who have conditions where the interpretation of A1C may be problematic or when A1C cannot be measured.”

HbA1c remains the gold standard for most clinical applications. But for specific populations and situations, GSP testing provides valuable complementary information.

Test Your GSP with Jinfiniti’s AgingSOS

At Jinfiniti Precision Medicine, we recognize that comprehensive health assessment requires measuring multiple biomarkers. Our AgingSOS Advanced Panel includes glycated serum protein testing as part of a 28-biomarker assessment.

Glycation is one of the key biological processes associated with aging and metabolic dysfunction. By measuring GSP alongside markers for inflammation, oxidative stress, and cellular senescence, we provide a more complete picture of your metabolic health.

Dr. Jin-Xiong She, founder of Jinfiniti and genomic medicine researcher, emphasizes the importance of multiple biomarkers: “Understanding your glycemic control through different timeframes and methods allows for more precise interventions. GSP testing complements HbA1c by capturing short-term patterns that longer-term tests might miss.”

This approach aligns with our TAO philosophy—Test, Act, Optimize. We measure your biomarkers, implement targeted interventions based on your results, and track your progress over time.

Testing GSP levels before and after dietary or supplement interventions helps you see whether your metabolic health is improving. The 2-3 week timeframe means you don’t have to wait months to know if changes are working.

For individuals managing diabetes or working on metabolic health optimization, GSP testing provides actionable information that supports data-driven decision-making.

Referenced Sources

  1. Danese E, Montagnana M, Nouvenne A, Lippi G. Advantages and Pitfalls of Fructosamine and Glycated Albumin in the Diagnosis and Treatment of Diabetes. SAGE Publications; 2015. https://doi.org/10.1177/1932296814567227
  2. Selvin E, Rawlings AM, Lutsey PL, Maruthur N, Pankow JS, Steffes M, et al. Fructosamine and Glycated Albumin and the Risk of Cardiovascular Outcomes and Death. Ovid Technologies (Wolters Kluwer Health); 2015. https://doi.org/10.1161/circulationaha.115.015415
  3. Gan T, Liu X, Xu G. Glycated Albumin Versus HbA1c in the Evaluation of Glycemic Control in Patients With Diabetes and CKD. Elsevier BV; 2018. https://doi.org/10.1016/j.ekir.2017.11.009
  4. Selvin E, Rawlings AM, Grams M, Klein R, Sharrett AR, Steffes M, et al. Fructosamine and glycated albumin for risk stratification and prediction of incident diabetes and microvascular complications: a prospective cohort analysis of the Atherosclerosis Risk in Communities (ARIC) study. Elsevier BV; 2014. https://doi.org/10.1016/s2213-8587(13)70199-2
Lab technician labeling a uric acid blood test vial.

Uric Acid Test: Ranges, Results & What They Mean

Your physician orders routine blood work, and tucked away in the results is a line for uric acid. Most patients skip right past it, figuring it’s only a concern if they have gout.

Big mistake.

Getting your uric acid tested gives insight into much more than joint issues. It’s now connected to cardiovascular disease, kidney damage, diabetes and even mental decline, often well before you realize there’s a problem.

What You Should Know

  • Uric acid tests measure a waste product from purine breakdown that affects multiple body systems
  • Optimal levels (below 5.5 mg/dL) differ significantly from standard “normal” laboratory ranges (up to 7-8 mg/dL)
  • Blood tests provide the most common measurement, while 24-hour urine collection reveals production versus excretion patterns
  • About 14.6% of US adults have elevated uric acid (hyperuricemia), though 85-90% never develop gout symptoms

What is a Uric Acid Test?

A uric acid test measures the concentration of uric acid in your blood or urine. Your body creates this waste product when it breaks down purines, chemical compounds found in certain foods (red meat, organ meats, seafood) and naturally present in your cells.

The test uses one of two methods. The enzymatic approach (now the gold standard) employs the enzyme uricase to oxidize uric acid, creating a chemical reaction that allows precise measurement. The older colorimetric method measures color change but can overestimate levels by about 1 mg/dL due to interference from other substances like vitamin C.

Your kidneys normally filter uric acid from blood and eliminate it through urine. When your body produces too much or your kidneys remove too little, levels climb in your bloodstream.

Why Uric Acid Levels Matter for Your Health

Most physicians learned about uric acid in the context of two conditions: gout and kidney stones. That narrow focus misses the bigger picture emerging from recent research.

Dr. Richard Johnson is a Professor of Medicine at the University of Colorado Denver, who has authored over 400 articles exploring the role of fructose metabolism in causing obesity, diabetes and kidney disease through the production of uric acid. He found that when we ingest fructose, it produces uric acid within the cells of our body. The resulting uric acid then triggers metabolic pathways that increase fat storage and insulin resistance.

“Our work focuses on how diet (and in particular fructose) may have a role in the epidemics of obesity, diabetes, hypertension and kidney disease, and how those sugars may cause their metabolic effects by raising uric acid levels,” Johnson explained.

This mechanism is an evolutionary adaptation. Uric acid was once a metabolic switch that enabled our ancient ancestors to store fat and survive when food was scarce. Today we never have to go without food (particularly fructose that is added to our processed foods) and the adaptation becomes a detriment.

Comprehensive Health Assessment

Test 28 key longevity biomarkers including uric acid.

Get AgingSOS®
Jinfiniti AgingSOS green gradient background

The Gout Connection

Gout remains the most recognized consequence of a high level of uric acid. The condition occurs when uric acid crystals deposit in joints and soft tissues, triggering sudden, severe pain and inflammation.

The relationship between high uric acid and gout is more complex than most realize. Approximately 85-90% of people with hyperuricemia never develop gout1. Conversely, up to 39% of gout patients show normal uric acid levels during acute attacks because levels temporarily drop as uric acid crystals precipitate from blood into joints2.

Global gout prevalence ranges from 1-4%, but the United States shows the highest burden worldwide with 5.1% of adults affected (about 12.1 million people as of 2017-2018)3. That number jumped from 3.9% just two years earlier, representing nearly 3 million more cases.

Between 2001 and 2021, disability rates from gout in the US nearly doubled. Geographic patterns show clustering in Hawaii, South Carolina, Alabama, and Louisiana, with Hawaii’s rates exceeding double the national average.

Cardiovascular and Metabolic Risk

The cardiovascular connection carries serious implications. Research cited by Dr. David Perlmutter, board-certified neurologist and author of Drop Acid, reveals that for every 1 mg/dL increase in uric acid above 7, all-cause mortality rises 8-13%. Death from cardiovascular disease increases 38%, and stroke risk climbs 35%.

A 2018 study examining 90,000 adults found that uric acid levels above 5.5 mg/dL correlate with increased cardiovascular and metabolic risk, well below the point where gout typically develops4. Dr. Mimi Guarneri, cardiologist and founder of the Academy of Integrative Health and Medicine, routinely checks patients’ uric acid “because of the links with cardiovascular disease.”

The metabolic syndrome connections extend across multiple conditions. A 2023 meta-analysis found that among people with hyperuricemia, 65% had non-alcoholic fatty liver disease compared to much lower rates in those with normal levels. The pooled data showed 1.88 times higher risk of developing fatty liver with elevated uric acid5.

Recent research published in Signal Transduction and Targeted Therapy notes that 43.3 million Americans have hyperuricemia, representing a sharp rise since 19606. The paper links elevated levels to “a spectrum of commodities such as gout, cardiovascular diseases, renal disorders, metabolic syndrome, and diabetes.”

Kidney Disease Links

Multiple large-scale studies demonstrate that elevated uric acid predicts chronic kidney disease development independent of traditional risk factors. A 2008 study following 21,475 healthy volunteers for seven years found that slightly elevated levels (7.0-8.9 mg/dL) nearly doubled the risk for new kidney disease7.

The mechanism differs from gout’s crystal-dependent process. As Dr. Johnson and colleagues discovered, “When laboratory animals with CKD were made hyperuricemic, the renal disease progressed rapidly despite an absence of crystals in the kidney.” Soluble uric acid, not just crystals, drives kidney damage through inflammatory, oxidative, and vascular pathways8.

A 2014 meta-analysis of 15 cohort studies confirmed a positive association between serum uric acid and chronic kidney disease risk in middle-aged patients, independent of established metabolic risk factors9.

Types of Uric Acid Tests

Three testing approaches offer different insights into uric acid metabolism.

Blood (Serum) Test

The uric acid blood test is the most common diagnostic tool, measuring uric acid concentration in blood serum. A healthcare provider draws blood from a vein (typically in your inner elbow or back of hand) and sends it to a laboratory for analysis.

The procedure takes just a few minutes and causes minimal discomfort. You can usually eat and drink normally before the test, though certain medications may affect results (discussed below).

Results typically return within one to three days, depending on the laboratory. The uric acid blood test provides a snapshot of your current levels, making it useful for monitoring treatment and tracking changes over time.

24-Hour Urine Collection

The uric acid urine test offers a comprehensive assessment, measuring total uric acid your body excretes over a full day. This test helps determine whether high blood levels result from overproduction or inadequate kidney excretion, information that guides treatment decisions.

You collect all urineproduced during exactly 24 hours in a special container with preservative, storing samples refrigerated. The lab then measures total uric acid in the combined sample.

This uric acid urine test requires more effort but provides valuable metabolic information blood tests can’t reveal. Avoid alcohol during collection (it reduces kidney uric acid excretion) and maintain normal hydration.

At-Home Testing Options

Emerging point-of-care devices enable home monitoring similar to glucose testing for diabetes. These finger-prick devices provide results within minutes.

Dr. Perlmutter recommends the UASure at-home test kit for regular monitoring, suggesting testing each morning before eating with a target reading of 5.5 mg/dL or lower. This approach allows you to track how dietary changes affect your levels over time.

Home testing kits like Jinfiniti’s AgingSOS offer convenience but shouldn’t replace professional medical evaluation when needed. Use it as a monitoring tool between regular checkups.

Understanding Your Test Results

Reference ranges on lab reports can mislead if you don’t understand what “normal” actually means.

Standard Reference Ranges

Laboratory reference ranges typically show:

GenderStandard Range (mg/dL)Alternative Range (µmol/L)
Males2.5-7.0 or 4.0-8.6208-400
Females1.5-6.0 or 3.0-7.1155-400

Mayo Clinic Laboratory sets reference values for males ages 13 and above at 2.7-6.1 mg/dL. These ranges vary slightly among laboratories.

More importantly, they were derived primarily based on gout risk, the point where uric acid begins crystallizing in joints and blood vessels.

The Optimal Level Debate

A significant gap exists between laboratory “normal” ranges and optimal health targets.

Dr. Perlmutter strongly advocates for more stringent targets. “The optimal level is below 5.5, so it’s significantly lower [than 7 mg/dL],” he states. “The cardiometabolic issues begin at 5.5.”

The traditional ranges relate to gout, the point above 7 mg/dL where uric acid precipitates into crystals. But metabolic dysfunction starts well before crystals form.

At Jinfiniti Precision Medicine, founder Dr. Jin-Xiong She explains the importance of this distinction: “We include uric acid in our AgingSOS panels because it serves as an early warning system for metabolic dysfunction. When we see levels creeping above 5.5 mg/dL, even if still within the laboratory reference range, we know cellular metabolism is already being affected. This allows us to intervene before diseases like diabetes or cardiovascular problems develop.”

Dr. Giovanni Desideri and colleagues, writing in European Heart Journal, advocate that “a threshold value < 6.0 mg/dL (< 360 µmol/L) seems to better identify true ‘healthy subjects’ and should reasonably be considered for all subjects.”4

This represents a paradigm shift toward preventive medicine focused on optimal rather than merely “normal” values.

What High Levels Mean

Hyperuricemia is clinically defined as levels exceeding 6.8 mg/dL, the saturation point where urate becomes supersaturated at normal body temperature. Mayo Clinic defines it as greater than 6.0 mg/dL in women and 7.0 mg/dL in men.

A high uric acid level can result from:

  • Overproduction: Diet high in purines, rapid cell turnover (cancer, chemotherapy), genetic factors, or fructose consumption
  • Underexcretion: Impaired kidney function, dehydration, certain medications (diuretics, low-dose aspirin), or metabolic conditions

About 14.6% of US adults (approximately 32.5 million people) have hyperuricemia, though most remain asymptomatic.

What Low Levels Mean

While high levels receive most attention, a low uric acid level can also indicate problems. Ranges below 2.0 mg/dL may suggest:

  • Wilson’s disease (genetic copper metabolism disorder)
  • Fanconi syndrome (kidney tubule dysfunction)
  • Certain medications
  • Low-purine diet combined with high fluid intake

Recent research proposes the concept of “dysuricemia,” recognizing that both excessively high and low levels represent pathological states. At physiological concentrations around 5 mg/dL, uric acid demonstrates antioxidant effects by scavenging free radicals. Above 5.5-6.0 mg/dL, it promotes inflammation and cellular damage.

A low uric acid level may seem harmless, but extremely low values can indicate underlying health conditions requiring medical attention.

🧬 MORE BIOMARKER TESTING

When Should You Get a Uric Acid Test?

Healthcare providers order uric acid tests under specific circumstances:

  • You have unexplained joint pain, particularly sudden severe pain with redness and swelling in your big toe. Recurrent attacks of joint inflammation warrant testing even if previous tests were normal (levels can drop during acute flares).
  • Your doctor monitors you during chemotherapy or radiation. Rapid cell turnover releases large amounts of purines, sometimes causing dangerous spikes requiring intervention.
  • You experience recurrent kidney stones. About 10-15% of kidney stones contain uric acid, and testing helps determine if elevated levels contribute to stone formation.
  • You’re assessing cardiovascular or metabolic risk. Given emerging research on uric acid’s role in heart disease, diabetes, and metabolic syndrome, progressive practitioners include it in comprehensive health assessments.
  • You’re investigating symptoms like blood in urine, frequent urination, sharp back or side pain, or unexplained fatigue that might indicate kidney dysfunction.
  • You have conditions associated with altered uric acid levels: chronic kidney disease, diabetes, hypertension, or metabolic syndrome.

Testing makes particular sense if you’re focused on longevity and healthy aging since uric acid provides early warning of metabolic dysfunction before disease develops.

How to Prepare for the Test

Blood tests generally require no special preparation. You can eat and drink normally before testing.

Certain medications affect results and should be reported to your healthcare provider:

  • Aspirin and other salicylates
  • Ibuprofen and NSAIDs
  • Diuretics (water pills)
  • Niacin supplements
  • Gout medications (allopurinol, probenecid)
  • Some blood pressure medications

Don’t stop prescribed medications without consulting your doctor. Simply inform the provider so they can interpret results appropriately.

For 24-hour urine collection, avoid alcohol during the collection period since it reduces kidney excretion of uric acid. Maintain your normal diet and hydration unless instructed otherwise.

The blood draw itself follows standard venipuncture procedure. After sterilizing the site, the provider wraps an elastic band around your arm to fill veins, inserts a needle to draw blood into vials, then removes the band and needle and applies pressure with a bandage. Minor bruising may occur but typically resolves quickly.

What Affects Uric Acid Levels?

Multiple factors influence your test results beyond underlying health conditions.

Diet and Fructose

Fructose stands out as the primary dietary driver of elevated uric acid. Unlike glucose, fructose metabolism uniquely generates uric acid inside cells through a process that depletes cellular energy (ATP).

Dr. Perlmutter emphasizes this connection: “Uric acid is not just the cause of gout; it is intricately linked with the processes involved in weight gain, fat accumulation.”

Major dietary sources that raise uric acid:

  • High-fructose corn syrup in sodas and processed foods (a single can of regular soda contains about 23 grams of fructose)
  • Table sugar/sucrose (50% fructose content)
  • Fruit juice in large amounts
  • Red meat and organ meats (liver, kidney)
  • Certain seafood (anchovies, sardines, mussels, scallops)
  • Some vegetables (asparagus, spinach)
  • Beer and other alcoholic beverages

Alcohol is particularly problematic because it both increases uric acid production and decreases kidney excretion.

The impact of diet on NAD+ levels and cellular health connects to uric acid metabolism since both involve how your body processes nutrients for energy.

Medications and Supplements

Many common medications affect uric acid levels:

Medications that increase levels:

  • Diuretics (especially thiazides)
  • Low-dose aspirin
  • Niacin
  • Cyclosporine
  • Levodopa

Medications that decrease levels:

  • Allopurinol
  • Febuxostat
  • Probenecid
  • Losartan
  • High-dose vitamin C

Always inform your healthcare provider about all medications and supplements before testing. The effect doesn’t necessarily mean you should stop the medication, just that results should be interpreted in that context.

Medical Conditions

Various health conditions alter uric acid metabolism:

Conditions that increase levels:

  • Chronic kidney disease
  • Diabetes
  • Metabolic syndrome
  • Hypertension
  • Psoriasis
  • Hypothyroidism
  • Certain cancers
  • Obesity

Conditions that decrease levels:

  • Liver disease
  • Wilson’s disease
  • Fanconi syndrome
  • SIADH (syndrome of inappropriate antidiuretic hormone)

Dehydration temporarily concentrates uric acid in blood. Strenuous exercise can cause transient elevations through muscle breakdown and dehydration.

Understanding these factors helps distinguish between concerning chronic elevations and temporary fluctuations. This connects to broader patterns of oxidative stress and metabolic dysfunction that affect multiple body systems.

The Role of Uric Acid Testing in Gout Management

For those with diagnosed gout, uric acid testing guides treatment decisions.

The 2020 American College of Rheumatology guidelines establish a treat-to-target approach with specific recommendations10:

Treatment targets:

  • Standard goal: Below 6 mg/dL for most gout patients
  • Severe disease goal: Below 5 mg/dL for patients with tophi (visible uric acid deposits)
  • Serial monitoring: Regular testing to guide medication dose adjustments

The test isn’t definitive for diagnosing gout, though. Only analyzing joint fluid for monosodium urate crystals conclusively confirms the condition. Synovial fluid analysis using polarized light microscopy shows the characteristic needle-shaped, negatively birefringent crystals.

Key testing considerations for gout:

  • Up to 39% of gout patients show normal uric acid during acute attacks
  • Levels drop temporarily as crystals precipitate from blood into joints
  • Repeat testing or joint fluid analysis may be needed if clinical suspicion remains high
  • Regular monitoring after starting treatment ensures medication effectiveness

Despite clear guidelines, evidence shows delivery of gout care remains suboptimal. A 2015 study found that among Americans with gout receiving urate-lowering therapy, only a minority achieved the target level below 6 mg/dL11. Inadequate dose titration and poor adherence contribute to this treatment gap.

Current Research and Uric Acid’s Dual Nature

Recent research reveals uric acid’s paradoxical properties. At concentrations around 5 mg/dL, it demonstrates protective antioxidant effects by scavenging free radicals. Above 5.5-6.0 mg/dL, it promotes cellular senescence, inflammation, and oxidative damage.

Key findings from genetic studies:

Sophisticated genetic studies using Mendelian randomization (examining genetic variants affecting uric acid levels) have yielded mixed results on causality. Several studies found no direct causal relationship between elevated uric acid and risks of diabetes, coronary heart disease, or stroke.

“The only phenotypes that were causally associated with [hyperuricemia] were gout and kidney disease,” according to a 2024 review. Yet clinical and epidemiological studies consistently link hyperuricemia with cardiovascular disease, fatty liver, hypertension, insulin resistance, and obesity.

This suggests uric acid may be a marker of underlying metabolic dysfunction even if not always the direct cause.

Promising intervention trials:

Clinical trials examining whether lowering uric acid improves outcomes show promise in specific populations. A 2022 meta-analysis of febuxostat (a urate-lowering medication) in chronic kidney disease patients demonstrated significant benefits12:

  • Serum uric acid decreased by 146 µmol/L
  • Kidney function (estimated glomerular filtration rate) improved by 3.21 mL/min
  • Serum creatinine decreased by 15.27 µmol/L
  • Serum urea nitrogen fell by 2.37 mmol/L

This emerging understanding parallels research on cellular senescence and aging, where multiple interconnected processes contribute to metabolic dysfunction rather than single causes.

Interpreting Results: Beyond the Numbers

Your test results tell a story beyond the number on the report.

When treatment may not be needed:

A single elevated reading doesn’t automatically warrant treatment if you have no symptoms or risk factors. The 2020 ACR guidelines conditionally recommend against treating asymptomatic hyperuricemia even with comorbid cardiovascular disease, kidney disease, or hypertension.

Uncertainty remains about whether treating isolated elevation prevents future complications.

When proactive intervention makes sense:

If you’re focused on optimal health and longevity rather than just disease prevention, targeting levels below 5.5 mg/dL makes sense based on current research. This proactive approach aligns with precision medicine principles, addressing dysfunction before disease develops.

What to consider when reviewing your results:

  • Serial measurements provide more value than single readings
  • Trending upward over time signals worsening metabolic function
  • Your full clinical picture matters: family history, cardiovascular risk factors, kidney function, diet quality
  • Other biomarkers of aging provide context

Uric acid represents one piece of the metabolic health puzzle. The comprehensive assessment matters.

That’s why Jinfiniti includes uric acid alongside 27 other biomarkers in the AgingSOS Advanced Panel, providing the full metabolic context needed for truly personalized health optimization.

Test Uric Acid With Jinfiniti’s AgingSOS Panel

Jinfiniti’s AgingSOS Advanced Panel measures uric acid alongside rare biomarkers not routinely tested elsewhere, including intracellular NAD+ and klotho (the longevity protein).

What the comprehensive panel includes:

  • 28 total biomarkers covering multiple health systems
  • Inflammation status markers
  • Oxidative stress measurements
  • Cellular senescence indicators
  • Metabolic health metrics
  • Cardiovascular risk factors

The panel detects issues years before symptoms appear, allowing early intervention. Each test includes a free consultation to review results and develop a personalized optimization plan.

Convenient testing options:

  • Mobile phlebotomy available for at-home blood collection
  • CLIA-certified laboratory processing
  • Results typically within 1-2 weeks
  • Personalized interpretation and recommendations

The TAO approach in action:

The testing philosophy follows Jinfiniti’s TAO approach: Test to establish baseline, Act with targeted interventions based on results, and Optimize through continuous monitoring and adjustment.

Rather than treating individual biomarkers in isolation, the comprehensive panel reveals how systems interact. Your uric acid level makes more sense when viewed alongside inflammation markers, kidney function, metabolic indicators, and cellular health measurements.

Referenced Sources

  1. Zhang, W.-Z. Why Does Hyperuricemia Not Necessarily Induce Gout?Biomolecules vol. 11 280 https://doi.org/10.3390/biom11020280 (2021).
  2. Leiszler, M., Poddar, S. & Fletcher, A. Clinical inquiry. Are serum uric acid levels always elevated in acute gout? Journal of Family Practice 60 10, 618–20 (2011).
  3. Singh, G., Lingala, B. & Mithal, A. Gout and Hyperuricaemia in the USA: Prevalence and Trends. Rheumatology vol. 58 2177–2180 https://doi.org/10.1093/rheumatology/kez196 (2019).
  4. Desideri, G. et al. Is it time to revise the normal range of serum uric acid levels? European Review for Medical and Pharmacological Sciences 18 9, 1295–306 (2014).
  5. Sun, Q. et al. Association Between Serum Uric Acid and Non-Alcoholic Fatty Liver Disease: An Updated Systematic Review and Meta-Analysis. Clinical Epidemiology vol. Volume 15 683–693 https://doi.org/10.2147/clep.s403314 (2023).
  6. Du, L. et al. Hyperuricemia and Its Related Diseases: Mechanisms and Advances in Therapy. Signal Transduction and Targeted Therapy vol. 9 https://doi.org/10.1038/s41392-024-01916-y (2024).
  7. Obermayr, R. P. et al.Elevated Uric Acid Increases the Risk for Kidney Disease. Journal of the American Society of Nephrology vol. 19 2407–2413 https://doi.org/10.1681/asn.2008010080 (2008).
  8. Johnson, R. J. et al. Uric Acid and Chronic Kidney Disease: Which Is Chasing Which?Nephrology Dialysis Transplantation vol. 28 2221–2228 https://doi.org/10.1093/ndt/gft029 (2013).
  9. Zhu, P., Liu, Y., Han, L., Xu, G. & Ran, J. Serum Uric Acid Is Associated with Incident Chronic Kidney Disease in Middle-Aged Populations: A Meta-Analysis of 15 Cohort Studies. PLoS ONE vol. 9 e100801 https://doi.org/10.1371/journal.pone.0100801 (2014).
  10. FitzGerald, J. D. et al. 2020 American College of Rheumatology Guideline for the Management of Gout. Arthritis & Rheumatology vol. 72 879–895 https://doi.org/10.1002/art.41247 (2020).
  11. Juraschek, S. P., Kovell, L. C., Miller, E. R. & Gelber, A. C. Gout, Urate‐Lowering Therapy, and Uric Acid Levels Among Adults in the United States. Arthritis Care & Research vol. 67 588–592 https://doi.org/10.1002/acr.22469 (2015).
  12. Zheng, Y. & Sun, J. Febuxostat Improves Uric Acid Levels and Renal Function in Patients with Chronic Kidney Disease and Hyperuricemia: A Meta-Analysis. Applied Bionics and Biomechanics vol. 2022 1–7 https://doi.org/10.1155/2022/9704862 (2022).
Hand holding small glass vial dispensing white capsules or liquid drops into open palm against blue sky with clouds.

Sublingual NMN vs Capsules: Which is Best for Absorption?

If you’ve been researching NMN supplements, you’ve probably encountered claims that sublingual powder absorbs better than capsules. Some brands insist you hold NMN under your tongue for maximum benefit.

The reality? Both methods get NMN into your system. The question isn’t whether one works—it’s which fits your lifestyle while delivering results you can measure.

What You Should Know

  • Oral NMN (capsules or powder) reaches your bloodstream within 2.5 to 10 minutes
  • No published human studies directly compare sublingual versus oral absorption rates
  • Every major clinical trial proving NMN benefits used oral administration, not sublingual
  • Your small intestine has dedicated transporters designed specifically for NMN uptake

How Your Body Actually Absorbs NMN

When you take nicotinamide mononucleotide (an NAD+ precursor), your body uses a specialized transport protein called Slc12a8. This sodium-dependent transporter sits in your small intestine, particularly concentrated in the jejunum and ileum—the core of your digestive system’s nutrient absorption zone.

Researchers at Washington University School of Medicine discovered this transporter changes everything we thought about NMN absorption. The Slc12a8 protein specifically recognizes NMN molecules and shuttles them directly into cells—no conversion needed[1].

Here’s what makes this finding significant: scientists previously assumed NMN had to convert to another compound (nicotinamide riboside) before entering cells. That conversion still happens to some degree, but the majority of NMN enters through this dedicated transporter when you take it orally[1].

NAD+ plays a critical role in cellular energy production—it’s the molecule that helps convert food into ATP (your cells’ energy currency). Without sufficient NAD+, energy production stalls.

The small intestine is where Slc12a8 lives in highest concentrations. When you swallow NMN—whether in capsules, powder mixed with water, or held under your tongue before swallowing—it eventually reaches these transporters.

Oral NMN Works Faster Than You Think

Research using isotope-labeled NMN reveals surprisingly quick absorption. Studies show NMN enters blood circulation between 2.5 and 10 minutes after oral intake, with plasma levels peaking around 5-10 minutes[2].

Within 15-30 minutes, NMN reaches your liver and begins converting to NAD+[3].

A 2022 clinical trial involving 80 middle-aged adults tested oral NMN at three doses: 300mg, 600mg, and 900mg daily. After 30 days, blood NAD+ levels increased significantly at all doses, with the highest elevation at 600-900mg[4]. The study found no safety concerns and reported improved physical performance.

Another trial by Dr. Jun Yoshino at Washington University gave 250mg of oral NMN daily to prediabetic women for 10 weeks. Muscle insulin sensitivity improved measurably. A separate study found 250mg daily boosted blood NAD+ by roughly 40% within a month[5].

These results came from standard oral administration—participants swallowed capsules or mixed powder with water.

CLIA-Certified NAD Test Kit

Test your NAD+ levels from home.

Get the NAD+ Test
Jinfiniti Intracellular NAD Test on purple background

The Sublingual NMN Absorption Question

Marketing materials often claim sublingual NMN offers higher bioavailability than capsules—specifically 2-3 times better absorption. You’ll see numbers like 80% bioavailability for sublingual versus 20-30% for oral.

Here’s the problem: no peer-reviewed human clinical trial directly comparing these methods exists in scientific databases.

Sublingual delivery does work for certain compounds. The tissue under your tongue has rich blood vessel networks and thin epithelium (surface layers). Substances absorbed here enter your bloodstream directly, bypassing digestion and initial liver processing—theoretically offering faster absorption.

For sublingual absorption to provide real advantages, though, the compound needs to penetrate oral mucosa efficiently before you swallow. NMN is water-soluble with specific molecular properties that may not optimize sublingual uptake. Substances that absorb best under the tongue typically have higher fat solubility.

Dr. Andrew Huberman of Stanford reports taking NMN sublingually at doses of 1-2 grams daily, noting sustained energy. He acknowledges these observations are personal and not clinical proof. Interestingly, Huberman also takes 500mg of nicotinamide riboside without specifying sublingual use, suggesting both routes work.

Dr. David Sinclair, the Harvard longevity researcher who popularized NMN supplementation, takes his NMN orally mixed with yogurt each morning. If sublingual delivery offered clear superiority, one of NMN’s most prominent advocates would likely use it.

What Clinical Trials Actually Show

Every major NMN study published in peer-reviewed journals used oral capsules or powder mixed with water—not sublingual formulations.

These trials consistently demonstrated NAD+ elevation and measurable health improvements:

  • An 80-participant multicenter trial found oral doses of 300-900mg daily increased blood NAD+ significantly, with best results at 600-900mg[4]
  • A Japanese study showed 250mg oral NMN daily improved walking speed and sleep quality in older adults[6]
  • Washington University researchers demonstrated 250mg oral NMN enhanced muscle insulin sensitivity[5]
  • Multiple safety studies confirm oral NMN up to 1,250mg daily is well-tolerated with no serious side effects[7]

The dosing guidelines we have—the amounts known to produce benefits—come from oral administration studies. When brands recommend sublingual doses, they’re extrapolating from oral research.

“The discovery of Slc12a8 as a specific NMN transporter in the small intestine demonstrates that oral delivery targets the exact location where your body is designed to absorb this molecule,” notes Dr. Jin-Xiong She, founder of Jinfiniti Precision Medicine. “What matters most isn’t whether you hold it under your tongue—it’s consistent daily intake and measuring your response through NAD+ testing.”

The First-Pass Metabolism Myth

A common argument for sublingual delivery: it bypasses “first-pass metabolism” in your liver, theoretically improving bioavailability.

This principle applies to many drugs. But NMN behaves differently than traditional pharmaceuticals.

Recent isotope-labeling studies reveal complex NMN metabolism. Only a small portion absorbs intact after oral intake. Your gut microbiota (intestinal bacteria) converts most of it to nicotinamide and nicotinic acid through a process called deamidation. These metabolites then contribute to NAD+ through alternative pathways[8].

This bacterial processing happens before systemic absorption—meaning sublingual administration wouldn’t completely avoid it. Even NMN that reaches your bloodstream intact undergoes further metabolism in various tissues.

The key insight: your body uses multiple pathways to create NAD+ from NMN. The route matters less than the end result.

Powder vs Lozenge vs Capsule: Practical Differences

NMN supplement capsule against sky blue background

Jinfiniti offers NMN in multiple formats because different people prefer different methods.

  • Sublingual lozenges (like Jinfiniti’s Vitality NAD+ Booster Lozenge) dissolve under your tongue over 30-60 seconds. They may provide slightly faster initial absorption and some people report quicker energy onset. The sublingual route definitely bypasses stomach acid entirely.
  • Oral powder (like Jinfiniti’s Vitality NAD+ Booster Powder or Pure NMN Powder) mixes with water or yogurt. You can drink it immediately or hold it under your tongue first. This format offers dosing flexibility and typically costs less per milligram.
  • Capsules deliver precise, consistent doses without measuring. You swallow them immediately. Clinical trials establishing NMN safety and effectiveness predominantly used this format.

The absorption speed difference between these methods comes down to minutes—both reach your bloodstream quickly. For long-term NAD+ levels and health benefits, sustained daily intake matters more than whether absorption takes 3 minutes or 10 minutes.

The Gut Microbiome Factor

Your intestinal bacteria interact with oral NMN in unexpected ways. Studies using traceable NMN molecules show gut microbiota deamidates roughly 25-75% of orally taken NMN before it absorbs[9].

Researchers tested this by giving antibiotics to deplete gut bacteria. Animals with reduced microbiomes showed increased intact NMN absorption and higher NAD+ levels, suggesting bacteria compete for NMN.

This finding led to development of enteric-coated capsules designed to protect NMN from stomach acid and microbial degradation until reaching the small intestine. These formulations claim up to 7-fold increased bioavailability.

Sublingual administration completely bypasses gut bacteria. That sounds advantageous—except research also shows bacterial conversion of NMN contributes to NAD+ through alternative synthesis pathways. Blocking this process doesn’t necessarily improve overall outcomes.

Your body is adaptable. It uses whatever NMN-derived compounds reach your system, regardless of route.

Liposomal NMN: Worth the Premium Price?

Liposomal formulations wrap NMN in tiny fat bubbles (lipid vesicles) designed to protect the molecule and improve cellular uptake. Manufacturers position liposomal NMN as a premium option with superior absorption.

One small study in healthy men found liposomal NMN increased blood NAD+ levels by 84% after four weeks—significantly outperforming standard NMN. The liposomal group maintained elevated NAD+ even four weeks after stopping supplementation[10].

That sounds impressive. But here’s the context: liposomal delivery systems were designed for fat-soluble compounds that struggle with absorption. NMN is water-soluble and already has dedicated intestinal transporters (Slc12a8) that handle absorption efficiently.

Every clinical trial demonstrating NMN’s health benefits—improved insulin sensitivity, better physical performance, reduced biological aging—used regular powder or capsules, not liposomal forms. The long-term safety data comes from standard formulations.

Liposomal NMN costs substantially more per milligram. If you’re deciding between liposomal NMN and regular NMN plus NAD+ testing, the testing provides more value—you’ll know definitively whether your supplement works rather than hoping a premium delivery system makes a difference.

🧬 MORE ON NMN DELIVERY

  • Wondering about powder versus pill form? Our detailed NMN dosage guide covers optimal amounts and timing for different formats.
  • Want to compare all NAD+ precursors? Check which NAD+ supplement might work best based on your specific health goals.
  • Curious about combining NMN with other compounds? Learn why taking NMN with resveratrol amplifies cellular benefits through complementary pathways.

What Matters More Than Delivery Method

The debate over capsules versus sublingual misses a bigger point: NMN works through consistent supplementation over time, not acute dosing.

NAD+ levels don’t spike from a single dose and stay elevated. You need daily intake to maintain higher levels. Clinical trials showing health benefits ran for weeks or months—not days.

Whether NMN absorbs in 3 minutes (sublingual) or 10 minutes (oral) becomes irrelevant when you’re supplementing daily for months. The cumulative effect drives results.

Testing your intracellular NAD+ levels before and during supplementation reveals what actually works for your body. Some people respond robustly to 250mg daily. Others need 600-900mg to reach optimal ranges (40-100μM).

Jinfiniti’s approach centers on measurement rather than assumption. You test, supplement, then retest to confirm your NAD+ levels improved.

Dosing Based on Clinical Evidence

Human trials provide practical dosing guidance:

  • Starting dose: 250mg daily has shown benefits across multiple studies with excellent safety records
  • Moderate dose: 300-600mg daily appears optimal for NAD+ elevation and metabolic improvements based on dose-response research
  • Higher dose: 900-1,000mg daily represents the upper studied range with no safety concerns, though benefits may plateau beyond 600mg
  • Timing: Most studies gave NMN in the morning, often before meals, aligning with your body’s natural NAD+ rhythms

These amounts apply to oral administration—the method used in the research. If you prefer sublingual powder or lozenges, starting in this range makes sense while you test your individual response.

The Cost-Effectiveness Angle

Specialized NMN formulations command premium prices. Liposomal versions, enteric-coated capsules, and some sublingual products cost significantly more per milligram than standard powder or capsules.

These formats may offer advantages. Enteric coating protects NMN from stomach acid. Liposomal encapsulation theoretically improves cellular uptake.

But here’s what we know with certainty: regular powder and capsules work. Clinical trials proving NMN benefits for longevity, healthy aging, and metabolic health used standard formulations.

Spending extra for unproven bioavailability gains makes less sense than investing in NAD+ testing to verify your chosen method actually works for you.

Jinfiniti’s Vitality NAD+ Booster combines NMN with creatine monohydrate, D-ribose, and niacinamide—a multi-pathway formula that clinical trials show increases NAD+ more effectively than NMN alone. Available as both powder and lozenge, it gives you format choice without sacrificing the synergistic formulation.

How to Choose Your NMN Format

Consider these factors when selecting between sublingual and oral:

🧬 Choose sublingual lozenges if:

  • You want potentially faster initial absorption
  • You prefer not swallowing capsules
  • You don’t mind holding something under your tongue briefly
  • You like having a defined serving in lozenge form

🧬 Choose oral powder if:

  • You want dosing flexibility
  • You prefer mixing with beverages or food
  • You want the most cost-effective option per milligram
  • You like measuring your own servings

🧬 Choose capsules if:

  • You want the easiest, most convenient method
  • You prefer precise, consistent dosing without measuring
  • You’re following dosing protocols from clinical trials
  • You value the format used in published research

Honestly? Any of these methods can work. The best format is the one you’ll take consistently every day.

Testing Beats Guessing

Arguments about absorption rates and bioavailability percentages become academic when you can measure actual results.

Jinfiniti’s Intracellular NAD+ Test provides CLIA-certified measurement of your NAD+ levels using a simple at-home finger prick. Results come back in about a week.

Test before starting supplementation. Take your chosen NMN format for 4-6 weeks. Test again.

If your levels moved from deficient (under 40μM) into optimal range (40-100μM), your approach works—regardless of delivery method. If levels didn’t improve enough, adjust your dose or try a different formulation.

This test-and-verify approach removes guesswork. You know definitively whether your NMN supplementation produces measurable cellular changes.

Dr. She developed Jinfiniti’s testing to address precisely this issue: too many people spend money on supplements without confirming they’re having the intended effect.

The Bottom Line on NMN Delivery

Sublingual NMN may offer marginal advantages in absorption speed. Oral capsules have the strongest clinical backing from published research. Powder provides flexibility and value.

All three methods successfully deliver NMN into your system and can increase NAD+ levels when used consistently.

The most important factors aren’t about delivery route:

  1. Take NMN daily, not sporadically
  2. Use adequate doses (250-600mg for most people)
  3. Choose pharmaceutical-grade purity
  4. Verify results through NAD+ testing
  5. Pair with complementary compounds like creatine and D-ribose

Jinfiniti’s Vitality NAD+ Booster addresses that last point by combining NMN with synergistic ingredients in both powder and lozenge formats. Clinical trials show this multi-pathway formula helps 85% of users reach optimal NAD+ levels within 4 weeks—significantly better than NMN alone.

Whether you swallow, dissolve under your tongue, or mix with morning coffee matters far less than consistent intake and measurement. The right format is whichever one you’ll actually use every single day for months.

Referenced Sources

  1. 1. Grozio A, Mills KF, Yoshino J, Bruzzone S, Sociali G, Tokizane K, et al. Slc12a8 is a nicotinamide mononucleotide transporter. Springer Science and Business Media LLC; 2019. https://doi.org/10.1038/s42255-018-0009-4
  2. 2. Shade CW. The Science Behind NMN-A Stable, Reliable NAD+Activator and Anti-Aging Molecule. Integrative Medicine 2020;19 1:12–14.
  3. 3. Mills KF, Yoshida S, Stein LR, Grozio A, Kubota S, Sasaki Y, et al. Long-Term Administration of Nicotinamide Mononucleotide Mitigates Age-Associated Physiological Decline in Mice. Elsevier BV; 2016. https://doi.org/10.1016/j.cmet.2016.09.013
  4. 4. Yi L, Maier AB, Tao R, Lin Z, Vaidya A, Pendse S, et al. The efficacy and safety of β-nicotinamide mononucleotide (NMN) supplementation in healthy middle-aged adults: a randomized, multicenter, double-blind, placebo-controlled, parallel-group, dose-dependent clinical trial. Springer Science and Business Media LLC; 2022. https://doi.org/10.1007/s11357-022-00705-1
  5. 5. Yoshino M, Yoshino J, Kayser BD, Patti GJ, Franczyk MP, Mills KF, et al. Nicotinamide mononucleotide increases muscle insulin sensitivity in prediabetic women. American Association for the Advancement of Science (AAAS); 2021. https://doi.org/10.1126/science.abe9985
  6. 6. Morifuji M, Higashi S, Ebihara S, Nagata M. Ingestion of β-nicotinamide mononucleotide increased blood NAD levels, maintained walking speed, and improved sleep quality in older adults in a double-blind randomized, placebo-controlled study. Springer Science and Business Media LLC; 2024. https://doi.org/10.1007/s11357-024-01204-1
  7. 7. Igarashi M, Nakagawa-Nagahama Y, Miura M, Kashiwabara K, Yaku K, Sawada M, et al. Chronic nicotinamide mononucleotide supplementation elevates blood nicotinamide adenine dinucleotide levels and alters muscle function in healthy older men. Springer Science and Business Media LLC; 2022. https://doi.org/10.1038/s41514-022-00084-z
  8. 8. Yaku K, Palikhe S, Iqbal T, Hayat F, Watanabe Y, Fujisaka S, et al. Nicotinamide riboside and nicotinamide mononucleotide facilitate NAD             +             synthesis via enterohepatic circulation. American Association for the Advancement of Science (AAAS); 2025. https://doi.org/10.1126/sciadv.adr1538
  9. 9. Kim LJ, Chalmers TJ, Madawala R, Smith GC, Li C, Das A, et al. Nicotinamide mononucleotide (NMN) deamidation by host-microbiome interactions. Cold Spring Harbor Laboratory; 2020. https://doi.org/10.1101/2020.09.10.289561
  10. 10. Kawakami S, Maeda Y, Fukuzawa Y. Intervention Study Comparing Blood NAD+ Concentrations with Liposomal and Non-Liposomal Nicotinamide Mononucleotide. Annals of Clinical and Medical Case Reports; 2025. https://doi.org/10.47829/acmcr.2025.141102
Oyster mushrooms, rich in ergothioneine, growing in the forest

Is Ergothioneine the Next Big Longevity Nutrient?

Until recently, ergothioneine was an obscure amino acid derivative hiding in plain sight in everyday foods. Now some leading scientists are calling it a potential “longevity vitamin” because of how specifically the body absorbs and distributes it.

New data suggest it doesn’t just act as an antioxidant — it may also elevate NAD+ in a unique way, linking it directly to multiple aging mechanisms.

What You Should Know

  • Your body can’t make ergothioneine and must get it entirely through diet, mostly from mushrooms
  • A dedicated transporter protein specifically moves ergothioneine to tissues most vulnerable to age-related damage
  • Recent studies show it boosts NAD+ levels, improves exercise endurance, and protects cognitive function
  • Studies link higher blood levels to 21% lower cardiovascular mortality and 50% reduced cognitive decline risk

What is Ergothioneine?

Ergothioneine (L-ergothioneine or EGT) is a naturally occurring, sulfur-containing amino acid derivative. It was originally extracted in 1909 from the fungus Claviceps purpurea. Unlike common vitamins, humans and animals cannot produce this compound internally.

Ergothioneine can only be taken in through food. It is produced naturally by specific fungi (particularly mushrooms), bacteria, and actinomycetes.

What makes ergothioneine different from thousands of other compounds you eat is that your body developed a specialized transporter protein for it called OCTN1 (also SLC22A4). This gives reason to believe it has evolutionary importance.

Why Scientists Consider It a “Longevity Vitamin”

Ergothioneine was proposed as a “longevity vitamin” by Dr. Bruce Ames, one of the most frequently cited biochemists in history, in his seminal 2018 paper on the Triage Theory[1]. His theory asserts that even adequate intake of known vitamins may not be sufficient for extending healthspan if certain compounds like ergothioneine are deficient.

Ergothioneine meets several criteria for longevity vitamin classification:

  • Diet-derived (cannot be synthesized by humans)
  • Has a dedicated evolutionary conserved transporter
  • Accumulates in stress-vulnerable tissues
  • Is inversely associated with markers of aging and disease risk

Dr. Linda May-Zhang, Vice President of Science & Innovation at Blue California, explained: “Inside our cells, ergothioneine helps neutralize harmful free radicals, bind to excess metals like iron and copper and activate Nrf2, the body’s master switch for antioxidant defenses. It also helps protect mitochondria, the ‘powerhouses’ of our cells, to keep energy and function strong.”

Food Sources of Ergothioneine

Closeup of oyster mushroom cap

Mushrooms are by far the richest dietary source of ergothioneine. Concentrations vary significantly among species, with some varieties containing extraordinarily high amounts.

The highest ergothioneine content is found in:

  • Golden Oyster mushrooms: 2,010 μg/g (dry weight)
  • Porcini mushrooms: 1,812 μg/g
  • King Oyster mushrooms: 1,720 μg/g
  • Maitake mushrooms: 1,130 μg/g
  • Shiitake mushrooms: High levels (values vary by growing conditions)

Unlike plants and animals, mushrooms can naturally produce ergothioneine themselves. This makes them the most efficient dietary delivery system for obtaining meaningful amounts.

A single serving of oyster mushrooms can provide more ergothioneine than most people consume in an entire week from other sources.

Other Dietary Sources Worth Noting

While concentrations are considerably lower than in mushrooms, ergothioneine can also be found in:

Animal products:

  • Liver (especially kidney and red blood cells contain moderate amounts)
  • These levels reflect the ergothioneine animals consumed from their own diets

Legumes:

  • Black beans, kidney beans, and red beans (especially when grown with mycorrhizal fungi)
  • A 2023 study found black beans showed up to 72 times more ergothioneine when grown with beneficial soil fungi[2]

Grains and fermented foods:

  • Oat bran and wheat (particularly when cultivated with specific soil fungi)
  • Tempeh, natto, miso, kimchi, and sauerkraut contain small amounts
  • Spirulina contains relatively high amounts compared to other non-fungal sources

Typical dietary intake ranges from 5-20 mg per day depending on mushroom consumption patterns.

How Ergothioneine Works at the Cellular Level

In 2005 Dr. Dirk Gründemann, then at the University of Cologne, made a key discovery regarding the ergothioneine transporter OCTN1. He showed that OCTN1 transports ergothioneine with an efficiency that was nearly 100-fold higher than for previously thought possible substrates[3].

The transporter binds ergothioneine with high affinity (Km of 21 μM). A 1 μM concentration of ergothioneine increased OCTN1 expression by as much as 600-fold in terms of its capacity to increase cellular uptake.

This degree of specificity is quite extraordinary. Gründemann suggested naming OCTN1 the “ergothioneine transporter” (ETT) to reflect its predominant biological role.

It Concentrates Where You Need It Most

Once absorbed, ergothioneine is transported via OCTN1 and concentrates in tissues most vulnerable to oxidative stress:

  • Erythrocytes (red blood cells)
  • Eye lens
  • Liver and kidney
  • Brain (particularly mitochondria and nucleus)
  • Skin
  • Bone marrow and semen

This preferential accumulation in stress-vulnerable tissues strongly supports its protective role. Your cells can maintain millimolar concentrations of ergothioneine in certain tissues, suggesting they actively work to retain it.

The compound persists in tissues with relatively long residence times. After supplementation stops, whole blood levels remain elevated for weeks.

The Breakthrough NAD+ Discovery

One of the most significant recent discoveries came from 2024-2025 research that identified ergothioneine’s direct impact on mitochondrial function and NAD+ levels.

Research published in Cell Metabolism found that ergothioneine accumulates in muscle mitochondria during exercise training and binds to the enzyme 3-mercaptopyruvate sulfurtransferase (MPST)[4].

This binding activates MPST, which produces hydrogen sulfide (H₂S) and pyruvate, boosting mitochondrial respiration. The mechanism works as follows:

  1. Ergothioneine binds to MPST with high affinity (Kd of 3.2 μM)
  2. MPST activation increases H₂S production
  3. H₂S causes persulfidation of glycerol-3-phosphate dehydrogenase (GPDH)
  4. Persulfidated GPDH shows enhanced activity for NAD+ regeneration
  5. Elevated NAD+ supports muscle vascularization and stem cell health

In middle-aged rats, three weeks of ergothioneine supplementation (20 mg/kg) nearly doubled exercise endurance and running distance while increasing muscle mass and NAD+ levels[5].

“The antioxidant potential of ergothioneine itself is not strong because it doesn’t readily gain or lose electrons,” researchers noted. “Instead, ergothioneine functions as an indirect antioxidant by activating cellular defense pathways.”

This challenges earlier assumptions about how ergothioneine provides its benefits.

CLIA-Certified NAD Test Kit

Test your NAD+ levels from home.

Get the NAD+ Test
Jinfiniti Intracellular NAD Test on purple background

8 Research-Backed Benefits of Ergothioneine

1. Reduces Heart Disease and Mortality Risk

One of the most compelling human studies followed 3,236 participants in Sweden for a median of 21.4 years[6]. The results were striking:

  • 21% lower cardiovascular mortality per 1 standard deviation increase in levels of ergothioneine in the blood
  • 14% lower overall mortality
  • 15% lower coronary disease risk

Ergothioneine emerged as “the metabolite most strongly connected to a healthy food pattern” among all measured compounds in the study. This long-term data suggests that maintaining adequate ergothioneine levels may be one of the most important dietary factors for heart health.

Blood ergothioneine levels above 462 ng/mL (90th percentile) were associated with the lowest disease risk.

2. Protects Cognitive Function as You Age

Multiple studies have linked ergothioneine levels to brain health. A Singapore-based study of 470 elderly subjects attending memory clinics found that low plasma ergothioneine predicted subsequent cognitive and functional decline[7].

Those with higher ergothioneine levels showed:

  • 50% reduced risk of cognitive decline over five years
  • Better memory performance across all age groups
  • Brain activity patterns more similar to younger individuals on cognitive tasks

Professor Barry Halliwell, one of the world’s leading experts on antioxidants at the National University of Singapore, explained the mechanism: “Ergothioneine gets into mitochondria and preserves mitochondrial function in disease. It promotes neurogenesis and enhances the action of neurotrophic factors.”

An ongoing clinical trial (NCT03641404) testing ergothioneine supplementation (25 mg three times weekly) in elderly individuals with mild cognitive impairment shows promising preliminary results:

  • Significant increases in blood ergothioneine levels
  • Improvements in global cognitive performance scores
  • Trending improvements across multiple cognitive assessments
  • Reduction in neurofilament light protein (a marker of neuronal injury)

Recent 2025 research revealed that ergothioneine significantly increases brain-derived neurotrophic factor (BDNF) expression in nerve cells[8]. BDNF plays a key role in learning, memory, and overall brain function.

3. Doubles Exercise Endurance and Muscle Performance

The 2024 research on ergothioneine’s effects on NAD+ revealed remarkable improvements in physical performance[5]. In middle-aged rats, ergothioneine supplementation led to:

  • Nearly 100% increase in exercise exhaustion time
  • Nearly doubled running distance
  • Increased muscle mass and vascularization
  • Elevated muscle stem cell populations

A 2022 study found that ergothioneine supplementation improved aerobic performance in athletes without impairing muscle recovery signaling[9]. The mechanism involves Nrf2 pathway activation, which provides antioxidant benefits without blocking the beneficial stress signals needed for training adaptation.

This makes ergothioneine particularly interesting for anyone concerned about maintaining muscle function and physical performance during aging.

4. Improves Sleep Quality

A 2025 Japanese study found that 20 mg/day ergothioneine for four weeks significantly improved sleep quality in healthy adults[10]. The effective dose was lower than previously tested, suggesting benefits at moderate supplementation levels.

Sleep quality declines with age for many people, affecting everything from cognitive function to metabolic health. If ergothioneine can support better sleep through its effects on cellular energy and stress response, that adds another dimension to its longevity potential.

The mechanisms behind this sleep improvement likely involve ergothioneine’s effects on mitochondrial function, oxidative stress reduction, and cellular energy metabolism.

Infographic showing five health benefits of ergothioneine

5. Activates Your Body’s Master Antioxidant Switch

The antioxidant ergothioneine activates the Nrf2 (nuclear factor erythroid 2-related factor 2) pathway, often called the master regulator of cellular antioxidant defenses[11]. This activation leads to:

  • Increased expression of antioxidant genes including heme oxygenase-1 (HO-1)
  • Enhanced glutathione production and regeneration
  • Protection of cellular components from oxidative damage
  • Activation at concentrations as low as 125-500 nM

Research has found ergothioneine induces Nrf2 activity at physiologically relevant doses. In other words, the amounts you can get from diet or reasonable supplementation are enough to trigger these protective pathways.

The Nrf2 pathway also interacts with sirtuins, a family of NAD+-dependent enzymes that regulate aging. Studies show that ergothioneineupregulates SIRT1 and SIRT6 expression, most notably in endothelial cells exposed to high glucose conditions[12].

6. Slows Telomere Shortening

A 2022 study examined ergothioneine’s effects on telomeres (the protective caps on chromosome ends that shorten with age)[13]. Using cultured human fibroblasts under oxidative stress conditions:

  • Ergothioneine treatment resulted in significantly longer median telomere length after 8 weeks
  • The percentage of short telomeres was significantly reduced across all tested concentrations
  • The rate of telomere shortening was decreased
  • Effects were dose-dependent at physiologically relevant concentrations

Dr. Priscilla Samuel, who led the research, stated: “Our results suggest that ergothioneine as part of a healthy diet could potentially mitigate the negative effects of oxidative stress and support healthy aging by helping to preserve telomere length and reduce the rate of shortening.”

Telomere length is considered one of the key biomarkers of biological age, making this finding pretty significant for longevity research.

7. Protects Skin from Aging and UV Damage

Ergothioneine builds up in skin cells through the OCTN-1 transporter and helps counter several key drivers of skin aging:

  • Sun damage: Absorbs UV light and helps prevent UV-triggered DNA damage[14]
  • Collagen loss: Inhibits MMP-1, the enzyme that breaks down collagen[15]
  • Uneven tone: Clinical data show reduced wrinkles, age spots, and hyperpigmentation by suppressing excess melanin[15]
  • Loss of firmness: Protects collagen and elastin and supports better hydration and elasticity[15]
  • Inflammation: Its anti-inflammatory properties help calm acne, rosacea, psoriasis, and atopic dermatitis, and in some models it outperforms coenzyme Q10 and vitamin C against free radicals[15]

These benefits have been observed with both topical ergothioneine and oral supplementation.

8. Defends Against Frailty

Research on frailty markers revealed that ergothioneine levels decline significantly in frail elderly individuals. A 2020 study of blood metabolites found[16]:

  • Ergothioneine was among 22 key markers distinguishing frailty from non-frailty
  • The compound is “neuroprotective” and its decline correlates with cognitive impairment and reduced mobility
  • Oxidative stress from diminished antioxidant levels is “a key vulnerability for the pathogenesis of frailty”

Animal studies support these findings. Ergothioneine-rich mushroom extract prevented locomotor decline during aging in mice, improving physical performance while reducing inflammation markers in the hippocampus[17].

Frailty represents one of the most significant threats to quality of life in older adults and is closely tied to the hallmarks of aging. Interventions that can preserve physical and cognitive function simultaneously are especially valuable.

🧬 MORE LONGEVITY

How Much Ergothioneine Should You Take?

No official recommended daily allowance exists yet, but research and expert consensus provide useful guidance. Typical dietary intake ranges from 5-20 mg per day depending on mushroom consumption.

To maximize dietary ergothioneine:

  • Eat oyster, porcini, shiitake, or maitake mushrooms several times per week
  • A 100-gram serving (about 3.5 ounces) of oyster mushrooms can provide 20-40 mg
  • Include legumes grown with beneficial soil fungi
  • Consider fermented foods as minor supplementary sources

Combined intake analysis suggests 1.7 mg/kg body weight per day for adults (about 120 mg for a 70 kg person) and 3.7 mg/kg for children from food sources would be well within the safety range.

Supplementation Ranges That Research Supports

Clinical trials have tested 5-30 mg daily with excellent results. The European Food Safety Authority (EFSA) considers up to 30 mg/day for adults safe (20 mg/day for children).

Research-supported ergothioneine supplement dosing protocols:

  • Cognitive support: 25 mg three times weekly (Singapore study)
  • Sleep quality: 20 mg daily
  • General longevity support: 5-25 mg daily
  • Athletic performance: 5-10 mg daily

Supplement manufacturers typically recommend 5-25 mg daily. For specific health goals like cognitive support or anti-aging benefits, higher doses (25 mg) may be beneficial.

A pharmacokinetic study in 45 healthy adults found[18]:

  • Ergothioneine is rapidly absorbed after oral supplementation
  • It’s largely retained by the body with minimal urinary excretion (<4%)
  • Blood levels increased substantially with 5 or 25 mg daily for 7 days
  • After supplementation stopped, whole blood levels continued to increase for 3 weeks and remained elevated at 4 weeks

This indicates efficient cellular uptake and retention. Your body actively accumulates and preserves ergothioneine once you provide it.

Safety and Potential Interactions

Ergothioneine has an excellent safety record with no significant adverse effects reported in clinical studies. The European Food Safety Authority (EFSA) established a no-observed-adverse-effect level (NOAEL) of 800 mg/kg body weight per day based on rat studies.

This provides substantial margins of safety:

  • 470-fold margin for adults
  • 216-fold margin for children

The FDA has granted ergothioneine Generally Recognized as Safe (GRAS) status. No adverse effects were observed in a 7-day human study using 25 mg daily, and high-dose animal studies showed no toxic effects.

Theoretical medication interactions to be aware of:

  • Blood-thinning medications (warfarin, aspirin): May enhance effects by influencing platelet function
  • Immunosuppressive drugs: Could oppose desired effects through immune support
  • Antidiabetic medications: May improve insulin sensitivity, potentially requiring dose adjustment

Beneficial combinations include:

  • Other antioxidants (vitamin C, E, glutathione): May work synergistically
  • Metformin: One study showed ergothioneine combined with metformin effectively reduced kidney damage in diabetic rats
  • NAD+ precursors: May provide complementary benefits through different pathways

The research on ergothioneine and NAD+ suggests these compounds work through distinct but complementary mechanisms. While NAD+ precursors like NMN or NR directly increase NAD+ synthesis, ergothioneine enhances NAD+ regeneration via enzyme persulfidation.

Always consult your healthcare provider before starting new supplements, especially if you take prescription medications or have existing health conditions.

Bottom Line

Ergothioneine represents a diet-derived compound with a dedicated cellular transport system that may be necessary for optimal aging and disease prevention. Strong epidemiological data links blood levels to reduced mortality and disease risk, while compelling mechanistic research explains its cellular actions, including the breakthrough discovery about NAD+ enhancement.

Emerging clinical evidence shows benefits for cognition, physical performance, sleep, and skin health with an excellent safety profile. For individuals interested in optimizing healthspan, increasing ergothioneine intake through mushroom consumption or supplementation (5-25 mg daily) appears to be a safe, evidence-based strategy.

Dr. Jin-Xiong She, founder of Jinfiniti Precision Medicine, notes: “Compounds like ergothioneine that support NAD+ metabolism while activating protective cellular responses may offer more comprehensive benefits than single-pathway interventions.”

Testing your current levels gives you a baseline to work from. The AgingSOS® Advanced Panel measures multiple longevity biomarkers to help you understand where you stand.

Referenced Sources

  1. Ames BN. Prolonging healthy aging: Longevity vitamins and proteins. Proceedings of the National Academy of Sciences; 2018. https://doi.org/10.1073/pnas.1809045115
  2. Carrara JE, Lehotay SJ, Lightfield AR, Sun D, Richie JP, Smith AH, et al. Linking soil health to human health: Arbuscular mycorrhizae play a key role in plant uptake of the antioxidant ergothioneine from soils. Wiley; 2023. https://doi.org/10.1002/ppp3.10365
  3. Gründemann D, Harlfinger S, Golz S, Geerts A, Lazar A, Berkels R, et al. Discovery of the ergothioneine transporter. Proceedings of the National Academy of Sciences; 2005. https://doi.org/10.1073/pnas.0408624102
  4. Sprenger HG, Mittenbühler MJ, Sun Y, Van Vranken JG, Schindler S, Jayaraj A, et al. Ergothioneine controls mitochondrial function and exercise performance via direct activation of MPST. Elsevier BV; 2025. https://doi.org/10.1016/j.cmet.2025.01.024
  5. Petrovic D, Slade L, Paikopoulos Y, D’Andrea D, Savic N, Stancic A, et al. Ergothioneine improves healthspan of aged animals by enhancing cGPDH activity through CSE-dependent persulfidation. Elsevier BV; 2025. https://doi.org/10.1016/j.cmet.2024.12.008
  6. Smith E, Ottosson F, Hellstrand S, Ericson U, Orho-Melander M, Fernandez C, et al. Ergothioneine is associated with reduced mortality and decreased risk of cardiovascular disease. BMJ; 2019. https://doi.org/10.1136/heartjnl-2019-315485
  7. Wu LY, Kan CN, Cheah IK, Chong JR, Xu X, Vrooman H, et al. Low Plasma Ergothioneine Predicts Cognitive and Functional Decline in an Elderly Cohort Attending Memory Clinics. MDPI AG; 2022. https://doi.org/10.3390/antiox11091717
  8. Shi C, Asaba S, Nakamura S, Matsui T. Ergothioneine Stimulates Ca2+-Mediated Brain-Derived Neurotrophic Factor Expression in NE-4C Nerve Cells. American Chemical Society (ACS); 2025. https://doi.org/10.1021/acsomega.4c09920
  9. Fovet T, Guilhot C, Delobel P, Chopard A, Py G, Brioche T. Ergothioneine Improves Aerobic Performance Without Any Negative Effect on Early Muscle Recovery Signaling in Response to Acute Exercise. Frontiers Media SA; 2022. https://doi.org/10.3389/fphys.2022.834597
  10. Okumura H, Araragi Y, Nishioka K, Yamashita R, Suzuki T, Watanabe H, et al. Estimation and Validation of an Effective Ergothioneine Dose for Improved Sleep Quality Using Physiologically Based Pharmacokinetic Model. Wiley; 2025. https://doi.org/10.1002/fsn3.70382
  11. Hseu YC, Vudhya Gowrisankar Y, Chen XZ, Yang YC, Yang HL. The Antiaging Activity of Ergothioneine in UVA-Irradiated Human Dermal Fibroblasts via the Inhibition of the AP-1 Pathway and the Activation of Nrf2-Mediated Antioxidant Genes. Wiley; 2020. https://doi.org/10.1155/2020/2576823
  12. D’Onofrio N, Servillo L, Giovane A, Casale R, Vitiello M, Marfella R, et al. Ergothioneine oxidation in the protection against high-glucose induced endothelial senescence: Involvement of SIRT1 and SIRT6. Elsevier BV; 2016. https://doi.org/10.1016/j.freeradbiomed.2016.04.013
  13. Samuel P, Tsapekos M, de Pedro N, Liu AG, Casey Lippmeier J, Chen S. Ergothioneine Mitigates Telomere Shortening under Oxidative Stress Conditions. Informa UK Limited; 2020. https://doi.org/10.1080/19390211.2020.1854919
  14. Hanayama M, Mori K, Ishimoto T, Kato Y, Kawai J. Effects of an ergothioneine-rich Pleurotus sp. on skin moisturizing functions and facial conditions: a randomized, double-blind, placebo-controlled trial. Frontiers Media SA; 2024. https://doi.org/10.3389/fmed.2024.1396783
  15. Liu HM, Tang W, Wang XY, Jiang JJ, Zhang W, Wang W. Safe and Effective Antioxidant: The Biological Mechanism and Potential Pathways of Ergothioneine in the Skin. MDPI AG; 2023. https://doi.org/10.3390/molecules28041648
  16. Kameda M, Teruya T, Yanagida M, Kondoh H. Frailty markers comprise blood metabolites involved in antioxidation, cognition, and mobility. Proceedings of the National Academy of Sciences; 2020. https://doi.org/10.1073/pnas.1920795117
  17. Roda E, De Luca F, Ratto D, Priori EC, Savino E, Bottone MG, et al. Cognitive Healthy Aging in Mice: Boosting Memory by an Ergothioneine-Rich Hericium erinaceus Primordium Extract. MDPI AG; 2023. https://doi.org/10.3390/biology12020196
  18. Tian X, Thorne JL, Moore JB. Ergothioneine: an underrecognised dietary micronutrient required for healthy ageing? Cambridge University Press (CUP); 2023. https://doi.org/10.1017/s0007114522003592
A nurse preparing an older man for a CRP blood test.

C-Reactive Protein (CRP) Levels: Normal, High and When to Test

C-reactive protein is produced by your body whenever there is inflammation. It’s an acute phase protein, which means it increases quickly in response to a problem and then subsides once the issue is resolved.

By knowing your CRP, you get an idea of sub-clinical inflammation that’s silently undermining your cardiovascular system. The difference between 0.5 mg/L and 3.5 mg/L could be years of healthy life.

What You Should Know

  • CRP below 1.0 mg/L indicates low cardiovascular risk, while levels above 3.0 mg/L signal high risk
  • Your liver produces CRP within 6 to 8 hours of detecting inflammation anywhere in your body
  • Diet changes and weight loss can reduce CRP levels by 30-40% in just weeks
  • Testing CRP alongside cholesterol provides a more complete picture of heart disease risk than cholesterol alone

What is C-Reactive Protein?

C-reactive protein is a ring-shaped molecule your liver manufactures in response to inflammatory signals. When cells detect injury, infection, or chronic stress, they release chemical messengers called cytokines.

Interleukin-6 (IL-6) is the primary trigger for CRP production. Your liver can ramp up CRP synthesis up to 1,000-fold within 48 hours of receiving these distress signals.

CRP binds to damaged cells and certain bacteria, marking them for removal by your immune system. This tagging process activates the complement system, a cascade of proteins that destroys invaders and clears cellular debris.

Why CRP Levels Matter for Your Health

Research over three decades has shown that atherosclerosis (the plaque buildup behind most heart attacks and strokes) is fundamentally an inflammatory disease. CRP doesn’t just reflect this inflammation; it actively participates in the disease process.

High CRP levels correlate with increased risk of heart attacks, strokes, and early death from cardiovascular causes. A 30-year study following nearly 28,000 initially healthy women found that CRP was the strongest predictor of cardiovascular events[1].

Women with the highest CRP levels had a 70% increased risk of major cardiovascular events compared to those with the lowest levels. This surpassed the predictive value of both LDL cholesterol (36% increased risk) and lipoprotein(a) (33% increased risk).

Large-scale meta-analyses confirm that each three-fold higher CRP concentration associates with significantly increased risks for coronary heart disease, ischemic stroke, and vascular mortality[2].

The Inflammation Connection

Dr. Paul Ridker, director of the Center for Cardiovascular Disease Prevention at Brigham and Women’s Hospital, explains the significance: “We’ve known for 30 years that inflammation and hyperlipidemia conspire with each other to really drive atherosclerotic disease. What’s changed is, we now have both a reliable biomarker and therapeutic proof of principle that we can target inflammation per se and lower cardiovascular event rates.”

CRP directly harms blood vessels by reducing nitric oxide availability[3]. This impairs normal vessel dilation and increases arterial stiffness, creating conditions where oxidative stress and plaque instability flourish.

Your body produces CRP through a complex signaling pathway. Fat tissue (adipocytes) releases IL-6, which travels to your liver and activates transcription factors that switch on CRP gene expression.

Comprehensive Health Assessment

Test your hs-CRP with 27 other longevity markers.

Get AgingSOS®
Jinfiniti AgingSOS green gradient background

Normal CRP Ranges (What the Numbers Mean)

The American Heart Association and CDC established standardized risk categories for interpreting CRP results:

  • Low risk: Less than 1.0 mg/L
  • Average risk: 1.0 to 3.0 mg/L
  • High risk: Above 3.0 mg/L

Most healthy adults have CRP concentrations between 0.8 and 3.0 mg/L. Women typically show slightly higher baseline levels than men.

Values above 10 mg/L usually indicate acute infection or illness rather than chronic cardiovascular inflammation. If your test shows CRP above 10 mg/L, your doctor should retest after two weeks to rule out temporary spikes from infections.

The difference between standard CRP and high-sensitivity CRP (hs-CRP) testing matters. Standard CRP measures levels from 8 to 1,000 mg/L for detecting acute infections. High-sensitivity CRP detects much lower concentrations (0.3 to 10 mg/L), making it suitable for cardiovascular risk assessment.

What Causes High CRP Levels?

Your CRP levels reflect the total inflammatory burden your body carries. Multiple factors can push these numbers higher, from extra body weight to chronic infections.

Understanding what drives your CRP up helps you target interventions effectively.

Lifestyle Factors That Raise CRP

Several modifiable lifestyle factors push CRP higher:

  • Excess body weight: People with obesity show 3 to 4 times higher odds of having CRP above 2 mg/L compared to those at healthy weights[4]. Every pound of excess fat tissue produces IL-6, creating a feedback loop where inflammation promotes fat storage and fat storage amplifies inflammation.
  • Smoking: Current smokers have about 2 to 2.5 times higher odds of elevated CRP compared to nonsmokers, with the effect being strongest in people with lower body weight[5].
  • Physical inactivity: Sedentary individuals consistently show higher CRP than those who exercise regularly, even after accounting for body weight differences[6]. Movement matters for keeping inflammation in check.

Health Conditions Linked to Elevated CRP

Various health conditions drive CRP higher:

  • Metabolic dysfunction: High triglycerides, elevated LDL cholesterol, diabetes, and hypertension all associate with increased CRP concentrations[7].
  • Chronic inflammatory conditions: Rheumatoid arthritis, inflammatory bowel disease, and psoriasis naturally elevate CRP as part of the disease process. Autoimmune disorders create persistent immune activation that keeps CRP chronically high[8].
  • Infections: Both acute and chronic infections trigger CRP production as your body fights off pathogens[9]. This is why doctors often order CRP tests to monitor bacterial infections and their response to antibiotics.
  • Cellular aging: Damaged cells that should die accumulate instead, releasing inflammatory chemicals that stimulate CRP production.

When Should You Get a CRP Blood Test?

The 2019 ACC/AHA guidelines recommend considering hs-CRP testing in people at intermediate cardiovascular risk (7.5% to 20% 10-year risk). When hs-CRP measures 2 mg/L or higher, it supports more intensive preventive interventions.

Two measurements taken about two weeks apart provide more reliable results than a single test. Your CRP can fluctuate based on recent infections, injuries, or stress, so averaging two readings captures your true baseline.

Testing makes the most sense when results will actually change your treatment plan. If you’re already taking statins and following heart-healthy habits, knowing your CRP may not alter your approach.

Who Benefits Most from Testing

Certain groups gain the most actionable information from CRP testing:

  • People with intermediate cardiovascular risk: If traditional risk calculators place you in a gray zone where treatment decisions feel uncertain, CRP can tip the scales.
  • Those with metabolic syndrome or prediabetes: CRP predicts progression from prediabetes to full diabetes and helps identify who needs more aggressive lifestyle intervention.
  • Anyone with unexplained symptoms: Chronic fatigue, joint pain, or other signs suggesting hidden inflammation benefit from baseline CRP measurement. This establishes a starting point for tracking whether interventions work.

Dr. Jin-Xiong She, founder of Jinfiniti Precision Medicine, emphasizes the importance of comprehensive testing: “Measuring CRP alongside other biomarkers like NAD+ levels and oxidative stress markers gives us a complete picture of cellular health. When we see elevated CRP, we’re not just treating a number. We’re addressing the root causes of accelerated aging at the cellular level.”

🧬 MORE BIOMARKERS

How to Lower Your CRP Levels

Reducing CRP requires addressing its upstream causes. Multiple approaches work, often more powerfully in combination than alone.

The beauty of CRP as a marker is that you can retest after interventions to see if your efforts are working.

Diet Changes That Work

Mediterranean-style eating patterns show the most consistent anti-inflammatory effects. A randomized trial in people with newly diagnosed type 2 diabetes found CRP fell by 37% after one year on a Mediterranean diet, while remaining unchanged on a low-fat diet[10].

The components that produce the strongest effects include:

  • Daily vegetables: At least 2 servings per day
  • Fresh fruit: 3 pieces daily
  • Fish and seafood: At least 3 times weekly
  • Olive oil: Your primary fat source provides anti-inflammatory polyphenols
  • Whole food fiber: Lowers CRP more effectively than fiber supplements
  • Omega-3 fatty acids: From fish, these reduce inflammatory signaling through multiple pathways

Limiting refined carbohydrates and added sugars helps. These foods spike blood sugar and insulin, which activates inflammatory pathways and increases fat accumulation.

🧬 Learn more about anti-aging foods that fight inflammation.

Exercise and Weight Management

Regular physical activity reduces CRP even without weight loss, though the combination works best. Research shows meaningful results:

  • Fitness improvements of 5 to 15% in VO₂max: Produced nearly 30% CRP reduction in a year-long study of previously sedentary postmenopausal women[11]
  • Exercising more than 195 minutes per week: Achieved significantly greater CRP reductions than exercising less
  • Weight loss through caloric restriction: People who lost more than 2% body fat showed significant CRP decreases, with greater fat loss producing larger reductions

The combination of exercise plus caloric restriction works better than either alone. Studies show this combined approach effectively decreased CRP, IL-6, and TNF-α in overweight adults with active lifestyles[12].

Getting Your CRP Tested

Your doctor can order either standard CRP or high-sensitivity CRP (hs-CRP) through routine blood work. For cardiovascular risk assessment, request hs-CRP specifically since it measures the lower concentrations relevant for heart disease prediction.

Testing details:

  • No preparation needed: Fasting or non-fasting states both work fine for hs-CRP measurement
  • Quick results: Typically return within a few days
  • Context matters: Your doctor will interpret them alongside your other risk factors, not in isolation

Recommended testing frequency depends on your cardiovascular risk profile:

  • Average-risk individuals: Every 3 to 5 years starting at age 20
  • High-risk people: Annual or more frequent monitoring

Comprehensive biomarker panels like AgingSOS measure CRP alongside other aging biomarkers including NAD+ levels, senescence markers, and oxidative stress indicators. This approach identifies multiple targets for intervention rather than focusing on inflammation alone.

Referenced Sources

  1. Ridker PM, Moorthy MV, Cook NR, Rifai N, Lee IM, Buring JE. Inflammation, Cholesterol, Lipoprotein(a), and 30-Year Cardiovascular Outcomes in Women. Massachusetts Medical Society; 2024. https://doi.org/10.1056/nejmoa2405182
  2. C-reactive protein concentration and risk of coronary heart disease, stroke, and mortality: an individual participant meta-analysis. Elsevier BV; 2010. https://doi.org/10.1016/s0140-6736(09)61717-7
  3. Kirkgöz K. C-Reactive Protein in Atherosclerosis—More than a Biomarker, but not Just a Culprit. IMR Press; 2023. https://doi.org/10.31083/j.rcm2410297
  4. Ray KK, Reuter SB, Dalbeler A, Faurby MD, Letnar G, Mathisen J, et al. Factors associated with elevated high-sensitivity C-reactive protein levels in individuals with atherosclerotic cardiovascular disease in the USA and the UK. Oxford University Press (OUP); 2025. https://doi.org/10.1093/eurjpc/zwaf609
  5. O’Loughlin J, Lambert M, Karp I, McGrath J, Gray-Donald K, Barnett T, et al. Association between cigarette smoking and C-reactive protein in a representative, population-based sample of adolescents. Oxford University Press (OUP); 2008. https://doi.org/10.1080/14622200801901997
  6. Esteghamati A, Morteza A, Khalilzadeh O, Anvari M, Noshad S, Zandieh A, et al. Physical Inactivity Is Correlated with Levels of Quantitative C-reactive Protein in Serum, Independent of Obesity: Results of the National Surveillance of Risk Factors of Non-communicable Diseases in Iran. Springer Science and Business Media LLC; 2012. https://doi.org/10.3329/jhpn.v30i1.11278
  7. Miller M, Zhan M, Havas S. High Attributable Risk of Elevated C-Reactive Protein Level to Conventional Coronary Heart Disease Risk Factors. American Medical Association (AMA); 2005. https://doi.org/10.1001/archinte.165.18.2063
  8. Banait T, Wanjari A, Danade V, Banait S, Jain J. Role of High-Sensitivity C-reactive Protein (Hs-CRP) in Non-communicable Diseases: A Review. Springer Science and Business Media LLC; 2022. https://doi.org/10.7759/cureus.30225
  9. Sproston NR, Ashworth JJ. Role of C-Reactive Protein at Sites of Inflammation and Infection. Frontiers Media SA; 2018. https://doi.org/10.3389/fimmu.2018.00754
  10. Maiorino MI, Bellastella G, Petrizzo M, Scappaticcio L, Giugliano D, Esposito K. Anti-inflammatory Effect of Mediterranean Diet in Type 2 Diabetes Is Durable: 8-Year Follow-up of a Controlled Trial. American Diabetes Association; 2016. https://doi.org/10.2337/dc15-2356
  11. Campbell PT, Campbell KL, Wener MH, Wood BL, Potter JD, McTiernan A, et al. A Yearlong Exercise Intervention Decreases CRP among Obese Postmenopausal Women. Ovid Technologies (Wolters Kluwer Health); 2009. https://doi.org/10.1249/mss.0b013e31819c7feb
  12. Liu Y, Hong F, Lebaka VR, Mohammed A, Ji L, Zhang Y, et al. Calorie Restriction With Exercise Intervention Improves Inflammatory Response in Overweight and Obese Adults: A Systematic Review and Meta-Analysis. Frontiers Media SA; 2021. https://doi.org/10.3389/fphys.2021.754731
Closeup of three blood test vials with red and blue caps.

Cytokine Testing: Markers Measured and What They Reveal

When your immune system responds, it doesn’t roar. It whispers using tiny protein messengers called cytokines. Cytokine testing quantifies those messages in your blood, so you can understand how inflamed or balanced your immune system really is.

What You Should Know

  • Cytokine testing measures small immune messenger proteins in your blood.
  • It helps reveal hidden inflammation, infection and immune imbalance.
  • Key markers include interleukins, interferons, TNF alpha and chemokines.
  • Results can guide next steps for healthy aging and disease prevention.

What is Cytokine Testing?

Cytokine testing is a blood test that measures groups of immune signaling proteins at the same time.

A small blood sample is sent to a lab. There, panels of antibodies are used to quantify many cytokines in a single run. Instead of looking at a single marker, the lab creates a profile that reflects how active and inflamed your immune system is.

Doctors and researchers use these profiles to understand infection, autoimmune disease, treatment response and overall inflammatory load, often alongside other inflammatory biomarkers.

What Are Cytokines?

Cytokines are small proteins that immune and tissue cells release to coordinate defense, repair and healing.

You can think of them as text messages between cells. Some call other cells into action, some calm things down and others tell tissues to grow or remodel.

Major cytokine families include:

  • Interleukins such as IL-1, IL-6 and IL-10
  • Interferons that enhance antiviral defenses
  • Tumor necrosis factors such as TNF alpha
  • Chemokines that guide immune cells to where they are needed
  • Growth factors that influence tissue repair

Because they act quickly and in tiny amounts, even small shifts can signal meaningful changes in health, sometimes long before standard labs become abnormal.

Cytokines and Inflammation

Short term inflammation helps you fight infections and heal injuries. Problems start when inflammatory cytokines stay elevated for weeks or months.

Too many pro-inflammatory signals, such as interleukin 6 or tumor necrosis factor alpha, can damage blood vessels, joints and brain cells over time[1]. Anti-inflammatory cytokines like interleukin 10 try to keep that response in check.

A cytokine panel shows how well this balance is working inside your body and complements tests that look at oxidative stress markers.

Comprehensive Health Assessment

Test your cytokines with key longevity markers.

Get AgingSOS®
Jinfiniti AgingSOS green gradient background

When to Consider Cytokine Testing

Most people do not need cytokine testing for routine checkups. It becomes useful when there is a specific concern or complex picture.

Cytokine testing may be considered when:

  • You have unexplained inflammation that does not show clearly on standard labs.
  • You are living with autoimmune disease and symptoms do not match usual tests.
  • You are recovering from severe infection or sepsis and doctors need more detail.
  • You have long lasting fatigue or post viral symptoms.
  • You are building a longevity or precision health plan and want deeper immune insight.

Researchers also use cytokine testing to monitor responses to advanced treatments such as immunotherapy.

The Key Cytokines Measured

A typical cytokine panel measures a mix of pro-inflammatory, anti-inflammatory and regulatory markers.

Common interleukins include IL-1 beta, IL 2, IL-4, IL-6, IL 8, IL-10 and IL-18. Many labs also report tumor necrosis factor alpha, interferon gamma and chemokines such as MCP 1 or MIP 1 alpha.

Some advanced panels include growth factors like hepatocyte growth factor or granulocyte macrophage colony stimulating factor. The exact list varies by laboratory, so it is important to review which markers are included when you order a test or panel.

Pro-Inflammatory Cytokines

Pro-inflammatory cytokines drive the redness, heat, pain and swelling you feel during illness or injury.

Key examples include:

  • IL-1 beta which helps start fever and local inflammation
  • IL-6 which rises quickly in infection and tissue damage
  • TNF-alpha which can increase blood vessel leakiness and shock in severe infection
  • IL-17 which promotes certain autoimmune and joint responses

In healthy people, these markers sit at very low levels. During serious infection, they can rise many fold and help predict severity.

Persistently high levels at rest suggest chronic inflammation that may contribute to joint pain, cardiovascular risk, insulin resistance or brain fog.

Anti-Inflammatory Cytokines

Anti-inflammatory cytokines act like the brakes on the immune system.

Important examples are:

  • IL-10 which calms down immune cells once a threat is controlled
  • Transforming growth factor beta which limits tissue damage and supports repair

Low levels in the setting of high pro-inflammatory cytokines may point to poor immune regulation. In contrast, very high anti-inflammatory signals can appear later in severe infections when the immune system becomes exhausted.

Reading both sides of this equation is key when deciding whether the body needs support or simply more time to recover.

Immune Signaling Cytokines

Other cytokines coordinate whereimmune cells go and how they behave.

Examples include:

  • Chemokinessuchas MCP-1 and MIP-1 alpha that act as homing signals for white blood cells
  • Interferon gammawhich boosts antiviral defenses and shapes T-cell responses
  • Colony stimulating factorssuch as GM-CSF that tell the bone marrow to produce more immune cells

Abnormal patterns in these markers may help explain why some people develop lingering symptoms after infections or respond differently to vaccines and immunotherapies.

🧬 MORE BIOMARKERS

Interpreting Cytokine Test Results

There is no single perfect cytokine number. Your health professional will look at patterns across the panel and compare them with your symptoms, history and other tests.

For example:

  • A cluster of high IL-6, IL 8 and TNF alpha may suggest an active inflammatory process.
  • Mildly elevated IL-6 with normal anti-inflammatory cytokines could reflect a recent workout or minor stress.
  • In severe situations, such as sepsis or cytokine storm, levels can be markedly higher and are interpreted alongside vital signs and organ function tests.

Over time, repeat testing with the same lab method can show whether inflammation is rising, stable or improving.

Why “Normal” Levels Vary

Cytokine reference ranges are guides, not rigid pass or fail cutoffs.

Levels differ between people because of:

  • Age, sex and genetics
  • Body weight and metabolic health
  • Recent infections, vaccines or intense exercise
  • Time of day the sample is taken
  • How quickly and carefully the blood is processed

Healthy adults can have IL-6 levels below about 5 picograms per milliliter, while critically ill patients may show values in the hundreds[2][3].

Different labs also use different methods and panels, so a result from one laboratory cannot always be compared directly with another. Trends over time within the same testing system often matter more than a single number.

Cytokines, Aging and Chronic Disease

Over time, small but steady increases in inflammatory cytokines can feed a state sometimes called inflammaging. In this state, the immune system is slightly activated even without infection[4].

Higher baseline levels of IL-6 and TNF alpha have been linked with frailty, cardiovascular disease and cognitive decline in multiple studies. Dysregulated cytokine patterns also appear in conditions such as diabetes, autoimmune disease and chronic fatigue.

Dr. Jose Montoya, who led major cytokine research at Stanford, stated regarding chronic fatigue syndrome: “Chronic fatigue syndrome is by no means a figment of the imagination. This is real.”

Today, careful cytokine profiling is often paired with markers of cellular senescence and aging to give a fuller picture of biological age and resilience.

Should You Test Your Cytokine Levels?

Cytokine testing is most helpful when there is a clear question to answer.

It may be worth discussing with your clinician if:

  • You are recovering from severe infection and progress is slower than expected.
  • You live with autoimmune or inflammatory disease and symptoms are hard to control.
  • You have long lasting, unexplained fatigue or brain fog.
  • You are building a prevention focused longevity plan and want deeper immune data.

Dr Jin Xiong She, founder of Jinfiniti Precision Medicine, explains it this way: “When we measure cytokines together with other biomarkers, we often see early warning signs years before symptoms become obvious.”

For many people, combining cytokine testing with broader biomarker assays such as our AgingSOS Advanced Panel gives a clearer picture of cellular health and supports targeted action instead of guesswork.

Referenced Sources

  1. Chen L, Deng H, Cui H, Fang J, Zuo Z, Deng J, et al. Inflammatory responses and inflammation-associated diseases in organs. Impact Journals, LLC; 2017.
  2. Ma L, Zhang H, Yin Y ling, Guo W zhi, Ma Y qun, Wang Y bo, et al. Role of interleukin-6 to differentiate sepsis from non-infectious systemic inflammatory response syndrome. Elsevier BV; 2016.
  3. Gamarra-Morales Y, Molina-López J, Santiago-Ruiz FC, Herrera-Quintana L, Vázquez-Lorente H, Gascón-Luna F, et al. Efficiency of IL-6 in Early Prognosis and Follow-Up in Critically Ill Patients with Septic Shock. MDPI AG; 2024.
  4. Ferrucci L, Fabbri E. Inflammageing: chronic inflammation in ageing, cardiovascular disease, and frailty. Springer Science and Business Media LLC; 2018.
Multiple blood test vials against a yellow background.

What is 8-OHdG? Understanding DNA Oxidative Stress

Free radicals damage your DNA constantly during normal metabolism. Your cells work to fix this damage around the clock.

A biomarker called 8-OHdG can tell you how effectively your body manages this repair work.

The biomarker of oxidative stress 8-OHdG has been studied in relation to cancer, heart disease, diabetes and aging. It’s also used by doctors to help assess oxidative stress and disease risk.

What You Should Know

  • 8-OHdG measures oxidized DNA damage from free radicals throughout your body
  • Higher levels connect to increased risk of cancer, cardiovascular disease, and neurodegeneration
  • Urine or blood tests reveal your 8-OHdG status with results typically ranging from 0-5.2 ng/mg creatinine for optimal health
  • Antioxidants, better diet, regular exercise, and stress reduction can lower elevated levels

What is 8-OHdG (8-Hydroxy-2-deoxyguanosine)?

When free radicals damage guanine (a DNA building block), they create a modified molecule called 8-hydroxy-2′-deoxyguanosine (8-OHdG). Your body generates these free radicals naturally through metabolism, and they multiply when you face stress or toxin exposure[1].

Guanine takes more hits from oxidation than the other three DNA bases. Free radicals target a specific location on guanine and transform it into 8-OHdG.

Your cellular repair machinery identifies this DNA damage and “cuts” it away. The removed 8-OHdG circulates through your blood and gets filtered into your urine in its original form.

Testing urine samples for levels of 8-OHdG paints a picture of how much oxidative damage to DNA you may be experiencing[2]. The concentration reflects both the rate of DNA damage and how hard your cells work to fix it.

Comprehensive Health Assessment

Test 8-OHdG with 27 other longevity markers.

Get AgingSOS®
Jinfiniti AgingSOS green gradient background

Why 8-OHdG Testing Matters

Elevated 8-OHdG levels have been linked to a number of significant health issues. The biomarker acts as an early warning system, before symptoms manifest.

As one review noted: “The biomarker 8-OHdG has been used widely in many studies not only as a measurement of endogenous oxidative DNA damage but also as a risk factor for many diseases including cancer.”[1]

Cancer Risk Assessment

People with urinary 8-OHdG concentrations above 1.5 nmol/mmol creatinine face 3.68 times higher colorectal cancer risk compared to those with lower levels. Cancer tissue consistently shows elevated 8-OHdG compared to healthy adjacent tissue[3].

The damage becomes dangerous when 8-OHdG escapes repair before cell division. It can mispair with the wrong DNA base during replication, causing mutations that drive cancer development.

Breast cancer and prostate cancer patients both show significantly higher 8-OHdG than healthy controls[4]. The marker increases with cancer progression and metastasis.

Heart and Brain Health

A systematic review of 18 studies found elevated 8-OHdG consistently associated with atherosclerosis, heart failure, and stroke[5]. Blood and urine levels correlate with heart disease severity.

In Parkinson’s disease, cerebrospinal fluid 8-OHdG rises significantly[6]. The biomarker may help with early diagnosis of neurodegenerative conditions before major symptoms develop.

Elderly people with elevated plasma 8-OHdG face increased risk of motoric cognitive risk syndrome. This suggests value as an early detection tool for cognitive and motor decline.

Diabetes and Aging

Type 2 diabetics show significantly increased oxidative DNA damage[7]. Levels climb higher in patients with advanced complications like proliferative retinopathy and nephropathy.

The marker rises even in prediabetes, making it potentially more sensitive than traditional indicators. Studies suggest 8-OHdG helps monitor disease progression and complication risk.

Dr. Jin-Xiong She, founder of Jinfiniti Precision Medicine, explains: “8-OHdG levels can tell us how well someone is aging at the cellular level. Your DNA repair systems slow down as you get older, and 8-OHdG shows the mounting damage that eventually leads to age-related diseases.”

🧬 MORE BIOMARKERS

  • Kidney function markers tell their own story. Understanding cystatin C levels reveals filtration capacity beyond standard tests.
  • Protein status affects cellular repair. Learn what albumin blood test results mean for overall health.
  • Muscle and heart health show up in the numbers. Discover why creatine kinase levels matter for tissue damage assessment.

Understanding Your 8-OHdG Results

Test results vary based on measurement method and units used. Knowing what’s normal helps you interpret your numbers.

Research on healthy populations established typical reference ranges[2]:

  • Women: 43.9 ± 42.1 ng/mg creatinine (urinary)
  • Men: 29.6 ± 24.5 ng/mg creatinine (urinary)
  • Optimal range: 0-5.2 ng/mg creatinine

Healthy people show an eleven-fold variation in levels. Your values also fluctuate throughout the day, ranging from 3.76 ng/mg in early morning to 6.46 ng/mg in early afternoon for men.

The type of test matters for interpretation:

  • Plasma 8-OHdG: Instantaneous balance between damage and repair
  • Urinary 8-OHdG: Total body damage over time

Results above optimal ranges warrant identifying oxidative stress sources. This includes evaluating antioxidant status and inflammatory markers.

What Raises 8-OHdG Levels?

Multiple factors influence your oxidative DNA damage. Some you can control, others require awareness and protection.

Certain lifestyle habits drive DNA damage higher:

  • Smoking: Smokers show significantly higher levels[8]
  • Long working hours: Work-related stress predicts increased 8-OHdG independent of other factors[9]
  • Stress hormones: The biomarker correlates with evening cortisol and inflammation markers[10]

Your surroundings contribute to oxidative stress:

  • Radiation workers and interventional physicians show elevated levels[11]
  • Air pollution in high-traffic areas increases oxidative damage
  • Industrial chemical exposure drives up DNA damage markers

Physical activity affects 8-OHdG differently based on intensity:

  • Resistance training temporarily increases circulating 8-OHdG in all people[12]
  • Long-duration aerobic exercise decreases levels in untrained individuals
  • Regular moderate activity provides the best protection[13]

What you eat plays a protective role:

  • Low meat intake paradoxically increases 8-OHdG[13]
  • Soybeans, rice, and light-colored vegetables correlate with lower levels
  • Vitamin intake significantly decreases damage

Managing chronic stress is one of the most important things you can do for DNA protection.

How to Reduce High 8-OHdG

When testing reveals elevated oxidative DNA damage, several evidence-based approaches can help restore healthy levels.

Research demonstrates measurable benefits from specific antioxidants:

  • Vitamin E (200 IU daily): 33.8% reduction in smokers[14]
  • Vitamin C (500 mg): Significant decrease in oxidative markers
  • Red ginseng (1.8 g daily): 31.7% reduction in 8-OHdG
  • Coenzyme Q10: Mean reduction of 2.9 ± 2.9 pg/ml[15]
  • High-dose folic acid (0.8 mg): Dose-response protective effects

Simple dietary adjustments make a real difference:

  • Increase fruit and vegetable intake consistently
  • Orange juice helped metabolic syndrome patients lower levels and lose weight[16]
  • Fish oil (EPA/DHA) helps smokers with high 8-OHdG[17]

Basic lifestyle changes provide strong protection:

  • Regular moderate exercise: Studies show significant 8-OH-dG reduction
  • Smoking cessation: Damage reverses over time after quitting
  • Stress management: Lower cortisol to protect DNA

Supporting your body’s master antioxidant glutathionethroughdiet or N-acetyl cysteine may help address core antioxidant defenses. This becomes particularly helpful when multiple oxidative stress markers are elevated.

Bottom Line

8-OHdG measures oxidative damage to your DNA and predicts disease risk years before symptoms appear. Testing reveals your cellular stress burden and guides targeted interventions to protect your genetic material and extend your healthspan.

Jinfiniti’s AgingSOS panel includes 8-OHdG alongside 27 other longevity biomarkers, giving you a complete picture of cellular aging. Get tested, identify your risks early, and take action based on real data.

Referenced Sources

  1. VALAVANIDIS A, VLACHOGIANNI T, FIOTAKIS C. 8-hydroxy-2′ -deoxyguanosine (8-OHdG): A Critical Biomarker of Oxidative Stress and Carcinogenesis. Informa UK Limited; 2009. https://doi.org/10.1080/10590500902885684
  2. Wu LL, Chiou CC, Chang PY, Wu JT. Urinary 8-OHdG: a marker of oxidative stress to DNA and a risk factor for cancer, atherosclerosis and diabetics. Elsevier BV; 2004. https://doi.org/10.1016/j.cccn.2003.09.010
  3. Guo C, Li X, Wang R, Yu J, Ye M, Mao L, et al. Association between Oxidative DNA Damage and Risk of Colorectal Cancer: Sensitive Determination of Urinary 8-Hydroxy-2′-deoxyguanosine by UPLC-MS/MS Analysis. Springer Science and Business Media LLC; 2016. https://doi.org/10.1038/srep32581
  4. Kuo HW, Chou SY, Hu TW, Wu FY, Chen DJ. Urinary 8-hydroxy-2′-deoxyguanosine (8-OHdG) and genetic polymorphisms in breast cancer patients. Elsevier BV; 2007. https://doi.org/10.1016/j.mrgentox.2007.04.009
  5. Kroese LJ, Scheffer PG. 8-Hydroxy-2′-Deoxyguanosine and Cardiovascular Disease: a Systematic Review. Springer Science and Business Media LLC; 2014. https://doi.org/10.1007/s11883-014-0452-y
  6. Dai Q, Ma Y, Liu C, Zhao R, Chen Q, Chen W, et al. Association of 8-hydroxy-2′-deoxyguanosine with motoric cognitive risk in elderly Chinese people: RUGAO longevity and aging cross-sectional study. Springer Science and Business Media LLC; 2024. https://doi.org/10.1186/s12877-024-04943-0
  7. Shin CS, Moon BS, Park KS, Kim SY, Park SJ, Chung MH, et al. Serum 8-Hydroxy-Guanine Levels Are Increased in Diabetic Patients. American Diabetes Association; 2001. https://doi.org/10.2337/diacare.24.4.733
  8. Ajileye AB, Akinbo FO. Oxidative DNA damage estimated by urinary 8-Hydroxy-2′ –Deoxyguanosine (8-OHdG) and 8-Oxoguanine DNA Glycosylase (OGG1) in cigarette and non-cigarette smokers in South West Nigeria. SAGE Publications; 2023. https://doi.org/10.3233/jcb-230120
  9. Watanabe S, Li YS, Kawasaki Y, Ootsuyama Y, Kawai K. Health examination results and work environment factors affecting urinary 8-hydroxy-2′-deoxyguanosine levels. Oxford University Press (OUP); 2021. https://doi.org/10.1002/1348-9585.12210
  10. Irie M, Tamae K, Iwamoto‐Tanaka N, Kasai H. Occupational and lifestyle factors and urinary 8‐hydroxydeoxyguanosine. Wiley; 2005. https://doi.org/10.1111/j.1349-7006.2005.00083.x
  11. AbuArrah M. 8-Hydroxy-2-Deoxyguanosine as Oxidative DNA Damage Biomarker of Medical Ionizing Radiation: A Scoping Review. Salvia Medical Sciences Ltd; 2021. https://doi.org/10.31661/jbpe.v0i0.2101-1258
  12. Ye M, Dewi L, Liao YC, Nicholls A, Huang CY, Kuo CH. DNA oxidation after exercise: a systematic review and meta-analysis. Frontiers Media SA; 2023. https://doi.org/10.3389/fphys.2023.1275867
  13. Kasai H, Iwamoto‐Tanaka N, Miyamoto T, Kawanami K, Kawanami S, Kido R, et al. Life Style and Urinary 8‐Hydroxydeoxyguanosine, a Marker of Oxidative DNA Damage: Effects of Exercise, Working Conditions, Meat Intake, Body Mass Index, and Smoking. Wiley; 2001. https://doi.org/10.1111/j.1349-7006.2001.tb01041.x
  14. Lee BM, Lee SK, Kim HS. Inhibition of oxidative DNA damage, 8-OHdG, and carbonyl contents in smokers treated with antioxidants (vitamin E, vitamin C, β-carotene and red ginseng). Elsevier BV; 1998. https://doi.org/10.1016/s0304-3835(98)00227-4
  15. Biglan KM, Dorsey ER, Evans RVV, Ross CA, Hersch S, et al. Plasma 8-hydroxy-2′-deoxyguanosine Levels in Huntington Disease and Healthy Controls Treated with Coenzyme Q10. SAGE Publications; 2012. https://doi.org/10.3233/jhd-2012-120007
  16. Rangel-Huerta OD, Aguilera CM, Martin MV, Soto MJ, Rico MC, Vallejo F, et al. Normal or High Polyphenol Concentration in Orange Juice Affects Antioxidant Activity, Blood Pressure, and Body Weight in Obese or Overweight Adults. Elsevier BV; 2015. https://doi.org/10.3945/jn.115.213660
  17. Ghorbanihaghjo A, Safa J, Alizadeh S, Argani H, Rashtchizadeh N, Taghinia MV, et al. Protective Effect of Fish Oil Supplementation on DNA Damage Induced by Cigarette Smoking. Springer Science and Business Media LLC; 2013. https://doi.org/10.3329/jhpn.v31i3.16826
Medical professional in protective gloves handles labeled blood test vials in sterile laboratory.

Cystatin C Test: Normal Range, High Levels and Why It Matters

Roughly 37 million American adults have chronic kidney disease. The troubling part? Around 90% don’t know it.

Traditional kidney function tests miss early signs of decline. Standard creatinine testing can fail to detect problems until you’ve lost half your kidney function. A better marker exists that catches kidney disease years earlier: the cystatin C test.

What You Should Know

  • Cystatin C detects kidney problems earlier and more accurately than standard creatinine tests
  • Normal levels range from 0.6-1.2 mg/L, with elevated levels signaling reduced kidney function
  • Unlike creatinine, cystatin C isn’t affected by muscle mass, diet, age, or gender
  • Research shows cystatin C identifies 41% more people with chronic kidney disease than creatinine alone

What is Cystatin C?

Cystatin C is a small protein that your body produces at a constant rate. Every cell with a nucleus in your body makes it continuously.

The kidneys clear cystatin C from your bloodstream. If your kidney function worsens, cystatin C builds up in your blood. That’s why it’s the ideal marker for estimated glomerular filtration rate (eGFR), the gold standard for kidney health[1].

The beauty of cystatin C? The rate it’s produced in your body doesn’t change based on what you eat, how much muscle mass you have, or whether you’re 25 or 75. That stability makes it far more reliable than traditional markers of kidney function.

Normal Range and What High Levels Mean

A nurse handling blood test vials in a lab environment.

Normal Cystatin C Levels

Reference ranges shift slightly with age:

  • Adults 18-49 years: 0.63-1.03 mg/L
  • Adults 50+ years: 0.67-1.21 mg/L
  • General adult range: 0.6-1.2 mg/L

These ranges represent healthy kidney filtration. Staying within them suggests your kidneys are clearing waste efficiently.

What High Levels Indicate

Elevated cystatin C (above 1.2-1.3 mg/L) primarily signals impaired kidney function. But high levels can also point to:

  • Diabetes complications
  • Chronic inflammation
  • Cardiovascular disease risk
  • Thyroid problems (hyperthyroidism)
  • Obesity

One study found that 76% of patients with kidney dysfunction showed elevated cystatin C, compared to only 20% with elevated creatinine[2]. The test caught problems standard testing missed entirely.

Understanding inflammatory biomarkers alongside cystatin C gives you a fuller picture of your health status.

Comprehensive Health Assessment

Test cystatin C with 27 other longevity markers.

Get AgingSOS®
Jinfiniti AgingSOS green gradient background

Why Cystatin C Beats Creatinine for Kidney Testing

Creatinine comes from muscle breakdown. That creates significant problems for accuracy.

Your creatinine levels fluctuate based on muscle mass. Bodybuilders show falsely high readings. Elderly people with muscle loss show falsely normal readings even with declining kidney function.

Diet affects creatinine too. High protein intake artificially elevates levels. Certain medications interfere with the test. Gender and age require constant adjustments to reference ranges.

Most troubling? Creatinine may not rise until 50% of kidney function is lost. That’s a decade of missed opportunities for intervention.

Cystatin C’s Advantages for Kidney Health

One study looked at people who were very physically active. One group had significantly higher muscle mass than the other group. The serum cystatin C level was exactly the same in both groups[3].

Dr. Michael Shlipak at the San Francisco VA Health Care System states it plainly: “Cystatin C is clearly superior to creatinine because it overcomes the major weakness of creatinine’s inaccuracy in people with reduced muscle or limited activity.”

Cystatin C rises earlier when kidneys start failing. In young children who had cardiac surgery, plasma cystatin C peaked at 8 hours compared to creatinine peaking at 48 hours[4]. Earlier detection means earlier treatment.

The combined creatinine-cystatin C equation achieves 84-94% accuracy compared to gold-standard GFR measurements. Creatinine alone? 80-84% at best[5].

Learning about these different types of biomarkers can help you understand why some tests work better than others for specific health conditions.

Research-Backed Evidence

The New England Journal of Medicine featured a study with over 90,000 participants.

13.7% had chronic kidney disease by cystatin C testing versus only 9.7% by testingcreatinine alone[6]. That’s a 41% increase in disease detection.

When cystatin C reclassified people to lower kidney function categories, they faced significantly higher mortality risk. Hazard ratios jumped to 1.55-1.76 for death.

The Heart and Soul Study tracking 990 people with coronary heart disease found those in the highest cystatin C quartile experienced[7]:

  • 3.6-fold increased risk of death
  • 2.0-fold increased cardiovascular event risk
  • 2.6-fold increased heart failure risk

A meta-analysis of over 22,000 participants across 14 studies found even broader patterns[8]. Those with the highest cystatin C levels faced 162% increased cardiovascular disease risk and 122% increased all-cause mortality.

These risks existed independent of standard creatinine measures. Traditional testing was missing critical warning signs.

Dr. Jennifer Lees at the University of Glasgow reviewed the evidence comprehensively: “Cystatin C improves sensitivity and specificity of chronic kidney disease diagnosis, improves detection of harmful acute and chronic changes in kidney function, improves precision of treatment eligibility and safety.”[9]

The 2024 KDIGO guideline now recommend using both creatinine and cystatin C together for the most accurate kidney function assessment.

“At Jinfiniti, we’ve seen how measuring advanced biomarkers like cystatin C transforms patient care,” notes Dr. Jin-Xiong She. “Catching kidney decline early gives people years to modify risk factors before irreversible damage occurs. That’s the power of precision testing.”

Your kidneys affect everything from blood pressure to NAD+ levels and diabetes risk. Keeping tabs on kidney health protects your entire system.

🧬 MORE READING

  • Blood work can reveal protein deficiencies early. Understanding your albumin blood test results helps catch liver and kidney issues before symptoms appear.
  • Muscle soreness or something more serious? Learn what creatine kinase levels tell you about muscle damage and heart health.
  • Inflammation drives kidney damage. Discover which oxidative stress markers reveal hidden cellular damage.

Who Should Get a Cystatin C Test?

The test proves most valuable in specific situations:

  • Borderline kidney function: If your creatinine-based GFR sits at 45-59 mL/min/1.73m² without protein in your urine, cystatin C confirms whether you truly have kidney disease.
  • Unusual body composition: Malnutrition, obesity, amputation, high muscle mass from athletics, or muscle wasting conditions all throw off creatinine. Cystatin C stays accurate.
  • Medication decisions: When drugs you need are hard on kidneys or require precise dosing, cystatin C gives you the accurate GFR needed for safety.
  • Rapidly changing situations: Hospitalized patients, acute kidney injury, or conditions where kidney function fluctuates quickly benefit from cystatin C’s sensitivity.
  • Older adults: Muscle mass naturally declines with age. Creatinine becomes increasingly unreliable after 60, while cystatin C maintains accuracy.

A comprehensive longevity bioarker testing panel should include cystatin C alongside other markers to catch problems before symptoms appear.

Understanding Your Test Results

Your cystatin C level translates directly to estimated GFR. Higher cystatin C means lower GFR and reduced kidney function.

Results get combined with creatinine for the most accurate picture. When both tests agree, confidence in the diagnosis increases. When they disagree, cystatin C usually reveals the truth.

Some conditions raise cystatin C without affecting kidneys. Hyperthyroidism, corticosteroid use, and high inflammation can elevate levels. Your doctor accounts for these when interpreting results.

The test costs more than basic creatinine (around $17-18 versus under $2), but the improved accuracy prevents costly complications down the road. Finding kidney disease a decade earlier can save your life.

Regular testing matters most. One measurement establishes your baseline. Follow-up tests every 6-12 months track whether your kidney function stays stable, improves, or declines.

Research shows that approximately 11% of outpatients and 35% of hospitalized patients show large discordances between cystatin C and creatinine-based measurements[10].

When the two tests disagree significantly, the people whose cystatin C indicates worse function face elevated mortality risk that creatinine testing completely misses.

Dr. Shlipak raises a critical question: “The obvious mystery is why after 15 years we’re still not using it very much. I can’t explain why the medical field is content to continue using creatinine when we have a better alternative.”

Don’t wait for standard testing to miss the warning signs. Ask your doctor for a comprehensive assessment like our AgingSOS at-home panel that includes cystatin C.

Referenced Sources

  1. Benoit SW, Ciccia EA, Devarajan P. Cystatin C as a biomarker of chronic kidney disease: latest developments. Informa UK Limited; 2020. https://doi.org/10.1080/14737159.2020.1768849
  2. Villa P, Jiménez M, Soriano MC, Manzanares J, Casasnovas P. Serum cystatin C concentration as a marker of acute renal dysfunction in critically ill patients. Springer Science and Business Media LLC; 2005. https://doi.org/10.1186/cc3044
  3. Baxmann ACAA, Ahmed MS, Marques NAAC, Menon VB, Pereira AB, Kirsztajn GM, et al. Influence of Muscle Mass and Physical Activity on Serum and Urinary Creatinine and Serum Cystatin C. Ovid Technologies (Wolters Kluwer Health); 2008. https://doi.org/10.2215/cjn.02870707
  4. Makinde RA, Alaje AK, Ajose AO, Adedeji TA, Onakpoya UU. Cardiac Surgery-Associated Acute Kidney Injury (CSA-AKI) in Children with Congenital Heart Diseases in Southwest Nigeria. Ovid Technologies (Wolters Kluwer Health); 2025. https://doi.org/10.4103/aca.aca_104_24
  5. Russel WA, Fu EL, Bosi A, Caldinelli A, Inker LA, Chang AR, et al. Obesity, Underweight, and Accuracy of eGFR Using Cystatin C and Creatinine in a Northern European Population. Ovid Technologies (Wolters Kluwer Health); 2025. https://doi.org/10.1681/asn.0000000760
  6. Shlipak MG, Matsushita K, Ärnlöv J, Inker LA, Katz R, Polkinghorne KR, et al. Cystatin C versus Creatinine in Determining Risk Based on Kidney Function. Massachusetts Medical Society; 2013. https://doi.org/10.1056/nejmoa1214234
  7. Ix JH, Shlipak MG, Chertow GM, Whooley MA. Association of Cystatin C With Mortality, Cardiovascular Events, and Incident Heart Failure Among Persons With Coronary Heart Disease. Ovid Technologies (Wolters Kluwer Health); 2007. https://doi.org/10.1161/circulationaha.106.644286
  8. Lee M, Saver JL, Huang WH, Chow J, Chang KH, Ovbiagele B. Impact of Elevated Cystatin C Level on Cardiovascular Disease Risk in Predominantly High Cardiovascular Risk Populations. Ovid Technologies (Wolters Kluwer Health); 2010. https://doi.org/10.1161/circoutcomes.110.957696
  9. Lees JS, Fabian J, Shlipak MG. Cystatin C should be routinely available for estimating kidney function. Ovid Technologies (Wolters Kluwer Health); 2024. https://doi.org/10.1097/mnh.0000000000000980
  10. Estrella MM, Ballew SH, Sang Y, Grams ME, Coresh J, Surapaneni A, et al. Discordance in Creatinine- and Cystatin C–Based eGFR and Clinical Outcomes. American Medical Association (AMA); 2025. https://doi.org/10.1001/jama.2025.17578
Three blood test vials against a purple background.

What is an Albumin Blood Test? Understanding Normal Ranges and Results

Your doctor has ordered an albumin test but what does it really tell you about your health? Albumin is a biomarker for the functioning of your liver, kidney, and overall nutrition. In many ways, it’s like a triple action report card.

The reason an albumin test is so valuable is that it can identify a problem that is developing before you experience symptoms. A faulty liver, under-performing kidney, chronic inflammation and poor nutrition can all impact albumin levels and most often become visible through a blood test months or years before you become aware of a problem.

That’s why comprehensive testing panels like AgingSOS include albumin alongside 27 other biomarkers to paint a complete picture of your cellular vitality and biological age.

What You Should Know

  • Normal albumin ranges from 3.5 to 5.4 g/dL in healthy adults
  • Low levels typically signal liver disease, kidney problems, or malnutrition
  • High albumin almost always means dehydration, not overproduction
  • Testing requires a simple blood draw with results available in days

What is Albumin?

Albumin is the most abundant protein in your blood. In healthy individuals, albumin makes up about 50% of the total protein content of plasma. Your liver makes about 10 to 15 grams of albumin every day.

Albumin acts as a carrier protein, transporting many different substances throughout your body, including hormones, vitamins, minerals, and medications.

Albumin also prevents fluid from leaking out of blood vessels. It is responsible for 70 to 80% of what is called “oncotic pressure”, the force that opposes the leaking of fluid out of blood vessels and into other parts of the body. If albumin levels are too low, fluid leaks out and causes edema (swelling).

In addition to its transport and fluid regulating roles, albumin plays a role in modulating inflammation and oxidative stress. Albumin neutralizes free radicals and helps to regulate antioxidant levels in cells.

Normal Albumin Blood Test Ranges

Healthy adults maintain albumin levels between 3.5 and 5.4 grams per deciliter (g/dL). Your age and life stage affect what’s considered normal for you.

Normal albumin levels by age:

  • Newborns: 2.8 to 4.4 g/dL (immature liver function)
  • Children and teens: 3.8 to 5.4 g/dL (higher during growth)
  • Adults: 3.5 to 5.4 g/dL (standard range)
  • Adults over 65: 3.4 to 4.8 g/dL (normal aging decline)
  • Pregnant women: 3.0 to 4.2 g/dL (blood volume increases)

How Ranges Vary by Age

The liver’s ability to produce albumin also varies by age. In one study, the synthesis rate decreased 60 to 80% in people with end-stage liver disease as compared to normal function[1].

In healthy people, there is a normal decrease with age in the liver’s ability to metabolize protein. Adults with test results showing levels above 3.4 g/dL after 65 generally show good liver function and adequate nutrition.

Testing during pregnancy tends to show physiological changes rather than disease. Your body increases blood volume by up to 50%, which naturally dilutes the concentration of albumin.

Infographic showing normal ranges for an albumin blood test.

What Low Albumin Levels Tell Your Doctor

Low albumin (also known as hypoalbuminemia) is defined as less than 3.4-3.5 g/dL. This laboratory finding is one of the strongest indicators of a severe underlying medical condition.

Albumin levels only decrease when the liver is unable to synthesize enough, the kidneys excrete too much or the body’s processes are breaking it down too quickly. Levels that dip below 3.0 g/dL are indicative of late-stage disease and need urgent medical intervention.

Main Causes of Low Albumin

Common causes include:

  • Liver disease: Cirrhosis, hepatitis, and liver failure impair synthesis since your liver is albumin’s only production site. Low albumin signals advanced disease in prognostic scoring systems like Child-Pugh and MELD.
  • Kidney disorders: Nephrotic syndrome causes massive albumin loss into urine. Patients lose more than 3 grams of protein daily, with serum albumin often dropping below 2.5 g/dL.
  • Malnutrition: Inadequate protein intake prevents albumin production. A systematic review found subjects at high malnutrition risk had significantly lower albumin concentrations[2].
  • Inflammation and infection: Cytokines like IL-1, IL-6, and TNF-α suppress liver albumin production while blood vessels become leaky, allowing albumin to escape. Understanding inflammatory biomarkers helps identify these conditions early.

Signs Your Levels Might Be Low

Swelling is the classic symptom associated with low albumin. Look for these signs:

  • Edema: Fluid retention in legs, feet, ankles, or face
  • Ascites: Fluid buildup in your abdomen causing swollen belly
  • Breathing difficulty: Pleural effusions in which fluid surrounds the lungs
  • Fatigue and weakness: Poor nutrient transport throughout body (similar to chronic fatigue from other causes)
  • Loss of appetite and nausea: Often seen with protein deficiency
  • Dry, rough skin and thinning hair: Not enough protein to support tissue maintenance

Comprehensive Health Assessment

Test albumin with 27 other longevity markers.

Get AgingSOS®
Jinfiniti AgingSOS green gradient background

What High Albumin Levels Really Mean

High albumin or hyperalbuminemia refers to albumin levels above 5.0 to 5.4 g/dL. This result is rare and is almost never due to overproduction. Dehydration concentrates the blood and makes the albumin appear high, while the total protein is normal.

Why Levels Rise

High albumin is most often due to:

  • Dehydration: Fluid loss through vomiting, diarrhea, excessive sweating, or inadequate intake concentrates blood components. This causes virtually all cases of hyperalbuminemia.
  • Very high protein diets: Consuming too much protein will temporarily raise the level of albumin as a result of normal liver metabolism.
  • Certain medications: Insulin, growth hormone, and anabolic steroids can cause a temporary increase in the production of albumin.
  • Technical factors: Using a tourniquet for too long while drawing a blood sample for testing can concentrate the albumin in your blood.

Symptoms to Look For

High albumin is rarely the direct cause of symptoms. When you feel unwell, you are suffering the effects of dehydration:

  • Intense thirst and a parched mouth
  • Dark, strong-smelling urine that is less frequent
  • Feeling lightheaded or dizzy when you stand up
  • Feeling very tired and weak
  • An increased heart rate
  • Dry, less elastic skin
  • Headaches and confusion from the loss of fluids

Rehydration typically resolves high albumin quickly. Drink water gradually and monitor symptoms.

How Albumin Testing Works

Doctors perform the albumin blood test by drawing blood from your arm. You usually don’t need to fast before the test unless you are having it as part of a comprehensive metabolic panel.

A healthcare professional inserts a needle into a vein in your arm. It only takes a few minutes and causes only minimal discomfort.

Laboratories have several methods for measuring the amount of albumin in your blood. The most common are bromocresol green (BCG) and bromocresol purple (BCP). Labs usually return the results within a few days.

“The albumin test is a classic example of how precision medicine works,” says Dr. Jin-Xiong She, founder of Jinfiniti Precision Medicine. “One single biomarker can reflect the status of multiple organ systems in your body. But interpreting the results requires an understanding of the unique context of each patient.”

🧬 MORE READING

  • Building strength after 40 requires different approaches. These anti-aging exercises for longevity support healthy muscle mass without excessive strain.
  • Scientists call Klotho the “longevity protein” because it protects against DNA damage. Discover how this remarkable protein influences healthspan.
  • Inflammation drives albumin down. Discover which supplements reduce cortisol levels and inflammatory stress naturally.

What Your Results Mean for Your Health

Albumin testing is used in diagnosis, screening, and monitoring. Your doctor will order these tests if you have symptoms of liver or kidney disease.

As per Cleveland Clinic, low albumin levels are associated with liver damage, kidney disease, inflammation, shock, and malnutrition. In most cases, a higher level will indicate dehydration.

Repeated tests are used to monitor the severity of an underlying disease and how well you are responding to treatment. In a study of mortality risk, a higher red blood cell distribution width to albumin ratio was linked to a higher risk of death[3].

In most cases, low albumin is not treated with albumin infusions unless certain complications are present. It is managed by addressing the underlying cause, such as malnutrition, liver disease, or inflammation.

Optimal albumin levels indicate healthy liver function, nutrition, and lack of inflammation. It’s one of the many longevity biomarkers you’ll want to track as you age.

Referenced Sources

  1. Amouzandeh M, Sundström A, Wahlin S, Wernerman J, Rooyackers O, Norberg Å. Albumin and fibrinogen synthesis rates in advanced chronic liver disease. American Physiological Society; 2023. https://doi.org/10.1152/ajpgi.00072.2023
  2. Zhang Z, Pereira S, Luo M, Matheson E. Evaluation of Blood Biomarkers Associated with Risk of Malnutrition in Older Adults: A Systematic Review and Meta-Analysis. MDPI AG; 2017. https://doi.org/10.3390/nu9080829
  3. Hao M, Jiang S, Tang J, Li X, Wang S, Li Y, et al. Ratio of Red Blood Cell Distribution Width to Albumin Level and Risk of Mortality. American Medical Association (AMA); 2024. https://doi.org/10.1001/jamanetworkopen.2024.13213