

Secure • Private • Science-backed
A top-down view of foods that increase ferritin levels

How to Increase Ferritin Quickly: 7 Evidence-Based Strategies

You’re exhausted. Your hair is thinning. You can’t get through a workout without hitting a wall. Standard bloodwork comes back normal, your doctor says everything looks fine, and you leave with no answers and the same symptoms.

That story is common enough to have a clinical name: iron deficiency without anemia. And the marker your labs probably didn’t highlight is ferritin.

Ferritin is the protein your body uses to store iron inside cells. When stores run low, your body starts pulling from that reserve to keep hemoglobin production going, which means ferritin drops first, often months or years before your red blood cell count shows anything unusual. By the time anemia appears on a standard CBC, iron depletion has usually been affecting cellular function for a while.

If your ferritin is low and you’re trying to raise it, the process takes longer than most people expect, but the steps are specific and actionable. This article covers what the research actually shows.

What You Should Know

  • Ferritin is your body’s iron reserve protein, and it drops before anemia develops, which means you can have real symptoms with “normal” bloodwork.
  • The fastest reliable way to raise ferritin involves combining dietary iron, absorption enhancers, and removing blockers, not just taking more iron.
  • Iron deficiency disrupts mitochondrial function and energy production even before hemoglobin falls, which is why fatigue is often the first sign and why a normal hemoglobin reading can still miss the problem.
  • Most people who are actively replenishing ferritin see measurable increases within 8–12 weeks; consistent monitoring is the only way to know if what you’re doing is working.

What Ferritin Does in Your Body

Ferritin does more than hold iron in reserve. It’s part of how your body regulates the entire iron economy.

Here’s how the system works: iron circulates in your blood bound to a carrier protein called transferrin. When cells need iron, they pull it from transferrin. When supply exceeds immediate demand, the excess is packed into ferritin for storage. When demand exceeds what’s circulating, the body draws down ferritin reserves.

The problem is that ferritin isn’t just a storage depot. Iron stored in ferritin is also required by the mitochondria. Iron is a cofactor for three of the four enzyme complexes in the mitochondrial electron transport chain, the system that converts oxygen and nutrients into ATP, the molecule your cells use for energy. A 2017 clinical review found that iron deficiency can profoundly disturb mitochondrial function, disrupting the biosynthesis of hemoglobin, myoglobin, and cytochromes. Translation: even before you’re technically anemic, low ferritin can mean your cells are generating less ATP than they should, and that’s why the fatigue from low ferritin often feels deeper than ordinary tiredness.

Iron is also required for DNA replication and immune cell function. Low ferritin touches more systems than most people realize.

Why Standard Lab Reference Ranges Miss the Problem

The conventional lower threshold for ferritin varies by lab, but it often sits around 12–15 ng/mL for adults. Many functional medicine providers target 50–100 ng/mL or higher, particularly for women with fatigue or hair loss. That gap matters because you can have measurable mitochondrial energy deficits and significant hair shedding at levels that conventional panels mark as “normal.”

Hair follicles are among the most metabolically active structures in the body, and they’re among the first to be rationed when iron stores fall below a functional threshold. A 2022 observational study in Dermatology Practical & Conceptual of 250 women with telogen effluvium (the clinical term for diffuse stress-related hair shedding) found that ferritin levels were significantly lower in those patients compared to healthy controls. Hair loss associated with iron deficiency often begins before ferritin drops into the flagged “deficient” range.

Take this as a reason to test specifically for ferritin, not just hemoglobin, rather than a reason to self-treat without data.

The 7 Strategies for Raising Ferritin Quickly

Raising ferritin requires the right combination of inputs and a consistent approach. No single change gets you there on its own.

Prioritize Heme Iron Sources

Dietary iron comes in two forms: heme and non-heme. Heme iron is found only in animal protein and is significantly more bioavailable. A foundational analysis in the American Journal of Clinical Nutrition modeling iron absorption from 24 complete meals found that the type and source of dietary iron explained the largest portion of variability in absorption, with heme iron consistently outperforming plant sources across conditions.

The best dietary sources of heme iron:

  • Beef liver (approximately 6–7 mg per 3 oz serving)
  • Oysters and clams (among the highest iron-per-serving seafood)
  • Lean red meat: beef, lamb, venison
  • Dark poultry: legs and thighs over breast
  • Tuna and other dark-fleshed fish

For vegetarians and vegans, plant sources of iron (lentils, beans, tofu, fortified grains, dark leafy greens) are important, but the absorption rate from non-heme sources is lower. Pairing them with vitamin C consistently improves the yield.

Use Vitamin C at the Right Time

Vitamin C enhances the conversion of non-heme iron into a form the intestine can absorb more readily. The benefit applies specifically to non-heme iron and is most relevant for people relying heavily on plant-based sources.

That said, a well-designed 2020 randomized clinical trial published in JAMA Network Open compared iron supplementation plus 200 mg of vitamin C against iron supplementation alone in 440 patients with iron deficiency anemia. At the 8-week mark, ferritin increased by 35.75 ng/mL in the vitamin C group versus 34.48 ng/mL in the iron-only group, not a statistically significant difference. In patients already taking supplemental iron in an adequate dose, the additional vitamin C didn’t change the outcome.

The practical takeaway: vitamin C matters most when you’re relying on food sources and non-heme iron. It’s less critical as an add-on to a properly dosed iron supplement. Talk with your clinician about whether adding vitamin C to your iron supplement makes sense for your specific situation.

Remove the Absorption Blockers

Some common foods and drinks significantly reduce iron absorption when consumed alongside iron-rich meals or supplements. The same model that quantified absorption from dietary sources also documented how much individual factors could lower it.

  • Tea and coffee: polyphenols in both bind to iron and reduce absorption substantially. The effect is dose-dependent and occurs even with moderate consumption around meals.
  • Calcium: a glass of milk or calcium supplement taken with an iron-rich meal can measurably reduce absorption.
  • Phytates: found in unsoaked legumes, whole grains, and seeds. Soaking or fermenting these foods reduces the phytate content and improves iron yield.
  • Excess fiber taken immediately with iron.

The fix is timing. Iron-rich meals and iron supplements work best taken separately from coffee, tea, and high-calcium foods, ideally by at least an hour on either side. You don’t need to eliminate these foods; you need to create a window.

Consider Taking Supplements on Alternate Days

This one surprises most people. Research into iron absorption regulation has found that after the intestine absorbs a dose of iron, it temporarily increases production of hepcidin, a hormone that signals the gut to absorb less iron. Translation: taking iron daily can cause the body to absorb each subsequent dose less efficiently than if you spaced doses out.

A meta-analysis of 129 randomized controlled trials of iron supplementation in children, published in BMJ Global Health, found that intermittent (1–2 times per week) and frequent (3–7 times per week) regimens were similarly effective at reducing iron deficiency anemia, though ferritin levels increased more with higher-frequency supplementation. Talk with your clinician about what dosing interval is appropriate for your specific situation — but every-other-day is worth asking about if you’re experiencing GI side effects from daily iron.

Choose the Right Form of Iron Supplement

Not all oral iron supplements are the same. The most common prescription form is ferrous sulfate, which is effective but can cause significant GI side effects (constipation, nausea, stomach cramping) that lead people to stop taking it.

Alternative forms include:

  • Iron bisglycinate (glycinate chelate): generally better tolerated than ferrous sulfate, with comparable absorption in most people
  • Ferric maltol: a newer formulation with good evidence in IBD patients where absorption is compromised
  • Heme iron (from liver concentrate): bypasses the hepcidin-regulated pathway entirely, which may offer absorption advantages, particularly for people with gut issues

If you’ve tried and stopped iron supplements because of side effects, the issue may be the form rather than the supplement category. Talk with your clinician about switching formulations before concluding that oral supplementation doesn’t work for you.

Address Underlying Root Causes

This is the step most ferritin articles skip entirely.

Ferritin doesn’t stay low without a reason. The most common root causes include:

  • Heavy menstrual bleeding: the single most common driver in premenopausal women, and often underestimated. Monthly blood loss can outpace dietary and supplemental iron intake, particularly if periods are heavy or prolonged.
  • Poor gut absorption: conditions including celiac disease, Crohn’s disease, SIBO, and low stomach acid all reduce the amount of iron your intestine can take up. Taking more iron doesn’t resolve the problem if absorption is impaired.
  • Chronic inflammation: ferritin is an acute-phase reactant, meaning it rises in response to inflammation. This can make ferritin levels harder to interpret: someone can have elevated ferritin and still be functionally iron-deficient if chronic inflammatory signaling is sequestering iron inside cells. Context and additional markers matter.
  • Insufficient dietary intake: common in vegetarian and vegan diets, during pregnancy, and in endurance athletes whose demand exceeds typical dietary supply.

“Low ferritin is almost always the downstream sign of something specific,” says Dr. Jin-Xiong She, founder of Jinfiniti Precision Medicine. “Identifying whether the problem is supply, absorption, or blood loss determines which intervention actually moves ferritin in the right direction. Supplementing without that answer often produces slow or inconsistent results.”

If you’ve been supplementing for more than 8–12 weeks with limited progress, the root cause investigation is the next step, not a higher dose.

Track It, Don’t Guess

Ferritin responds slowly. Unlike some markers that shift in days or weeks, rebuilding iron stores takes time, typically 3 to 6 months of consistent supplementation before ferritin returns to a functional range from a significantly depleted starting point.

That timeline makes retesting essential. A meta-analysis of 21 randomized controlled trials in adults with non-anaemic iron deficiency found that IV iron (the fastest intervention available) improved physical function and fatigue compared to placebo, with ferritin rising by an average of 245 µg/L. Oral iron works slower but remains effective for most people when combined with the strategies above. The only way to know whether it’s working for you, and at what dose, is to retest at 8–12 weeks.

The AgingSOS® at-home health panels from Jinfiniti include comprehensive biomarker assessment, giving you a full picture of iron status alongside inflammation markers, micronutrient levels, and other factors that influence how your ferritin actually responds to intervention.

What About IV Iron?

For people with severely depleted stores, a significant absorption problem, or a condition like heart failure or chronic kidney disease where oral supplementation isn’t viable, intravenous iron is an option. A randomized controlled trial comparing IV iron against oral iron in pregnant women with IDA found that IV iron significantly reduced rates of anemia at delivery compared to oral supplementation, though both approaches have appropriate contexts.

IV iron is not a shortcut for otherwise healthy people with mild-to-moderate ferritin deficiency. It carries its own risks, requires clinical monitoring, and the evidence for its use in non-anemic populations, while growing, is still rated “low” quality by systematic review standards. For most people, the combination of dietary optimization, the right supplement form, and consistent dosing over several months produces results that don’t require an infusion.

Frequently Asked Questions

How quickly can you raise ferritin levels?

With consistent oral supplementation and dietary changes, most people see measurable ferritin increases within 4–8 weeks. Returning to a functional range from a significantly depleted starting point typically takes 3–6 months. The timeline depends on how low you’re starting from, your root cause, how well you absorb iron, and whether you’re actively losing it through bleeding or a gut condition.

What ferritin level should I be targeting?

Conventional lab reference ranges mark levels as low as 12 ng/mL as “normal” for women, but many clinicians working in functional or integrative medicine target 50–100 ng/mL as an optimal range for women, particularly those with fatigue or hair loss. There is no single universally agreed threshold. Talk with your clinician about what target makes sense given your symptoms and overall health picture.

Should I take iron supplements every day or every other day?

Either can be appropriate depending on your starting level, your GI tolerance, and the form of iron you’re taking. Some research suggests that alternate-day dosing can maintain absorption efficiency because it allows hepcidin levels to return to baseline between doses. Talk with your clinician about which schedule fits your situation.

What foods should I avoid when trying to increase ferritin?

Avoid consuming tea, coffee, and high-calcium foods within an hour of an iron-rich meal or an iron supplement. You don’t need to eliminate these from your diet; the timing window is the key variable.

Can I test my ferritin at home?

Not via a finger-prick test, but comprehensive at-home biomarker panels are available. For a complete picture of what’s driving low ferritin and how your iron status connects to other markers like inflammation, the AgingSOS® panels are worth exploring.

What does low ferritin feel like?

The most common presentation includes persistent fatigue that doesn’t fully resolve with sleep, reduced exercise tolerance, difficulty concentrating or brain fog, increased hair shedding, brittle nails, cold hands and feet, and restless legs, particularly at night. These symptoms often appear before ferritin drops into the flagged “deficient” range on standard labs, which is why testing specifically for ferritin matters.

🧬 Related Reading

References

  1. Musallam KM, Taher AT. Iron deficiency beyond erythropoiesis: should we be concerned? Curr Med Res Opin. 2018;34(1):81–93. doi:10.1080/03007995.2017.1394833
  2. İbiş S, Aksoy Saraç G, Akdağ T. Evaluation of MCV/RDW Ratio and Correlations With Ferritin in Telogen Effluvium Patients. Dermatol Pract Concept. 2022;12(3):e2022151. doi:10.5826/dpc.1203a151
  3. Li N, Zhao G, Wu W, et al. The Efficacy and Safety of Vitamin C for Iron Supplementation in Adult Patients With Iron Deficiency Anemia: A Randomized Clinical Trial. JAMA Netw Open. 2020;3(11):e2023644. doi:10.1001/jamanetworkopen.2020.23644
  4. Hallberg L, Hulthén L. Prediction of dietary iron absorption: an algorithm for calculating absorption and bioavailability of dietary iron. Am J Clin Nutr. 2000;71(5):1147–60. doi:10.1093/ajcn/71.5.1147
  5. Andersen CT, Marsden DM, Duggan CP, et al. Oral iron supplementation and anaemia in children according to schedule, duration, dose and cosupplementation: a systematic review and meta-analysis of 129 randomised trials. BMJ Glob Health. 2023;8(2). doi:10.1136/bmjgh-2022-010745
  6. Dugan C, Cabolis K, Miles LF, Richards T. Systematic review and meta-analysis of intravenous iron therapy for adults with non-anaemic iron deficiency: An abridged Cochrane review. J Cachexia Sarcopenia Muscle. 2022;13(6):2637–2649. doi:10.1002/jcsm.13114
  7. Lewkowitz AK, Stout MJ, Cooke E, et al. Intravenous versus Oral Iron for Iron-Deficiency Anemia in Pregnancy (IVIDA): A Randomized Controlled Trial. Am J Perinatol. 2021;39(8):808–815. doi:10.1055/s-0041-1740003
A woman with bloating after her workout

Bloated After a Workout? Here’s What’s Actually Happening

You finish a good session, glance in the mirror, and your stomach looks rounder than when you walked in. The waistband feels tighter. You worked hard, you maybe even skipped the post-gym snack, and somehow you look puffier.

Here’s the reassuring part. Feeling bloated after working out is common, and it almost never means you gained fat. What you’re seeing is some mix of water, swallowed air, and your body’s normal repair response to exercise. Most of it clears within a day or two on its own.

The useful question isn’t whether post-workout bloating is normal. It usually is. The better question is which of these six things is driving it for you, and which fixes actually move the needle.

What You Should Know

  • Looking bloated after a workout is usually fluid and air, not fat gain.
  • Hard exercise causes small amounts of muscle swelling and water retention that fade in 24 to 48 hours.
  • How and what you eat and drink around training has a big effect on gut bloating.
  • Puffiness that’s constant, one-sided with sharp pain, or paired with sluggish recovery is worth a closer look.

Is It Fat or Just Bloat?

Before blaming the workout, it helps to separate two different things your mirror lumps together: a puffy gut and puffy muscles. They feel similar but come from different places, and they clear on different timelines.

Bloat is fluid and air, not fat

Fat gain takes a sustained calorie surplus over days and weeks. A rounder belly that shows up within an hour of training and settles by the next morning is fluid shifting around, not new fat. Short-term swings on the scale follow the same rule. Anything that appears fast and reverses fast is water.

Is it your gut or your muscles?

Gut bloating sits in your abdomen and often comes with gas, pressure, or burping. Muscle puffiness shows up in the area you just trained, like fuller-looking arms after a pressing session or tighter legs after squats. You can have both at once, which is why the post-workout reflection can feel dramatic even when nothing is wrong.

The 6 Reasons You Look Bloated After Working Out

Most post-workout bloating traces back to one of these six causes. Several can stack on the same day, so don’t be surprised if more than one applies to you.

1. Your muscles are swollen from the work itself

When you train, especially with weights or anything new, you create microscopic damage in the muscle fibers. Your body responds with a brief inflammatory repair process that pulls blood and fluid into the area. In one controlled study, eccentric arm exercise produced measurable swelling, soreness, and a spike in muscle-damage markers for several days afterward.

That’s the “pump” you see right after lifting, plus a slower, lingering fullness over the next day or two. It’s a sign of recovery, not damage you need to worry about.

2. Is glycogen pulling water into your muscles?

Yes, and it’s one of the most overlooked reasons people look fuller after training. Your muscles store carbohydrate as glycogen, and glycogen doesn’t sit there dry. Research in human muscle shows that each gram of glycogen is stored with at least 3 grams of water.

As your body restocks glycogen after a workout, it parks water alongside it. Translation: refueling your muscles also rehydrates them, which can read as puffiness on the surface.

3. You swallowed more air than you think

Breathing hard through your mouth, gulping water mid-set, and even talking between reps all send extra air into your digestive tract. That trapped air expands the stomach and creates real bloating. Reviews of athletes find that swallowed air and exercise itself are common triggers of upper-gut symptoms, including a self-limited side stitch known as exercise-related transient abdominal pain.

The harder and longer the session, the more air tends to accumulate. Straws and carbonated drinks beforehand make it worse.

4. Did your gut get put on hold?

During hard effort, your body reroutes blood away from digestion and toward your working muscles and skin. Gastrointestinal complaints are common as a result, affecting roughly 30 to 50 percent of athletes, and that reduced gut blood flow is one of the main drivers. The effect is stronger when you go in underhydrated.

With digestion slowed, whatever is in your stomach sits longer and ferments, which produces gas and a heavy, distended feeling. This is why a big or high-fiber meal right before training so often backfires.

5. You drank too little, or too much

Hydration cuts both ways. Go in dehydrated and your body holds onto water and slows digestion, both of which can leave you puffy. Overdo it in the other direction and you create a different problem. Drinking large volumes of plain water during long sessions can dilute your sodium and cause your body to retain fluid, a condition called exercise-associated hyponatremia that shows up in endurance events.

The sweet spot is steady, moderate intake with electrolytes, not a race to chug as much water as possible.

6. Are your hormones holding onto water?

Hard or prolonged exercise raises hormones that tell your kidneys to hold water, including the antidiuretic hormone that limits how much fluid you flush out afterward. That temporary fluid retention is part of normal recovery. Hormones also explain why this isn’t the same for everyone. Estrogen shapes both fluid balance and the body’s hormonal response to exercise, which is one reason many women notice more post-workout puffiness at certain points in their cycle or during perimenopause.

How to Fix Bloating After Working Out

You can’t switch off your body’s repair response, and you wouldn’t want to. But most of the gut-related bloating is very manageable once you know the levers. Here’s where to start.

Time your pre-workout meal

Give yourself two to three hours between a full meal and a hard session so digestion isn’t competing with your muscles. If you need fuel closer to training, keep it small and simple: easy carbs over high-fat, high-fiber, or heavy protein, which sit longer in a slowed gut. Skip carbonated drinks and straws beforehand to cut down on swallowed air.

Should you change how you drink?

Sip steadily rather than gulping, and add electrolytes for longer or sweatier sessions instead of relying on plain water alone. Sodium, potassium, and magnesium help your body manage fluid where it belongs. If you tend to feel puffy and crampy, a mineral gap is worth ruling out before you blame the workout.

Does it clear on its own?

In most cases, yes. The muscle swelling and glycogen-bound water that make you look fuller typically settle within 24 to 48 hours as your body finishes restocking and rebalancing. Gentle movement, like a walk the next day, helps fluid drain. Time and consistency do most of the work.

When Post-Workout Bloating Is Worth a Closer Look

Routine puffiness is one thing. A pattern that doesn’t fit the usual timeline is another, and that’s where paying attention pays off.

When is post-workout bloating normal?

It’s normal when it’s mild, shows up after harder or newer workouts, and fades within a day or two. It’s also normal for it to come and go as your training and hydration change week to week. None of that needs fixing beyond the basics above.

Signs worth getting checked

Talk with your clinician if swelling is sharp, sudden, and one-sided, especially after a twist or pop, which can point to an injury rather than ordinary recovery. The same goes for puffiness that keeps getting worse over several days instead of better, bloating that has nothing to do with exercise, or distension that comes with pain, vomiting, or blood. These are out of the ordinary and deserve a real evaluation.

The case for measuring inflammation

Here’s the precision angle most articles skip. If you’re consistently puffy and slow to bounce back, session after session, the issue may not be the workout at all. Lingering swelling and poor recovery can reflect higher background inflammation, which is measurable rather than something to guess at. Looking at markers like CRP alongside other root causes turns a vague “why am I always puffy” into a clear answer. It’s also a useful moment to understand your cellular energy and NAD levels, since recovery capacity depends on them, and to consider supplements that target chronic inflammation only once you know it’s actually elevated.

“A puffy reflection after a hard workout is usually water finding its way back out of your cells over the next day or two. The person I pay attention to is the one who stays puffy and slow to recover week after week. That pattern is rarely about the workout. It’s a signal to measure inflammation and see what the body is actually doing.” — Dr. Jin-Xiong She, founder of Jinfiniti Precision Medicine

Stress hormones feed into this too. If your training is intense and your recovery is poor, it can be worth learning how to test your cortisol levels so you’re acting on data instead of assumptions.

🧬 Related Reading

Frequently Asked Questions

Is it normal to look bloated after every workout?

For many people, yes. Some post-workout fullness comes from blood and fluid moving into worked muscles, plus normal water retention during recovery. If it’s mild and fades within a day or two, it’s nothing to worry about.

How long does post-workout bloating last?

Most muscle swelling and glycogen-related water settle within 24 to 48 hours. Gut bloating from swallowed air or a pre-workout meal often clears within a few hours. Puffiness that drags on for days, or keeps worsening, is worth a closer look.

Can drinking more water reduce workout bloating?

Steady, moderate hydration helps, especially if you tend to train underhydrated. But chugging large amounts of plain water can backfire by diluting your sodium and causing fluid retention. Pair water with electrolytes for longer sessions and sip rather than gulp.

Does looking bloated after a workout mean I gained weight?

No. Fat gain requires a sustained calorie surplus over days and weeks. A rounder belly that appears within an hour of exercise and reverses by the next morning is water and air, not fat.

Should I take a diuretic for post-workout water retention?

Routine post-workout puffiness clears on its own and doesn’t call for a water pill. Diuretics can disrupt the electrolyte balance you’re trying to protect, so talk with your clinician before using one, particularly if you train hard or sweat heavily.

References

  • O’Fallon KS, Kaushik D, Michniak-Kohn B, Dunne CP, Zambraski EJ, Clarkson PM. Effects of quercetin supplementation on markers of muscle damage and inflammation after eccentric exercise. Int J Sport Nutr Exerc Metab. 2012;22(6):430-437. doi:10.1123/ijsnem.22.6.430
  • Fernández-Elías VE, Ortega JF, Nelson RK, Mora-Rodriguez R. Relationship between muscle water and glycogen recovery after prolonged exercise in the heat in humans. Eur J Appl Physiol. 2015;115(9):1919-1926. doi:10.1007/s00421-015-3175-z
  • de Oliveira EP, Burini RC, Jeukendrup A. Gastrointestinal complaints during exercise: prevalence, etiology, and nutritional recommendations. Sports Med. 2014;44(Suppl 1):S79-S85. doi:10.1007/s40279-014-0153-2
  • Waterman JJ, Kapur R. Upper gastrointestinal issues in athletes. Curr Sports Med Rep. 2012;11(2):99-104. doi:10.1249/JSR.0b013e318249c311
  • Rosner MH. Exercise-associated hyponatremia. Phys Sportsmed. 2008;36(1):55-61. doi:10.3810/psm.2008.12.12
  • Kraemer RR, Francois M, Castracane VD. Estrogen mediation of hormone responses to exercise. Metabolism. 2012;61(10):1337-1346. doi:10.1016/j.metabol.2012.03.009

A man standing outside with a NAD+ patch on his finger, first-person view.

NAD+ Patches vs Injections: What the Evidence Shows

What You Should Know

  • Both patches and injections deliver NAD+ as a molecule that cannot cross cell membranes intact.
  • No published clinical trials have demonstrated that NAD+ patches or subcutaneous injections raise intracellular NAD+ levels.
  • NAD+ is an intracellular molecule, and the relevant target is levels inside your cells (40–100 μM), not blood concentration.
  • Clinical trial data shows a well-formulated oral precursor supplement can outperform subcutaneous injections on the only measure that actually matters.

If you’ve been researching NAD+ supplementation, patches and injections probably caught your attention. They sound more clinical than a powder you stir into water. More direct. More serious.

The appeal makes sense. Both methods promise to bypass digestion and deliver NAD+ straight into your bloodstream. For something as important as cellular energy, that sounds like an upgrade over a capsule.

Here’s what most comparisons leave out: getting NAD+ into your blood is not the same as getting it into your cells. And the research on whether patches or injections accomplish the latter is thinner than most people realize.

CLIA-Certified NAD Blood Test

Test your intracellular NAD+ levels from home.

Jinfiniti Intracellular NAD Test on purple background

Why People Turn to NAD Patches and Injections in the First Place

The logic behind both methods is intuitive. Oral supplements have to survive digestion before anything useful reaches your bloodstream. If you can skip that step, you should end up with more NAD+ available for your cells. On paper, patches and injections seem like the smarter route.

It’s a reasonable conclusion. But it rests on an assumption worth examining: that the NAD+ delivered into your blood actually ends up where it needs to go.

This section covers how each method works before we get to what the evidence says about whether either one is doing what people assume.

How NAD+ Patches Work

NAD+ patches are worn on the skin, typically on the upper arm, inner wrist, or abdomen. They release NAD+ gradually through the skin over 12 to 14 hours. Some use passive diffusion, while others use iontophoresis technology, which applies a mild electrical current to push molecules through the skin barrier more actively.

The appeal is convenience. No needles, no clinic visit, no scheduled appointments. You apply the patch and go about your day. Depending on the brand, patches contain anywhere from 400mg to over 1,000mg of NAD+.

How NAD+ Injections Work

NAD+ injections are administered subcutaneously (just beneath the skin into fatty tissue) or intramuscularly. Both routes bypass the digestive system entirely, delivering NAD+ directly into tissue near the bloodstream.

Subcutaneous doses are typically in the 50 to 200mg range, given two to three times per week. Intramuscular injections absorb faster and allow for slightly larger volumes. Most protocols require a clinic visit or physician oversight, though some providers have moved toward at-home self-injection kits. For a complete breakdown of how each injection route works, our overview of NAD+ injections covers the key differences.

The Core Problem Both Methods Share

Before comparing patches to injections against each other, there is a more important question worth answering first: does either method actually raise NAD+ inside your cells?

This is where most comparison articles stop short.

NAD+ Is Too Large to Cross Cell Membranes

NAD+ is an intracellular molecule. It does not naturally circulate in the bloodstream in meaningful amounts, and there is a clear biological reason for that: the NAD+ molecule is too large to cross cell membranes intact.

Dr. Eric Verdin, President of the Buck Institute for Research on Aging, has stated this directly: “NAD+ is too big to enter cells and is mostly broken down into nicotinamide when injected. Oral precursors like NMN or NR are a better bet for most people.”

Research published in Science Advances on NAD+ precursor synthesis pathways confirms that even intravenously administered NAD+ is rapidly broken down into smaller metabolites before reaching intracellular targets. A study in Metabolites examining extracellular NAD+ metabolism in human cells found that dinucleotides and mononucleotides are degraded by blood enzymes to nucleosides before cells can absorb them.

Delivering NAD+ into your bloodstream does not reliably translate into raising NAD+ inside your cells.

What “Bioavailability” Actually Means for NAD+

Most discussions of patches versus injections focus on bioavailability in terms of how much NAD+ reaches your blood. That is the wrong metric.

The relevant target for NAD+ is intracellular concentration, measured in micromoles (μM). According to Dr. Jin-Xiong She, founder of Jinfiniti Precision Medicine and a genomic researcher with over 400 peer-reviewed publications, the optimal intracellular NAD+ range is 40 to 100 μM. Levels below 40 μM are associated with fatigue, slower recovery, and reduced cellular repair capacity. Levels above 100 μM are not associated with additional benefit and may carry risk.

A 2019 pilot study in Frontiers in Aging Neuroscience found that urinary NAD+ levels jumped 538% during a six-hour IV infusion, meaning a substantial portion of what was delivered passed through the body without being used at the cellular level. Raising the number in your blood is not the same as raising it where it does anything useful.

To understand what intracellular NAD+ actually does in the body, starting with the fundamentals of how NAD+ functions at the cellular level gives useful context.

Comparing Patches and Injections Side by Side

With the core limitation in mind, here is how the two methods compare across the factors that matter most.

NAD+ PatchesNAD+ Injections
Clinical trials (humans)No published RCTsNo published RCTs for SC/IM
Intracellular efficacyNot establishedNot established
Cost$15–80 per patch$50–200 per session
ConvenienceHigh (at-home)Low to moderate
Common side effectsSkin irritationInjection site reactions, nausea
Medical supervisionNot typically requiredOften required

Both columns share the same most important row: no published randomized controlled trials demonstrating intracellular NAD+ improvement.

The Evidence Gap for NAD+ Patches

The research on NAD+ patches specifically is sparse. As a review by Bolt Pharmacy found, no peer-reviewed human clinical trials have evaluated the efficacy of NAD+ patches, and bioavailability through intact skin remains unestablished. There is no published pharmacokinetic data measuring blood NAD+ levels following patch application, let alone intracellular levels.

The iontophoresis technology used in some patches is legitimate and has real medical applications. Whether it can meaningfully push NAD+ molecules through skin and into cells is a separate question, and it remains unanswered by the published literature.

The Evidence Gap for NAD+ Injections

There is currently no published clinical evidence demonstrating the safety, efficacy, or clinical benefit of NAD+ administered via subcutaneous or intramuscular injection.

Subcutaneous injections typically deliver just 20mg of NAD+ per dose, which is far below even IV infusion doses of 500mg. And the evidence for IV NAD+ therapy itself is extremely limited. If 500mg infused directly into a vein does not reliably raise intracellular levels, the case for 20mg under the skin is difficult to defend on current evidence.

What the Clinical Data Points to Instead

If patches and injections both lack trial evidence for intracellular improvement, what does the research support?

The answer is NAD+ precursors delivered orally, specifically molecules like NMN and nicotinamide riboside (NR) that are small enough to enter cells, or that convert into forms that can.

Why NAD+ Precursors Work Differently

Unlike NAD+ itself, precursor molecules are designed to raise intracellular levels through a different mechanism. NR can cross cell membranes directly and is converted to NAD+ inside the cell. NMN is converted to NR outside the cell first, enters the cell, then reconverts to NMN and ultimately to NAD+. Both pathways have been studied in multiple randomized controlled trials in humans, with consistent findings showing meaningful increases in intracellular NAD+ levels.

This is a fundamentally different approach than delivering NAD+ directly by patch or injection. Precursors give cells the raw materials to build NAD+ from the inside, rather than trying to deliver a molecule that cannot reliably get through the cell membrane in the first place.

The Multi-Pathway Advantage

Formulation quality matters as much as precursor choice. Research comparing single-ingredient NAD+ precursors against multi-pathway formulas shows a meaningful gap in outcomes.

In Jinfiniti’s own clinical trial, 85% of participants reached optimal intracellular NAD+ levels (40–100 μM) within four weeks of supplementing with Vitality NAD+ Booster, a formula combining NMN, niacinamide, creatine monohydrate, and D-Ribose.

NAD+ levels doubled on average across the group. Clinical data from a separate functional medicine clinic comparing patients on subcutaneous NAD+ injections against the Vitality formula found that not a single patient on injections reached the optimal intracellular range, while the majority on the oral formula did.

As Dr. She explains: “The goal isn’t a specific milligram dose. It’s reaching and sustaining the optimal intracellular range of 40 to 100 μM. And the only way to know whether any method is actually getting you there is to measure it.”

How to Know If Any NAD Treatment Is Working

Whether you’re using patches, injections, or an oral formula, symptom tracking has real limits. Energy and cognitive clarity can shift for many reasons that have nothing to do with NAD+. Suboptimal levels can also persist without obvious symptoms.

The honest answer is that intracellular testing is the only reliable way to evaluate whether an intervention is working. You need an actual number in the 40–100 μM range, a baseline to compare against, and a way to confirm whether your approach is moving the needle before committing to a protocol long term.

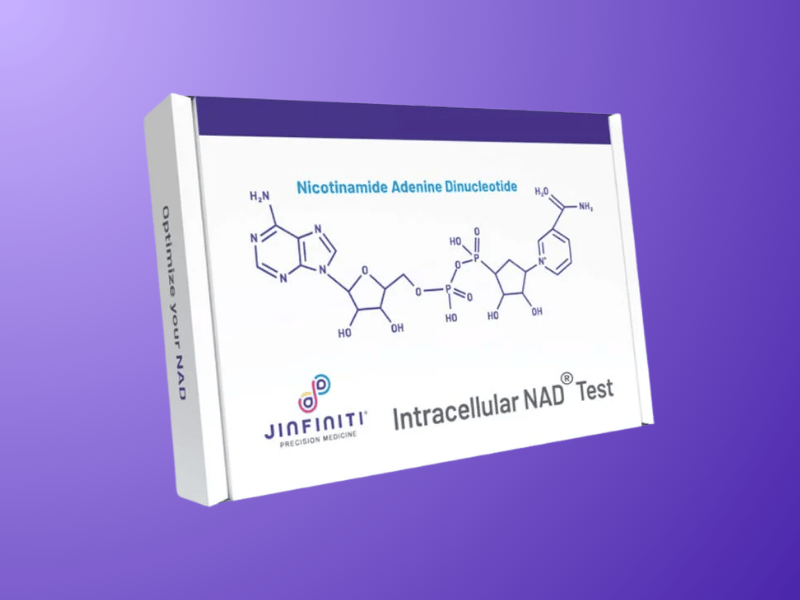
Jinfiniti’s Intracellular NAD® Test is a CLIA-certified, at-home finger-prick test with results delivered within one week. It is the same test used in the clinical trials referenced above. For guidance on how to interpret results and adjust dosing from there, Jinfiniti’s NAD+ dosage guide walks through the data in plain terms.

RELATED READING

Frequently Asked Questions

Are NAD+ patches FDA-approved?

No. NAD+ patches are sold as supplements, not pharmaceutical products. They have not been approved by the FDA for any therapeutic indication and are not subject to the same evidence requirements as medications. Marketing claims about clinical efficacy should be read with that in mind.

Do NAD+ injections require a prescription?

This depends on the provider and jurisdiction. Some clinics offer NAD+ injections under physician oversight; others operate in less regulated settings. Because there are no established standards for SC or IM NAD+ injection protocols, practices vary widely between providers.

Can you combine patches or injections with oral NAD+ supplements?

Some people do, but there is no clinical evidence guiding combined use. Given that the evidence base for patches and injections is limited, adding them to a proven oral formula does not meaningfully change the picture based on current research. A cleaner starting point is testing your baseline intracellular levels, starting with an evidence-backed formula, and measuring again after four weeks.

How long do NAD+ injection effects last?

Provider marketing often suggests effects lasting several days. There is no published clinical trial data confirming this for subcutaneous or intramuscular NAD+ injections specifically. IV infusions raise circulating NAD+ temporarily, but those effects reflect blood concentration, not verified intracellular improvement.

What side effects are associated with NAD+ patches and injections?

Patches can cause skin irritation, which is more common in people with sensitive skin. Injections may produce redness, tenderness, or discomfort at the injection site. IV infusions carry a more significant profile, including nausea, cramping, chest tightness, and anxiety. These risks are among the reasons leading researchers recommend oral precursors over injectable NAD+.

How do I know if my NAD+ levels are actually low?

Testing is the only reliable way to find out. The optimal intracellular NAD+ range is 40 to 100 μM. Many people fall below this threshold by their 40s or earlier, often without clear symptoms. An at-home intracellular NAD+ test gives you a baseline and a way to track whether any intervention is actually working over time.

  1. Yaku, K., Palikhe, S., Iqbal, T., Hayat, F., Watanabe, Y., Fujisaka, S., Izumi, H., Yoshida, T., Karim, M., Uchida, H., Nawaz, A., Tobe, K., Mori, H., Migaud, M. E., & Nakagawa, T. (2025). Nicotinamide riboside and nicotinamide mononucleotide facilitate NAD+ synthesis via enterohepatic circulation. Science Advances, 11(12), eadr1538. https://doi.org/10.1126/sciadv.adr1538
  2. Kulikova, V., Shabalin, K., Nerinovski, K., Yakimov, A., Svetlova, M., Solovjeva, L., Kropotov, A., Khodorkovskiy, M., Migaud, M. E., Ziegler, M., & Nikiforov, A. (2019). Degradation of extracellular NAD+ intermediates in cultures of human HEK293 cells. Metabolites, 9(12), 293. https://doi.org/10.3390/metabo9120293
  3. Grant, R., Berg, J., Mestayer, R., Braidy, N., Bennett, J., Broom, S., & Watson, J. (2019). A pilot study investigating changes in the human plasma and urine NAD+ metabolome during a 6 hour intravenous infusion of NAD+. Frontiers in Aging Neuroscience, 11, 257. https://doi.org/10.3389/fnagi.2019.00257

A woman holding her head on a foggy day, representing brain fog during menopause

The Best Supplements for Brain Fog During Menopause

What You Should Know

  • Menopause brain fog has two converging drivers: hormonal disruption and cellular energy depletion. Addressing one without the other often produces inconsistent results.
  • NAD+ levels decline with age and estrogen withdrawal, reducing the fuel available to brain cells for energy production, repair, and signaling.
  • Creatine has credible clinical data for memory improvement in adults, with the strongest effects in older age groups.
  • Testing your NAD+ levels before supplementing gives you a measurable baseline and removes the guesswork from dosing.

You’re mid-sentence and the word just isn’t there. You walk into a room and stand there for a moment, waiting for your brain to catch up. You’ve slept, more or less, and everything still feels slower, hazier, slightly out of reach.

Menopause brain fog is widely framed as a hormone problem. That’s part of the picture. There’s a second factor that gets considerably less attention: a measurable decline in cellular energy that runs alongside the hormonal shift and compounds it. Understanding both matters, because the right supplement depends on which root cause is actually driving the fog for you.

CLIA-Certified NAD Blood Test

Find out if your NAD+ level is contributing to brain fog.

Jinfiniti Intracellular NAD Test on purple background

Menopause Brain Fog Has Two Causes, Not One

The standard explanation for menopause brain fog begins and ends with estrogen. Estrogen drops, cognition changes, here are some adaptogens and B vitamins. Take something, see if it helps.

That approach works for some women. For others, the results are inconsistent — and the reason is usually that only one of two distinct mechanisms is being addressed.

What Estrogen Does for Your Brain

Estrogen isn’t just a reproductive hormone. It regulates neurotransmitter activity (serotonin, dopamine, acetylcholine), supports synaptic density in the hippocampus, and helps maintain glucose transport into neurons. A 2023 review in Therapeutic Advances in Endocrinology and Metabolism found that the menopause-related decline in circulating estrogen may significantly reduce brain bioenergetics, contributing to increased risk of cognitive decline and late-onset Alzheimer’s disease in postmenopausal women.

This explains why women frequently report trouble with word recall, focus, and processing speed during perimenopause, even when standard bloodwork looks completely normal.

Why Cellular Energy Is the Missing Piece

Estrogen also plays a supporting role in mitochondrial function and NAD+ metabolism within brain tissue. NAD+ (nicotinamide adenine dinucleotide) is the coenzyme your cells use to produce energy. Your brain consumes roughly 20% of your body’s total energy output, even at rest. When NAD+ levels drop, brain cells have less fuel for signal transmission, cellular repair, and clearing metabolic waste.

NAD+ levels decline naturally with age, typically beginning in the 30s. A 2024 review in Frontiers in Endocrinology found that estrogen’s decline during menopause drives measurable changes in brain structure, connectivity, and energy metabolism. The hormonal and cellular energy declines aren’t separate events. They’re compounding each other.

Your brain ends up running on less fuel, with less hormonal support, at the same time.

Why Standard Bloodwork Won’t Catch This

A standard metabolic panel won’t detect NAD+ deficiency. Neither will a basic hormone panel. Women experiencing real cognitive symptoms in perimenopause are frequently told their tests look fine, because the biomarkers driving the problem aren’t on the panel. If you’ve been in that situation, our article on the causes of fatigue that blood tests miss covers this directly. Normal bloodwork and cellular dysfunction are not mutually exclusive.

What Makes a Supplement Worth Taking for Brain Fog?

The supplement market for menopause is large, and as Harvard Health has noted, not always well-regulated. Many products make claims that outpace the evidence.

Before choosing a supplement, consider what you’re actually trying to address. Some target the hormonal pathway (B vitamins, vitamin D, adaptogens). Some target the cellular energy pathway (NAD+ precursors, creatine). Some work on both. Which matters most depends on what’s actually depleted.

Targeting the Root Cause, Not the Symptom

A sleep-disrupting progesterone drop is a different problem than a NAD+ shortfall, and the supplement that addresses one won’t fix the other. Identify what’s actually low, then address it precisely. That’s harder than following a generic supplement list, but considerably more likely to produce results you can feel.

One Overlooked Reason Supplements Don’t Work

NAD+ precursor supplements are typically dosed based on population averages, not individual baseline levels. Someone with severely depleted NAD+ needs a very different dose than someone in the suboptimal range. Without a starting measurement, you’re supplementing blind and often under-dosing the specific problem driving your symptoms.

The Best Supplements for Menopause Brain Fog

The supplements below are ranked by the strength of evidence relevant to cognitive function in midlife women. Evidence quality varies across the list; we’re explicit about where it’s strong and where it’s preliminary.

1. NAD+ Precursors: NMN and NR

If the cellular energy component is a meaningful driver of your brain fog, this is the most targeted intervention available.

NMN and NR supply the raw materials your cells use to synthesize NAD+. Researchers have measured age-dependent NAD+ reductions in intact human brain tissue directly, and clinical trials of NR at 1,000 mg/day have produced up to a 2.7-fold increase in blood NAD+ within a week. On the mechanistic side, NAD+ activates Sirt1, which regulates the mitochondrial biogenesis and antioxidant systems neurons depend on for energy. A preclinical study in Journal of Neuroinflammation found that NAD+ repletion improved learning and memory in a cognitive impairment model by restoring this pathway. Animal data shouldn’t be read as a direct prediction of human outcomes, but the mechanism is well-characterized. Human trials on brain-specific outcomes in menopause are still underway.

A multi-pathway formula outperforms single-precursor supplements. Jinfiniti’s Vitality↑® NAD+ Booster combines NMN with Niacinamide, Creatine Monohydrate, and D-Ribose. In a clinical trial of 26 adults aged 35–65, 85% reached optimal NAD+ levels within four weeks, with average levels roughly doubling. No single-ingredient precursor has matched those results in the same population.

2. Creatine

Creatine is most associated with muscle performance. The cognitive research is newer, but the mechanism is straightforward.

The brain runs largely on phosphocreatine, a fast-acting energy reserve neurons draw on for focus, working memory, and processing speed. When stores are depleted, cognitive performance drops measurably. A 2023 systematic review and meta-analysis in Nutrition Reviews, covering 10 randomized controlled trials, found that creatine supplementation improved memory in healthy adults compared to placebo. The effect was most pronounced in older adults (ages 66–76), where the benefit was more than three times larger than in younger participants.

Creatine is also one of the four ingredients in the Vitality NAD+ Booster formula, so it doesn’t require a separate supplement if you’re already addressing the NAD+ side of the equation.

3. Magnesium Glycinate

Magnesium doesn’t target NAD+ or hormonal brain function directly, but it addresses something that significantly amplifies brain fog when it’s dysregulated: sleep.

Night sweats and insomnia are among the most common perimenopause complaints, and poor sleep will compound cognitive symptoms regardless of what else you’re doing. Magnesium glycinate has a calming effect on the nervous system that makes it the most relevant form for sleep support. It’s also more absorbable than oxide or citrate forms and less likely to cause gastrointestinal side effects.

If disrupted sleep is part of your picture, magnesium glycinate deserves a place in the protocol. See The Best Magnesium Supplements for Sleep for a breakdown of forms and dosing.

4. Vitamin D3 + K2

Vitamin D receptors are distributed throughout the brain, including in areas involved with memory and mood regulation. Low vitamin D is extremely common in postmenopausal women, and deficiency is associated with poorer cognitive performance. It’s not the most targeted intervention for brain fog specifically, but it’s a foundational micronutrient gap that’s easy to miss and worth ruling out.

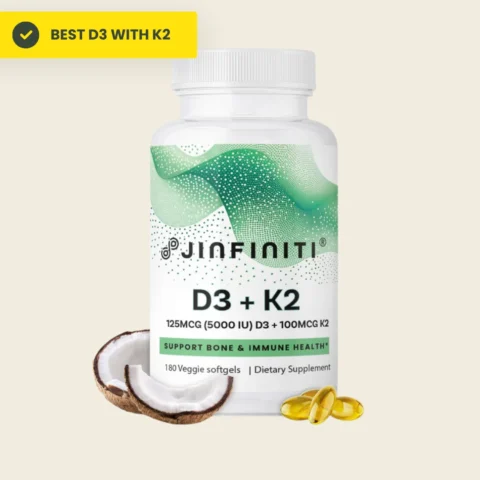
The K2 pairing matters. Vitamin D3 taken without K2 can direct calcium into arteries rather than bone. MK-7, the form used in Jinfiniti’s Vitamin D3 + K2, stays active in the body for approximately 72 hours compared to 8 hours for other K2 forms, making it the more effective option for sustained calcium direction.

5. B Vitamins (B12, B6, Folate)

B vitamins support nerve function and help regulate homocysteine, an amino acid that, when elevated, is independently associated with cognitive decline. B12 deficiency is particularly common as women age, since lower stomach acid production reduces absorption over time. If you haven’t had B12 levels checked recently, it’s a reasonable baseline to establish.

These aren’t specifically targeted at the cellular energy decline of menopause, but the evidence for homocysteine reduction is solid and deficiencies are common enough to address.

How to Know If Your Supplements Are Working

For most supplements, there’s no way to verify they’re working. You take them, wait a few weeks, and try to notice whether you feel different.

Sleep, stress, hormonal fluctuation, and placebo effect all shape how you perceive your own cognition. Without a baseline, you can’t know whether the supplement changed anything.

Testing Your NAD+ Levels Before and After

For the cellular energy piece, this is solvable. Jinfiniti’s Intracellular NAD® Test is an at-home finger-prick blood spot test that measures intracellular NAD+ levels with CLIA-certified accuracy. Results arrive within a week. Optimal range is 40–100 μM; most people presenting with fatigue and brain fog are measurably below it.

Testing before you start supplementing tells you exactly where your levels sit. Testing again at four to six weeks tells you whether the intervention worked and whether the dose needs adjusting.

As Dr. Jin-Xiong She, founder of Jinfiniti and the scientist behind the Vitality NAD+ Booster formula, explains: “Most people assume their NAD+ is fine because nothing in their standard panel flagged it. But intracellular NAD+ isn’t on a standard panel. The only way to know is to measure it — and the number changes how you interpret everything else.”

When to Retest and Adjust

If your four-week post-supplementation test shows levels in the optimal range (40–100 μM), your dose is working. If you’re still suboptimal, dose adjustment is likely needed. Some people require more than the standard serving to reach target levels, particularly when baseline levels were severely deficient. Retesting every three to four months while optimizing is a reasonable cadence.

RELATED READING

Frequently Asked Questions

What is the best supplement for menopause brain fog?

There’s no single best supplement. The most effective intervention depends on which root cause is driving the fog. For cellular energy deficiency, which is measurable via NAD+ testing, a multi-pathway NAD+ booster that includes creatine is the most targeted option. For sleep disruption amplifying cognitive symptoms, magnesium glycinate addresses a different part of the picture. A baseline test is the most efficient starting point before committing to a specific protocol.

Can NAD+ supplements help with menopause brain fog?

Research suggests that NAD+ precursors like NMN and NR may support cognitive function by restoring the cellular energy reserves that estrogen previously helped maintain in brain tissue. Human clinical data on brain-specific outcomes is still developing, but the mechanism is well-characterized and consistent with the broader evidence base on NAD+ and aging. Testing your baseline NAD+ levels before supplementing helps determine whether this is a meaningful factor for you.

Does creatine help with brain fog during perimenopause?

Evidence is growing. A 2023 meta-analysis found creatine supplementation improved memory in healthy adults, with the most pronounced effects in older age groups. The brain relies on phosphocreatine for high-demand cognitive tasks, and low stores correspond to the kind of processing lag many perimenopausal women describe. Creatine is also safe, well-studied, and among the more evidence-backed supplements available for cognitive support in midlife.

How long does it take for supplements to help with menopause brain fog?

It varies by supplement and by how depleted you are at baseline. For NAD+ precursors, Jinfiniti’s clinical trial found that 85% of participants reached optimal NAD+ levels within four weeks. Creatine loading protocols can produce measurable effects faster; maintenance dosing takes longer. Magnesium and vitamin D3 changes tend to become apparent over four to eight weeks. Testing at baseline and again after four to six weeks of consistent supplementation is the most reliable way to track actual progress.

  1. Zhu J, Zhou Y, Jin B, Shu J. Role of estrogen in the regulation of central and peripheral energy homeostasis: from a menopausal perspective. Therapeutic Advances in Endocrinology and Metabolism. 2023;14. https://doi.org/10.1177/20420188231199359
  2. Zhang C, Feng X, Zhang X, et al. Research progress on the correlation between estrogen and estrogen receptor on postmenopausal sarcopenia. Frontiers in Endocrinology. 2024;15:1494972. https://doi.org/10.3389/fendo.2024.1494972
  3. Hou Y, Lautrup S, Cordonnier S, et al. NAD+ in brain aging and neurodegenerative disorders. Cell Metabolism. 2019;30(4):630-655. https://doi.org/10.1016/j.cmet.2019.09.001
  4. Liang Y, Wan X, Qin W, et al. NAD+ improves cognitive function and reduces neuroinflammation by ameliorating mitochondrial damage and decreasing ROS production in chronic cerebral hypoperfusion models through Sirt1/PGC-1α pathway. Journal of Neuroinflammation. 2021;18(1):207. https://doi.org/10.1186/s12974-021-02250-8
  5. Prokopidis K, Giannos P, Triantafyllidis KK, et al. Effects of creatine supplementation on memory in healthy individuals: a systematic review and meta-analysis of randomized controlled trials. Nutrition Reviews. 2023;81(4):416-427. https://doi.org/10.1093/nutrit/nuac064
An image of methylene blue in a liquid solution

NAD vs Methylene Blue: What the Evidence Shows

What You Should Know

  • NAD and methylene blue are fundamentally different types of compounds — one is a natural coenzyme, the other is a synthetic dye with prescription drug status.
  • Methylene blue’s longevity and aging benefits are primarily preclinical; NAD+ precursor supplementation has human clinical trial data behind it.
  • Methylene blue carries a serious drug interaction risk with SSRIs and SNRIs that warrants careful consideration before use.
  • NAD+ levels can be measured with a CLIA-certified intracellular test; no equivalent consumer test exists for methylene blue.

Methylene blue has been making the rounds. If you follow longevity podcasts or biohacking circles, you’ve almost certainly heard it mentioned alongside NAD+ as the next compound worth paying attention to for cellular energy and brain performance.

The interest isn’t unfounded. Both substances interact with mitochondria, both are being studied for cognitive and aging-related outcomes, and both have more scientific backing than most supplements you’d find at a drugstore. But treating them as interchangeable — or even directly comparable — glosses over some significant differences in evidence, safety, and one factor most comparisons skip entirely: whether you can actually measure if it’s working.

CLIA-Certified NAD Blood Test

Find out if your NAD+ is in the healthy range.

Jinfiniti Intracellular NAD Test on purple background

Two Compounds, One Mitochondria

Both NAD+ and methylene blue ultimately affect the mitochondria — the structures inside your cells responsible for converting food into usable energy. But they do it through different mechanisms, at different stages of the process, with different histories of human use. Understanding those differences is what makes the comparison worth having.

What is Methylene Blue?

Methylene blue is a synthetic compound first synthesized in 1876 as a textile dye. It became the first synthetic drug used in medicine, originally deployed against malaria. Today, hospitals use it to treat methemoglobinemia, a blood disorder where red blood cells lose the ability to carry oxygen. It also serves as a surgical marker dye. In longevity clinics and biohacking communities, it’s attracting interest for its potential effects on mitochondrial efficiency and cognitive performance.

One important detail that often gets overlooked in supplement discussions: methylene blue is classified as a prescription drug, not an over-the-counter supplement. The regulatory status matters, both for sourcing and for safety.

What NAD+ Is and Why It Declines

NAD+ — nicotinamide adenine dinucleotide — is a coenzyme found in every living cell. It serves as the primary electron carrier in cellular energy metabolism, participates in more than 500 cellular processes, and acts as a required cofactor for sirtuins, the proteins involved in DNA repair and cellular stress response.

NAD+ levels decline measurably with age, often beginning in the 30s. That decline tracks closely with changes in energy, cognitive performance, metabolic function, and recovery capacity. It isn’t a slow, barely detectable shift — by the time most people are in their 50s, cellular NAD+ can be a fraction of what it was in early adulthood.

How Each Works in the Cell

Understanding where these compounds overlap — and where they don’t — means looking at what they actually do at the cellular level.

Methylene Blue and the Electron Transport Chain

Methylene blue works inside the electron transport chain (ETC) as an alternative electron carrier. It can accept electrons at Complex I and donate them directly to cytochrome c near Complex IV. Translation: it may allow the cell to produce ATP even when parts of the ETC are impaired or sluggish.

It also behaves differently from conventional antioxidants. Most antioxidants neutralize a single free radical and are consumed in the process. Methylene blue oscillates between oxidized and reduced forms, cycling through antioxidant activity repeatedly without being depleted. This auto-recycling behavior is mechanistically interesting, though whether it translates to meaningful clinical benefit in humans at low oral doses is still an open question.

NAD+ and Energy at Every Stage

NAD+ operates upstream and throughout the energy production process. It’s the molecule that accepts electrons from nutrients during metabolism and delivers them into the ETC. It’s also the fuel source for sirtuins — proteins that regulate gene expression, manage cellular stress, and support DNA repair. And it participates directly in circadian rhythm regulation, inflammation control, and mitochondrial biogenesis.

Its role isn’t limited to one step in one pathway. That breadth is part of why NAD+ depletion affects so many systems simultaneously, and why restoring it tends to produce effects across energy, cognition, sleep, and recovery rather than in just one area.

Where the Evidence Diverges

The mechanisms are interesting for both compounds. The more relevant question — especially for someone deciding what to take — is what the human evidence actually shows.

Methylene Blue: Promising but Largely Preclinical

The honest summary: most of methylene blue’s longevity and aging evidence comes from animal models and cell studies. The Alzheimer’s Disease Research Foundation’s cognitive vitality review notes explicitly that no clinical trials have tested the effects of methylene blue on aging and age-related disorders in humans.

There are some human data points. A randomized, double-blind, placebo-controlled pilot study found that a single low dose of methylene blue modulated resting-state brain networks in 26 adults, as measured by fMRI. But that study didn’t measure cognitive performance outcomes directly — it laid neuroimaging groundwork for future trials. A 2023 review in Cureus looked at RCTs of methylene blue derivatives in Alzheimer’s disease and found mixed results, with some improvements in cognitive markers but no definitive conclusions.

The Alzheimer’s space is where the most rigorous human trial work on methylene blue has been done. Outside of that context, the evidence base is thinner. If someone tells you methylene blue is clinically proven for longevity or healthy aging, that claim is running ahead of the data.

NAD+ Precursors: Human Trial Data Exists

NAD+ supplementation has a more developed body of human evidence. A randomized, multicenter, double-blind, placebo-controlled trial of NMN supplementation in 80 healthy middle-aged adults found significant, dose-dependent increases in blood NAD+ levels at both 30 and 60 days, with no safety issues and improved physical performance across all treated groups.

Jinfiniti’s own clinical trial produced direct intracellular data. Twenty-six participants ages 35–65 supplemented with Vitality NAD+ Booster daily; at four weeks, 85% had reached optimal intracellular NAD+ levels (40–100 μM), with NAD+ levels doubling on average. Real-world data from a functional medicine clinic using the Jinfiniti NAD test showed a similar pattern: pure NAD+ precursors from other brands elevated levels in most patients but failed to bring any of them into the optimal range. The multi-pathway formula outperformed single-ingredient precursors across the same patients.

This doesn’t mean NAD+ supplementation works the same way for everyone. Response varies by baseline levels, age, and formula. But unlike methylene blue, there’s enough human data to have a useful conversation about what to expect.

The Risks Are Not Symmetrical

Both compounds carry some risk. The nature and severity of those risks are quite different.

Methylene Blue’s SSRI Interaction Is Serious

Methylene blue is a reversible inhibitor of monoamine oxidase A (MAO-A), the enzyme that breaks down serotonin in the brain. When combined with SSRIs or SNRIs — medications taken by tens of millions of people — this interaction can cause serotonin syndrome.

Serotonin syndrome is not a mild side effect. Research published in the British Journal of Pharmacology confirmed methylene blue’s MAO-A inhibition and its potential to cause serious serotonin toxicity when combined with serotonin reuptake inhibitors. The FDA issued formal safety warnings after reviewing adverse event reports. The Anesthesia Patient Safety Foundation has flagged it as a significant clinical concern.

Most of the documented cases involved IV administration at relatively high doses. Oral, low-dose methylene blue likely carries a different risk profile — but the pharmacological basis for the interaction is real regardless of route. Anyone taking an antidepressant, SNRI, or any serotonergic medication should not use methylene blue without explicit guidance from a clinician who knows their full medication list.

NAD+ Supplementation: A Different Risk Profile

NAD+ precursors — NMN, NR, and niacinamide-based formulas — are generally well-tolerated in human studies. Jinfiniti’s Vitality NAD+ Booster has over five years of safety data from clinical use. Side effects across NAD+ supplementation research have typically been mild and transient.

One boundary worth knowing: NAD+ levels above 100 μM may not confer additional benefit, and very high levels are worth monitoring. This is one concrete argument for testing. When you know your intracellular levels, you can avoid over-supplementing — rather than guessing at a dose and hoping it lands in the right range.

The Question Neither Compound Escapes

There’s a factor most NAD vs methylene blue comparisons don’t address. It matters more than mechanism.

When you take a supplement — any supplement — how do you know it’s working? Most people rely entirely on how they feel. Subjective energy, clarity, recovery. These signals are real, but they’re also unreliable. Sleep, stress, hydration, and a dozen other variables affect how you feel on any given day.

NAD+ is the only mitochondria-targeting compound in this conversation that comes with an accessible, validated biomarker test.

NAD+ Is the Only One You Can Test

Jinfiniti’s Intracellular NAD+ Test measures actual NAD+ concentration inside cells — not just blood levels, but intracellular, where NAD+ actually functions. The test uses a simple at-home finger-prick collection, processed in a CLIA-certified lab, with results in about a week.

The optimal intracellular NAD+ range, based on Dr. She’s clinical research, is 40–100 μM. Most adults who haven’t been supplementing fall well below that. Testing before you start gives you a real baseline. Testing after — typically at four to eight weeks — tells you whether your formula and dose are actually working.

“The only thing worse than not supplementing is supplementing and having no idea whether your levels have changed,” says Dr. Jin-Xiong She, founder of Jinfiniti and the scientist behind the Intracellular NAD® Test. “Testing converts a hope into a fact.”

No equivalent consumer test exists for methylene blue. There’s no standard biomarker, no validated range, no CLIA-certified panel that tells you how it’s affecting your mitochondria. You’re working without a readout.

What That Means for Your Protocol

Precision medicine is built on measurement. You identify a baseline, apply an intervention, and verify the result. That loop is what separates a data-driven health approach from an optimistic one. With NAD+ supplementation, that loop is complete. You can run the test before supplementing, confirm your levels with a repeat test, and adjust dose or formula based on real numbers.

With methylene blue, that loop is open-ended. The intervention may be doing something useful — the mechanisms are real — but there’s currently no accessible way to confirm it in your own biology. That’s not a reason to dismiss it. It is a reason to be clear-eyed about what you know versus what you’re assuming.

Compared to other longevity-adjacent comparisons, the measurability gap between these two compounds is one of the starker ones.

So Who Is Each For?

This isn’t a ranking. It’s an honest characterization based on what the current evidence supports.

Methylene BlueNAD+ (via NMN/NR)
Evidence in humansLimited; mostly pilot studiesMultiple human trials
Longevity/aging evidencePreclinicalMore developed
Measurable via testNoYes (intracellular test)
Drug interaction riskSerious (SSRIs/SNRIs/MAOIs)Generally well-tolerated
Regulatory statusPrescription drugDietary supplement
Optimal dose guidanceNo test to guide itTest-based personalization

Methylene blue may be worth investigating in specific clinical contexts — particularly for people with neurological concerns working closely with a knowledgeable clinician. For anyone on serotonergic medications, the safety concern is serious enough that it needs to be the first conversation, not an afterthought.

For people whose primary concern is energy, cognitive clarity, and healthy aging — and who want something they can verify is working — NAD+ optimization is the better-supported starting point. Especially when approached with testing, which is the only way to know whether your baseline was the problem and whether your intervention fixed it.

It’s also worth noting that nothing in the evidence suggests these compounds are mutually exclusive. They target overlapping but distinct mechanisms. Someone deeply invested in mitochondrial health optimization may eventually explore both — but the case for sequencing NAD+ first, and measuring it, is strong.

If you’re comparing other mitochondria-targeting approaches alongside this one, Urolithin A vs. NAD+ covers another common pairing with a similar evidence-depth comparison.

Frequently Asked Questions

Can you take NAD+ and methylene blue together?

There is no known pharmacological reason why NAD+ precursor supplementation would conflict with methylene blue. The two compounds work through different mechanisms. However, the more important question is methylene blue’s interaction with other medications — particularly SSRIs, SNRIs, and MAOIs. If you’re on any serotonergic medication, that interaction must be addressed with a clinician before adding methylene blue to any stack, regardless of what else you’re taking.

Is methylene blue safe to take daily?

At the low doses used in most supplement contexts, methylene blue appears reasonably well-tolerated in people who are not on serotonergic medications. The safety data for long-term daily low-dose use in healthy adults is still limited compared to NAD+ precursors, which have a more established track record. Anyone with concerns about drug interactions, kidney impairment, or G6PD deficiency should consult a clinician before daily use.

How do I know if my NAD+ levels are low?

The most reliable way is to test. Symptoms like persistent fatigue, brain fog, poor recovery from exercise, and disrupted sleep can point toward low NAD+, but those symptoms have many possible causes. A CLIA-certified intracellular NAD+ test measures your actual cellular levels and tells you whether your levels fall in the deficient, suboptimal, or optimal range. That’s the starting point for any meaningful intervention.

Does methylene blue raise NAD+ levels?

No. Methylene blue and NAD+ work through completely different mechanisms. Methylene blue acts as an electron carrier in the ETC; it doesn’t increase NAD+ synthesis or restore depleted NAD+ levels. If NAD+ deficiency is what’s driving your fatigue or cognitive symptoms, methylene blue won’t address it.

Which is better for brain fog — NAD+ or methylene blue?

Both have mechanisms relevant to cognitive performance, but the human evidence is stronger for NAD+. Methylene blue has shown interesting results in neuroimaging studies and some Alzheimer’s research, but the evidence for general cognitive enhancement in healthy adults is early. NAD+ depletion is a documented contributor to brain fog and cognitive slowdown, and intracellular testing can confirm whether it’s actually the issue for you. That diagnostic clarity is a meaningful advantage.

  • Rodriguez, P., Singh, A. P., Malloy, K. E., Zhou, W., Barrett, D. W., Franklin, C. G., Altmeyer, W. B., Gutierrez, J. E., Li, J., Heyl, B. L., Lancaster, J. L., Gonzalez-Lima, F., & Duong, T. Q. (2017). Methylene blue modulates functional connectivity in the human brain. Brain Imaging and Behavior, 11(3), 640–648. https://doi.org/10.1007/s11682-016-9541-6
  • Hashmi, M. U., Ahmed, R., Mahmoud, S., Ahmed, K., Bushra, N. M., Ahmed, A., Elwadie, B., Madni, A., Saad, A. B., & Abdelrahman, N. (2023). Exploring methylene blue and its derivatives in Alzheimer’s treatment: A comprehensive review of randomized control trials. Cureus, 15(10), e46732. https://doi.org/10.7759/cureus.46732
  • Yi, L., Maier, A. B., Tao, R., Lin, Z., Vaidya, A., Pendse, S., Thasma, S., Andhalkar, N., Avhad, G., & Kumbhar, V. (2022). The efficacy and safety of β-nicotinamide mononucleotide (NMN) supplementation in healthy middle-aged adults: a randomized, multicenter, double-blind, placebo-controlled, parallel-group, dose-dependent clinical trial. GeroScience, 45(1), 29–43. https://doi.org/10.1007/s11357-022-00705-1
  • Ramsay, R. R., Dunford, C., & Gillman, P. K. (2007). Methylene blue and serotonin toxicity: inhibition of monoamine oxidase A (MAO A) confirms a theoretical prediction. British Journal of Pharmacology, 152(6), 946–951. https://doi.org/10.1038/sj.bjp.0707430
  • Ng, B. K. W., & Cameron, A. J. D. (2010). The role of methylene blue in serotonin syndrome: a systematic review. Psychosomatics, 51(3), 194–200. https://doi.org/10.1176/appi.psy.51.3.194
A GLP-1 supplement capsule against a green wavy background.

7 Supplements That Naturally Increase GLP-1 Levels

What You Should Know

  • GLP-1 is a gut hormone that regulates blood sugar, slows digestion, and signals fullness to the brain — and your body makes it naturally after eating.
  • Berberine has the most human trial evidence for supporting GLP-1 activity among natural supplements, though results vary by dose and formulation.
  • Curcumin, psyllium, cinnamon, and ginseng each have human RCT evidence supporting their metabolic effects.
  • Natural GLP-1 support works best as part of a broader metabolic approach, not as a standalone substitute for prescription therapy or root-cause investigation.

By now, most people have heard of Ozempic. Whether you’re on it, curious about it, or actively trying to avoid it, you’ve probably wondered the same thing: if GLP-1 is a hormone your body already makes, is there a way to produce more of it without a prescription?

The short answer is yes — with meaningful caveats. Certain supplements do appear to influence GLP-1 secretion. But the evidence is uneven, the effects are modest compared to pharmaceutical GLP-1 receptor agonists, and a lot of what gets marketed as a “natural Ozempic” alternative doesn’t hold up to scrutiny.

Here’s what the research actually supports.

Metabolic Support

Enhanced absorption Berberine with GLP-activating metabolic blend.

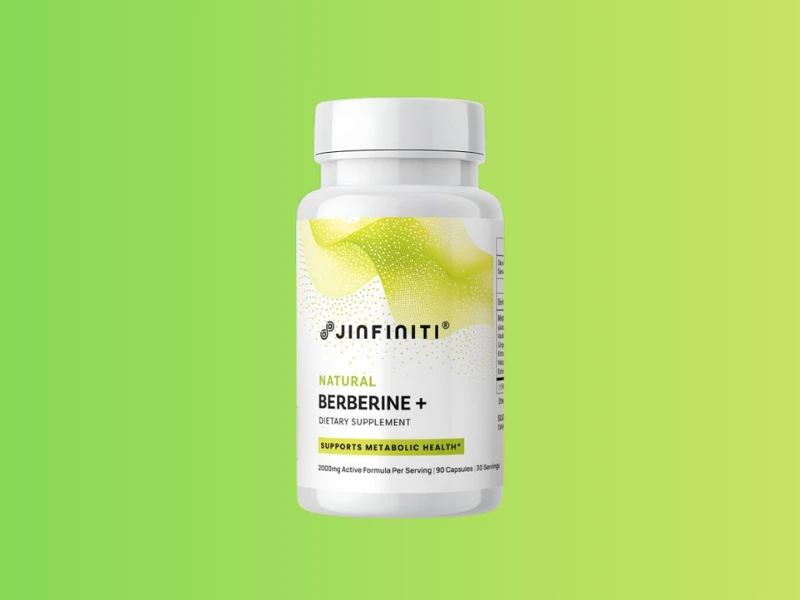
Natural Berberine+ product mockup

What Is GLP-1 and Why Does It Matter?

GLP-1 — glucagon-like peptide-1 — is a hormone released by specialized cells in the gut lining called L-cells, primarily in response to food. A landmark review in Cell Metabolism found that GLP-1 boosts insulin secretion, inhibits glucagon, slows gastric emptying, and reduces food intake. Together, these effects regulate blood sugar, reduce appetite, and support metabolic balance.

This is exactly why GLP-1 receptor agonist drugs became a cultural phenomenon. The STEP 1 clinical trial, published in the New England Journal of Medicine, found that once-weekly semaglutide produced an average body weight reduction of 14.9% over 68 weeks. That reflects just how powerful this hormonal pathway is when pharmacologically activated.

But the underlying biology isn’t synthetic. GLP-1 is something your gut produces every time you eat. The question is whether targeted supplements can meaningfully support that natural output.

Can Supplements Actually Raise GLP-1?

The honest answer: modestly, and in ways that differ meaningfully from what pharmaceutical GLP-1 agonists do.

Natural approaches — fiber, certain plant compounds, probiotics — act upstream. They stimulate L-cells to secrete more GLP-1, or they improve the gut environment that supports GLP-1 secretion. Prescription drugs directly bind to GLP-1 receptors throughout the body at concentrations far beyond what natural production achieves. The mechanisms overlap, but the magnitudes don’t.

That said, meaningful metabolic support doesn’t require pharmaceutical-level effects. For people managing blood sugar, working on weight, or supporting a GLP-1 medication they’re already on, these supplements can contribute — when chosen based on actual evidence.

“The goal isn’t to replace one pathway with a supplement. It’s to understand what your metabolic system actually needs, measure it, and then act. GLP-1 is one signal in a much larger picture.”

— Dr. Jin-Xiong She, Founder, Jinfiniti Precision Medicine

Which Supplements Have the Strongest Evidence for Raising GLP-1?

Not all candidates are equal. Here’s what the research actually says about the most-studied options.

1. Berberine

Berberine is the most evidence-backed natural compound in this category. It’s the one most often called “nature’s Ozempic” — a comparison that’s both instructive and overstated.

A 2023 review in Archives of Physiology and Biochemistry found that berberine stimulates GLP-1 secretion by modulating gut microbiota and influencing insulin signaling pathways. The mechanism involves AMPK activation — the same cellular energy-sensing pathway metformin uses. It also involves bitter taste receptors expressed on gut enteroendocrine cells. Research in Biochemical Pharmacology showed that berberine triggers GLP-1 release specifically through this bitter taste receptor pathway. This explains why gut-expressed receptors respond to the compound even before it’s absorbed systemically.

The clinical evidence is substantial. A 2022 meta-analysis of 37 RCTs involving 3,048 patients, published in Frontiers in Pharmacology, found that berberine significantly reduced fasting plasma glucose by an average of 0.82 mmol/L and HbA1c by 0.63% — without significantly increasing hypoglycemia risk.

Dose matters. Studies showing meaningful effects generally used 1,000mg or more per day. Absorption is also a genuine issue with standard berberine formulations.

Berberine also pairs naturally with alpha-lipoic acid for metabolic support.

2. Curcumin (Turmeric)

Curcumin has more human evidence than most GLP-1 supplement articles give it credit for.

A study in Biochimie found that curcumin stimulates GLP-1 secretion from intestinal L-cells through an oxidation-dependent mechanism. Importantly, the bioactive metabolites of curcumin — not curcumin itself — are responsible for the effect. This matters practically: the form and stability of curcumin in a supplement determines whether you get the relevant metabolites at all. A 2023 study in Molecular Nutrition & Food Research found that curcumin increased GLP-1 secretion in obese mice by expanding the L-cell population in the gut via the microbiota-bile acid axis.

On the human side, a 12-month RCT in Nutrition Journal — 272 subjects with type 2 diabetes receiving 1,500mg curcumin daily — found that curcumin extract significantly reduced fasting blood glucose, HbA1c, and insulin resistance while improving beta-cell function. GLP-1 wasn’t the primary endpoint, but improved beta-cell function is consistent with incretin pathway involvement.

Worth including in a metabolic stack. The direct GLP-1 evidence in humans is still emerging, but the broader metabolic data is solid.

3. Soluble Fiber (Psyllium)

Soluble fiber — particularly from psyllium husk — may not be glamorous, but its metabolic effects are among the better-supported in the literature.

The mechanism is well-defined. Fermentation of soluble fiber in the colon produces short-chain fatty acids (SCFAs). These SCFAs activate G-protein-coupled receptors on L-cells to trigger GLP-1 release. Research published in Diabetes confirmed that SCFAs stimulate GLP-1 secretion via the receptor FFAR2. Mice lacking this receptor showed impaired glucose tolerance — establishing the chain from fiber to GLP-1 to blood sugar control.

A 2024 meta-analysis in BMC Endocrine Disorders confirmed that psyllium produces measurable improvements in fasting blood sugar, HbA1c, and insulin resistance across randomized controlled trials. Psyllium also slows gastric emptying, which prolongs the GLP-1 response to meals independently of the SCFA pathway.

If you’re building a supplement stack for metabolic support, fiber is often the most underrated piece.

4. Probiotics

Certain probiotic strains have real, mechanistically grounded evidence for supporting GLP-1 secretion — and it’s stronger than the typical “gut health” framing suggests.

Research in the Journal of Biological Chemistry demonstrated that the probiotic VSL#3 promotes GLP-1 release from intestinal L-cells via butyrate, a short-chain fatty acid produced when gut bacteria ferment fiber. This established the gut flora → SCFA → GLP-1 chain in preclinical models. Human data followed: a prospective, double-blind RCT in Diabetes Care found that daily administration of Lactobacillus reuteri SD5865 increased glucose-stimulated GLP-1 release by 76% compared to placebo, with corresponding increases in insulin secretion.

Strain specificity remains the practical caveat. Look for documented strains over generic blends if metabolic support is your intent.

5. Cinnamon

Cinnamon’s GLP-1 evidence is stronger than its reputation suggests. A randomized crossover trial in The American Journal of Clinical Nutrition found that 3g of cinnamon significantly increased the postprandial GLP-1 response in 15 healthy subjects. It also reduced the insulin area under the curve — meaning better glucose handling with less insulin demand. That’s controlled human data, not an animal model.

The effect was dose-dependent: 1g produced no significant change, but 3g did. The mechanism likely involves slowed gastric emptying plus incretin stimulation. Cinnamon appears in Jinfiniti’s Natural Berberine+ formula specifically because of these complementary metabolic effects.

6. Ginseng

Red ginseng has moved from traditional use into rigorous clinical research. A 12-week, double-blind, placebo-controlled trial published in Medicine found that red ginseng extract powder improved glycemic control in prediabetic Korean adults, with effects on blood glucose and insulin response consistent with incretin pathway involvement. This is one of the better-designed human studies in this category — and the prediabetic population makes it directly relevant to the metabolic support use case.

Ginseng appears in Jinfiniti’s Natural Berberine+ formula as part of the MetabolicAid blend for this reason.

7. Resveratrol

Resveratrol — found in red wine, grapes, and certain berries — has a plausible mechanism for supporting GLP-1 and a growing evidence base. A study in Metabolism Open found that resveratrol and probiotic supplementation both increased GLP-1 levels and reduced oxidative stress in the intestines of diabetic rats. The combination produced additive effects. Worth flagging: this was animal data. Human trial evidence for resveratrol’s GLP-1 effects specifically remains limited.

Bioavailability is a known limitation of standard resveratrol supplements, which constrains real-world translation without enhanced delivery forms. Treat it as a supporting compound in a broader metabolic stack rather than a primary intervention.

Is GLP-1 Support Enough on Its Own?

Here’s what often gets lost in the supplement conversation: GLP-1 is one hormonal signal in a complex metabolic system. Supporting it in isolation — without addressing blood sugar stability, cellular energy production, inflammation load, or gut health — leaves most of the leverage on the table.

This is especially relevant for people who are on GLP-1 medications and want to support their results, or who have stopped them and are trying to maintain outcomes. The medication addresses GLP-1 receptor activation. It doesn’t address NAD+ levels, mitochondrial function, inflammatory burden, or any of the other cellular factors that shape metabolic health over time.

If you’re curious about how NAD+ and GLP-1 interact metabolically, that overlap is covered in detail. And if you’re experiencing brain fog after eating — a common sign of post-meal blood sugar dysregulation — that article walks through the mechanisms worth investigating.

What Should You Look for in a Berberine Supplement?

If berberine is your primary choice — and based on the evidence, it’s a reasonable one — formulation details matter more than most people realize.

A review in Drug Metabolism Reviews found that berberine undergoes extensive first-pass metabolism after oral administration, resulting in very low plasma exposure. Studies showing meaningful metabolic effects typically used doses at or above 1,000mg daily. Standalone berberine also works through a single pathway. Multi-ingredient formulas that address AMPK activation, absorption, and complementary metabolic mechanisms tend to produce more consistent results.

If you’re comparing options, our berberine supplement guide covers what to look for across the market. Jinfiniti’s Natural Berberine+ contains 1,200mg of high-potency berberine combined with a MetabolicAid blend — including Panax ginseng, cinnamon bark, and astragalus root — with black pepper extract for enhanced absorption. It addresses both the dose and the bioavailability problem simultaneously.

As always: talk with your clinician before starting berberine, particularly if you’re managing blood sugar or taking medications that affect glucose metabolism. The NIH Office of Dietary Supplements maintains current safety profiles for many of these compounds.

Frequently Asked Questions

What is the best supplement to increase GLP-1 naturally?

Berberine has the strongest human evidence for supporting GLP-1 secretion among natural supplements. It works through multiple mechanisms — AMPK activation and bitter taste receptor pathways in the gut — and a meta-analysis of 37 RCTs confirms meaningful glucose-lowering effects. Soluble fiber (psyllium) is a close second, with the SCFA → GLP-1 pathway well-established in the literature. Cinnamon and probiotics also have human RCT support that most articles overlook.

Can berberine replace Ozempic?

No. Pharmaceutical GLP-1 receptor agonists work by directly binding to GLP-1 receptors throughout the body at sustained concentrations far beyond what natural production achieves. The STEP 1 trial showed nearly 15% average weight reduction with semaglutide — effects that natural supplements cannot replicate. Berberine supports GLP-1 secretion upstream and has meaningful metabolic benefits, but the mechanisms and magnitudes are categorically different. It’s a useful complement, not a substitute.

How long does it take for natural GLP-1 supplements to work?

There’s no clean universal answer. Berberine studies showing blood sugar effects typically run 8–12 weeks. The curcumin RCT showing significant HbA1c improvements ran 12 months. Gut microbiome changes from probiotics and fiber take several weeks to develop. The realistic expectation is gradual metabolic support over months, not acute effects within days. Testing relevant biomarkers before and after gives you actual data rather than guesswork.

Are natural GLP-1 boosters safe?

The supplements covered here — berberine, curcumin, psyllium, probiotics, cinnamon — are generally well-tolerated at studied doses. Berberine warrants a clinician conversation if you’re on blood sugar medications, since additive glucose-lowering effects are possible. “Natural” doesn’t mean without consideration, especially at therapeutic doses.

Does fiber really affect GLP-1 levels?

Yes — and the mechanism is one of the most clearly established in this category. When soluble fiber is fermented by gut bacteria, the resulting short-chain fatty acids bind to FFAR2 receptors on intestinal L-cells and directly trigger GLP-1 release. Research in Diabetes confirmed that mice lacking these receptors show both reduced SCFA-triggered GLP-1 secretion and impaired glucose tolerance, demonstrating the pathway’s significance for blood sugar control.

  • Araj-Khodaei, M., Ayati, M. H., Azizi Zeinalhajlou, A., Novinbahador, T., Yousefi, M., Shiri, M., Mahmoodpoor, A., Shamekh, A., Namazi, N., & Sanaie, S. (2023). Berberine-induced glucagon-like peptide-1 and its mechanism for controlling type 2 diabetes mellitus: A comprehensive pathway review. Archives of Physiology and Biochemistry, 130(6), 678–685. https://doi.org/10.1080/13813455.2023.2258559
  • Alli-Oluwafuyi, A.-M., Luis, P. B., Nakashima, F., Giménez-Bastida, J. A., Presley, S. H., Duvernay, M. T., Iwalewa, E. O., & Schneider, C. (2019). Curcumin induces secretion of glucagon-like peptide-1 through an oxidation-dependent mechanism. Biochimie, 165, 250–257. https://doi.org/10.1016/j.biochi.2019.08.013
  • Drucker, D. J. (2018). Mechanisms of action and therapeutic application of glucagon-like peptide-1. Cell Metabolism, 27(4), 740–756. https://doi.org/10.1016/j.cmet.2018.03.001
  • Gholami, Z., Clark, C. C. T., & Paknahad, Z. (2024). The effect of psyllium on fasting blood sugar, HbA1c, HOMA IR, and insulin control: A GRADE-assessed systematic review and meta-analysis of randomized controlled trials. BMC Endocrine Disorders, 24(1), 82. https://doi.org/10.1186/s12902-024-01608-2
  • Hlebowicz, J., Hlebowicz, A., Lindstedt, S., Björgell, O., Höglund, P., Holst, J. J., Darwiche, G., & Almér, L.-O. (2009). Effects of 1 and 3 g cinnamon on gastric emptying, satiety, and postprandial blood glucose, insulin, glucose-dependent insulinotropic polypeptide, glucagon-like peptide 1, and ghrelin concentrations in healthy subjects. The American Journal of Clinical Nutrition, 89(3), 815–821. https://doi.org/10.3945/ajcn.2008.26807
  • Jeong, Y., Lee, S. H., Shim, S. L., Jang, K. H., & Kim, J. H. (2024). Efficacy and safety of red ginseng extract powder (KGC05pg) in achieving glycemic control in prediabetic Korean adults: A 12-week, single-center, randomized, double-blind, parallel-group, placebo-controlled study. Medicine, 103(52), e41130. https://doi.org/10.1097/MD.0000000000041130
  • Pegah, A., Abbasi-Oshaghi, E., Khodadadi, I., Mirzaei, F., & Tayebinai, H. (2021). Probiotic and resveratrol normalize GLP-1 levels and oxidative stress in the intestine of diabetic rats. Metabolism Open, 10, 100093. https://doi.org/10.1016/j.metop.2021.100093
  • Simon, M.-C., Strassburger, K., Nowotny, B., Kolb, H., Nowotny, P., Burkart, V., Zivehe, F., Hwang, J.-H., Stehle, P., Pacini, G., Hartmann, B., Holst, J. J., MacKenzie, C., Bindels, L. B., Martinez, I., Walter, J., Henrich, B., Schloot, N. C., & Roden, M. (2015). Intake of Lactobacillus reuteri improves incretin and insulin secretion in glucose-tolerant humans: A proof of concept. Diabetes Care, 38(10), 1827–1834. https://doi.org/10.2337/dc14-2690
  • Tian, F., Chen, T., Xu, W., Fan, Y., Feng, X., Huang, Q., & Chen, J. (2023). Curcumin compensates GLP-1 deficiency via the microbiota-bile acids axis and modulation in functional crosstalk between TGR5 and FXR in ob/ob mice. Molecular Nutrition & Food Research, 67(22), e2300195. https://doi.org/10.1002/mnfr.202300195
  • Tolhurst, G., Heffron, H., Lam, Y. S., Parker, H. E., Habib, A. M., Diakogiannaki, E., Cameron, J., Grosse, J., Reimann, F., & Gribble, F. M. (2012). Short-chain fatty acids stimulate glucagon-like peptide-1 secretion via the G-protein-coupled receptor FFAR2. Diabetes, 61(2), 364–371. https://doi.org/10.2337/db11-1019
  • Wang, K., Feng, X., Chai, L., Cao, S., & Qiu, F. (2017). The metabolism of berberine and its contribution to the pharmacological effects. Drug Metabolism Reviews, 49(2), 139–157. https://doi.org/10.1080/03602532.2017.1306544
  • Wilding, J. P. H., Batterham, R. L., Calanna, S., Davies, M., Van Gaal, L. F., Lingvay, I., McGowan, B. M., Rosenstock, J., Tran, M. T. D., Wadden, T. A., Wharton, S., Yokote, K., Zeuthen, N., & Kushner, R. F. (2021). Once-weekly semaglutide in adults with overweight or obesity. New England Journal of Medicine, 384(11), 989–1002. https://doi.org/10.1056/NEJMoa2032183
  • Xie, W., Su, F., Wang, G., Peng, Z., Xu, Y., Zhang, Y., Xu, N., Hou, K., Hu, Z., Chen, Y., & Chen, R. (2022). Glucose-lowering effect of berberine on type 2 diabetes: A systematic review and meta-analysis. Frontiers in Pharmacology, 13, 1015045. https://doi.org/10.3389/fphar.2022.1015045
  • Yadav, H., Lee, J.-H., Lloyd, J., Walter, P., & Rane, S. G. (2013). Beneficial metabolic effects of a probiotic via butyrate-induced GLP-1 hormone secretion. Journal of Biological Chemistry, 288(35), 25088–25097. https://doi.org/10.1074/jbc.M113.452516
  • Yaikwawong, M., Jansarikit, L., Jirawatnotai, S., & Chuengsamarn, S. (2024). Curcumin extract improves beta cell functions in obese patients with type 2 diabetes: A randomized controlled trial. Nutrition Journal, 23(1), 119. https://doi.org/10.1186/s12937-024-01022-3
  • Yu, Y., Hao, G., Zhang, Q., Hua, W., Wang, M., Zhou, W., Zong, S., Huang, M., & Wen, X. (2015). Berberine induces GLP-1 secretion through activation of bitter taste receptor pathways. Biochemical Pharmacology, 97(2), 173–177. https://doi.org/10.1016/j.bcp.2015.07.012
A woman with brain fog after eating holds her head

Brain Fog After Eating: Why Meals Can Leave You Mentally Drained

What You Should Know

  • Brain fog after eating is distinct from ordinary post-meal tiredness — it involves slowed thinking, difficulty concentrating, and reduced processing speed, not just drowsiness.
  • Blood sugar spikes and crashes are a common trigger, but don’t explain why fog persists in people who already eat low-glycemic, balanced meals.
  • Mitochondria require NAD+ to convert glucose into usable brain energy — when NAD+ is depleted, that conversion stalls regardless of what you ate.
  • Persistent post-meal fog is worth measuring, not just eating around.

You ate a reasonable meal — maybe some pasta, a sandwich, a normal lunch. Thirty minutes later, you’re at your desk and your thinking has turned to mud. Words are slower, concentration is gone, and a task that should take 10 minutes is taking 45.

Post-meal brain fog — sometimes called postprandial cognitive impairment — is a real and measurable phenomenon, and the causes are more layered than most explanations acknowledge. Blood sugar gets most of the attention. For many people, though, the bottleneck is happening deeper, at the level of cellular energy conversion itself.

CLIA-Certified NAD Blood Test

Find out if your NAD+ is in the healthy range.

Jinfiniti Intracellular NAD Test on purple background

What Is Post-Meal Brain Fog, Exactly?

Post-meal fatigue and post-meal brain fog are not the same thing, and conflating them points toward the wrong fixes.

Post-meal fatigue is largely physical: heaviness, drowsiness, the pull toward a couch. That’s normal to a degree, driven by blood flow shifting toward digestion and certain amino acids (like tryptophan from protein) crossing into the brain.

Post-meal brain fog is cognitive. A 2007 study tracking postprandial glycemia and cognitive function in healthy middle-aged adults found measurable declines in processing speed, attention, and working memory after meals — with sharper glucose drops producing worse cognitive outcomes. And a 2025 study in Medicina found that gastrointestinal symptom severity was positively correlated with brain fog scores, with gut health serving as a significant predictor of cognitive symptoms after meals.

If you’re losing your train of thought mid-sentence or feel like you’re thinking through wet cement for an hour or two after eating, that pattern is the one worth understanding.

How Long Does Post-Meal Brain Fog Last?

Typically 1–3 hours, depending on the trigger and your baseline metabolic health. Blood sugar-driven fog tends to peak 30–60 minutes after eating and clears as glucose restabilizes. Inflammation-driven fog — from food sensitivities — can persist several hours longer.

If it’s happening consistently after most meals, that frequency is itself a data point. It means something in the energy conversion process isn’t keeping pace with demand.

Why Does Blood Sugar Only Tell Part of the Story?

Blood sugar is the most frequently cited cause of post-meal brain fog, and the mechanism is real.

When you eat refined carbohydrates — white bread, pasta, processed foods, added sugar — glucose enters the bloodstream rapidly. The pancreas releases insulin to clear it. If that response overshoots, blood glucose drops sharply, and the brain — which consumes roughly 20% of the body’s total energy and runs almost exclusively on glucose — finds itself temporarily underfueled. That’s what produces the fog.

The problem is that this explanation doesn’t account for people who still experience post-meal fog after cleaning up their diet. The issue in those cases isn’t just upstream (what they’re eating) — it’s downstream: what cells can do with the glucose once it arrives.

Insulin Resistance as an Underlying Cause

When insulin resistance is present, cells become less responsive to insulin’s signals. Glucose circulates in the bloodstream but can’t enter cells effectively — including neurons. The fuel is available but can’t be used.

A 2023 review published in Frontiers in Endocrinology showed that insulin resistance combined with chronic low-grade inflammation disrupts brain function in ways consistent with brain fog symptoms. This matters because according to the CDC, roughly 80% of people with prediabetes don’t know they have it. Post-meal cognitive symptoms can be one of the earliest signs.

Why Doesn’t Low-GI Eating Always Fix It?

The standard advice — lower-glycemic meals, protein and fat to slow glucose absorption, less refined sugar — is sound and does reduce fog frequency for people whose primary issue is blood sugar reactivity. For those whose fog persists despite those changes, the bottleneck is usually cellular, not dietary.

What Role Do Your Mitochondria Play?

Getting glucose into the bloodstream is only the first step. The brain doesn’t run on glucose directly — it runs on ATP, the molecule cells use to power virtually every function. The conversion from glucose to ATP happens inside mitochondria, through a chain of reactions that requires a specific coenzyme at multiple steps: NAD+.

NAD+ and the Mitochondrial Energy Chain

NAD+ (nicotinamide adenine dinucleotide) is an essential electron carrier in mitochondrial energy production. During oxidative phosphorylation — the process by which mitochondria generate the bulk of cellular ATP — NAD+ accepts and transfers electrons down the respiratory chain. When NAD+ is insufficient, that chain slows, ATP output drops, and the brain is among the first organs to register the deficit.

The implication: even after a reasonable meal, if NAD+ levels are too low to support efficient energy conversion, cognitive performance suffers in the postprandial window. The glucose is present. The machinery to process it is underperforming.

What Is NAD and Why Does It Matter for Your Energy? covers the full mechanism in more detail.

Who NAD+ Depletion Hits Hardest

NAD+ declines naturally with age, with levels typically becoming clinically relevant in the 30s and 40s. Metabolic stress, chronic inflammation, poor sleep, and high caloric load all accelerate the decline — conditions that also, predictably, make post-meal brain fog worse.

A 2022 review in Nutrients found that NAD+ depletion is a consistent factor in cognitive decline across multiple conditions, including diabetes and age-related impairment. A separate preclinical study found that restoring NAD+ levels via NMN in diabetic models preserved mitochondrial oxidative phosphorylation function, prevented hippocampal neuron loss, and maintained cognitive performance. These are animal models — human data on NAD+ and post-meal cognition specifically remains limited — but the mechanism is well-established.

“When people tell me they feel mentally sluggish after eating and dietary changes haven’t resolved it, the first question I ask is what their intracellular NAD+ levels look like,” says Dr. Jin-Xiong She, founder of Jinfiniti Precision Medicine. “Glucose metabolism and NAD+ availability are deeply linked. You can’t separate post-meal cognitive energy from what’s happening in the mitochondria.”

What Else Worsens Post-Meal Brain Fog?

The cellular energy bottleneck rarely operates alone. Several common factors compound it, and identifying which ones are active matters for choosing the right response.

CauseTypical PatternWho It Affects Most
Blood sugar crashFog 30–60 min after high-carb meals; clears within an hourAnyone eating refined carbohydrates regularly
Insulin resistanceFog even after moderate meals; worsens over timeAdults 35+, sedentary, metabolically stressed
NAD+ depletionFog despite clean eating; worsens with age or chronic fatigueAdults 40+, anyone with known metabolic decline
Food sensitivityFog 1–4 hours post-meal; tied to specific trigger foodsPeople with gut symptoms or autoimmune history
Cortisol dysregulationFog worse on high-stress days, independent of food choiceChronic stress, poor sleep, shift workers

Food Sensitivities and the Gut-Brain Axis

For people with gluten sensitivity, certain FODMAPs, or lactose intolerance, eating a trigger food initiates an immune response that sends inflammatory signals through the gut-brain axis to the brain. The cognitive effect can outlast blood sugar-related fog by several hours.

An estimated 6% of the population has non-celiac gluten sensitivity, and celiac disease prevalence has risen five-fold over the past 50 years — though many cases go undiagnosed. Identifying sensitivities requires systematic elimination, not intuition.

Chronic inflammatory burden also amplifies the cellular energy problem. The Best Anti-Inflammatory Supplements for Calming Inflammation covers how inflammatory load affects energy and cognition.

How Does Stress Make Post-Meal Fog Worse?

Cortisol, the body’s primary stress hormone, directly regulates blood sugar. When cortisol levels are chronically elevated or following an abnormal diurnal rhythm, glucose management after meals becomes less stable — spikes are more pronounced, and the subsequent drop is steeper.

If post-meal fog reliably worsens on high-stress days regardless of what you eat, cortisol dysregulation may be a primary contributor rather than a secondary one. How to Test Cortisol Levels: Methods, Timing, and Next Steps explains what testing looks like and how to interpret it.

Meal Size and Blood Flow Redistribution

Large meals trigger a significant increase in blood flow to the gastrointestinal tract to support digestion. This transient redistribution can mildly reduce cerebral perfusion at exactly the moment mitochondria are being asked to ramp up ATP production. The effect is minor on its own but amplifies all other causes.

What Actually Helps With Post-Meal Brain Fog?

The right intervention depends on which cause is active. For most people, at least two or three of these factors are overlapping.

Food and Lifestyle Changes to Try First

These apply broadly and carry low risk. Start here before testing or supplementing.

  • Lower the glycemic load of your meals. Replacing refined carbohydrates with whole grains, legumes, and fiber-rich vegetables reduces glucose spikes and smooths the insulin response. This is the most effective starting point for people whose fog correlates with high-carb meals.
  • Add protein and fat to every meal. Both slow gastric emptying and moderate glucose absorption. If your meals are primarily carbohydrate-based, this is an easy adjustment with a measurable effect.
  • Eat smaller portions. This reduces the blood flow redistribution effect and lessens the simultaneous demand on mitochondrial energy systems.
  • Walk for 10 minutes after eating. Postprandial movement significantly improves glucose clearance — a finding that has replicated consistently across studies and requires no equipment.
  • Identify food triggers systematically. If fog follows certain foods reliably, eliminate one at a time and reintroduce after two to three weeks. Avoid eliminating broad food groups simultaneously.

Talk with your clinician before making significant dietary changes, especially if you’re managing a metabolic condition or taking medications that affect blood sugar.

What Should You Do If Diet Changes Don’t Fix It?

If fog persists after a few weeks of dietary adjustment, the problem is most likely cellular rather than dietary — and the appropriate response is measurement, not more elimination.

Intracellular NAD+ levels are measurable through an at-home finger-prick test, the Intracellular NAD panel. Optimal levels fall between 40–100 μM; below that range, mitochondrial energy conversion is likely compromised. This is distinct from what standard blood panels measure — conventional tests don’t assess NAD+ or cellular energy status, which is why post-meal fog so often persists despite “normal” results.

Our article on being tired all the time despite normal blood tests covers why conventional testing misses cellular-level dysfunction, and what to look for instead.

NAD+ supplementation isn’t a solution for everyone with post-meal fog. For people whose fog is primarily driven by food sensitivities or cortisol dysregulation, it won’t be the primary lever. But for those with cellular energy bottlenecks — especially adults over 40 with persistent fog despite a clean diet — measuring NAD+ is the most direct way to know whether mitochondrial function is a limiting factor.

Frequently Asked Questions

Why Do I Get Brain Fog After Eating Carbs?

Refined carbohydrates cause rapid glucose spikes followed by an insulin-driven drop that temporarily cuts the brain’s fuel supply. This is the blood sugar mechanism — the most common explanation and often a real contributing factor. It’s compounded when insulin resistance is present, or when NAD+ levels are too low to efficiently convert the glucose that does make it into cells.

How Long Does Brain Fog After Eating Last?

Typically 1–3 hours. Blood sugar-related fog often resolves within an hour as glucose stabilizes. Inflammation-driven fog from food sensitivities can persist for several hours. Fog lasting consistently beyond 2–3 hours suggests something other than a simple glucose response.

Can Brain Fog After Eating Be a Sign of Something Serious?

Persistent post-meal fog can be an early signal of insulin resistance or prediabetes, conditions most people aren’t aware of until they’re further along. It can also indicate significant NAD+ depletion, thyroid dysfunction, or celiac disease. Consistent symptoms after meals — especially if they don’t improve with dietary changes — are worth evaluating with biomarker testing.

Does Intermittent Fasting Help With Post-Meal Brain Fog?

For some people, yes. Fasting periods allow insulin to reset and may improve insulin sensitivity over time, reducing the severity of post-meal crashes. People who report sharper thinking in a fasted state than after eating are often experiencing a glucose-dependency issue rather than a true cellular energy ceiling — a meaningful distinction for choosing the right intervention.

What Foods Cause the Most Post-Meal Brain Fog?

Refined carbohydrates and added sugar are the most consistent triggers, with cognitive effects peaking 30–60 minutes after eating. Gluten (in people with sensitivity), dairy, and high-FODMAP foods are the next most common culprits. The specific pattern — which foods, how soon afterward, and how long it lasts — is useful diagnostic information worth tracking.

A barberry branch in soft natural lighting

Berberine and Alpha Lipoic Acid: Do They Work Better Together?

What You Should Know

  • Berberine activates AMPK, signaling cells to absorb glucose and burn fat. Human trials show reductions in fasting blood sugar, HbA1c, and LDL cholesterol.
  • ALA helps cells turn glucose into usable energy. That’s separate from its antioxidant role, and the main reason it pairs well with berberine.
  • The combination makes biological sense, but trials studying it directly are limited. Individual compound research is the real foundation.
  • Both interact with blood sugar medications. Anyone on metformin, insulin, or similar drugs should consult their clinician first.

Berberine and alpha lipoic acid target blood sugar and metabolic health through different but sequential mechanisms — and that’s exactly why the combination has a stronger scientific rationale than most supplement pairings.

Berberine drives glucose into cells by activating AMPK. ALA supplies the mitochondrial cofactor that helps cells convert that glucose into usable energy. Used together for the right reasons, they address the same metabolic problem at two distinct points in the chain.

The more useful question isn’t whether they work together. It’s whether this stack makes sense for your specific situation — and how you’d know if it’s doing anything.


Metabolic Support

Natural Berberine+ with 626% better absorption.

Natural Berberine+ product mockup

What Berberine Does

Berberine is a natural plant compound found in barberry, goldenseal, and Oregon grape — and it’s been studied in humans, not just petri dishes. That distinction matters in a supplement market where most “research-backed” claims trace back to rodent models or cell cultures.

The AMPK Connection

Berberine’s main mechanism is AMPK activation. AMPK (AMP-activated protein kinase) is the enzyme your cells use to gauge energy availability. When it’s turned on, it shifts cellular behavior toward glucose uptake and fat oxidation — meaning your cells become more responsive to insulin, pull more glucose out of the bloodstream, and burn fuel more efficiently.

A 2024 mechanistic review in Pharmaceuticals summarized berberine’s effects across multiple cellular, animal, and clinical studies: significant reductions in fasting blood glucose and HbA1c (average blood sugar over 2–3 months), improved insulin resistance, and reduced inflammatory signaling — through several complementary cellular pathways.

This is also why berberine gets compared to metformin. Both activate AMPK. Both improve how well cells respond to insulin. A 2008 randomized controlled trial published in Metabolism directly compared the two in newly diagnosed type 2 diabetes patients and found berberine produced comparable blood sugar reductions at the same dose. Berberine is not a pharmaceutical and shouldn’t be treated as one, but the biological parallel is real and clinically documented.

What Does the Human Trial Data Show?

Human trial data on berberine is more solid than most supplement categories. Reductions in fasting blood glucose, HbA1c, LDL cholesterol, and triglycerides have shown up across multiple randomized trials. A 2024 review in International Journal of Molecular Sciences found berberine among the natural compounds with the most consistent clinical evidence for obesity-related metabolic markers, including blood sugar control and cholesterol levels.

For anyone evaluating specific berberine products, form and absorption matter considerably. See our guide to choosing a berberine supplement for what to look for in a formula.

What Alpha Lipoic Acid Does

Alpha lipoic acid tends to get lumped into the general antioxidant category, which undersells what it actually does. Yes, it neutralizes free radicals. But its more precise role is as a mitochondrial enzyme cofactor — and that’s where the berberine connection becomes interesting.

Why Is ALA More Than Just an Antioxidant?

ALA helps your cells finish the job that glucose absorption starts. When glucose enters a cell, it gets broken down into a simpler molecule called pyruvate. The next step — converting that pyruvate into usable energy (ATP, the fuel your cells run on) — requires ALA. Without it, pyruvate can back up, lactic acid accumulates, and you end up with cellular fatigue rather than energy.

Most people know ALA as an antioxidant. That part is real. But its role inside the mitochondria — your cells’ power generators — is what makes it relevant alongside berberine specifically.

A 2015 review in the Canadian Journal of Physiology and Pharmacology described ALA as having antioxidant, anti-inflammatory, and insulin-like activity, with a particular role in supporting how cells produce energy — which is distinct from its antioxidant function and why it’s been studied in both metabolic and neurological conditions.

ALA and Insulin Sensitivity

ALA also has its own, separate effects on how well cells respond to insulin. A 2023 comprehensive review in Nutrients found that ALA helps move glucose transporters to the cell surface — the same mechanism berberine also activates — through insulin signaling pathways that work partly independently of AMPK.

In plain terms: the two compounds drive glucose uptake through overlapping but distinct routes, which is part of why combining them is appealing. ALA is also well-established for reducing symptoms of diabetic neuropathy, a type of nerve damage caused by prolonged high blood sugar. That’s one of ALA’s strongest evidence bases, and worth knowing if nerve symptoms are part of the picture.

One caution flagged in that review: in some predisposed individuals, ALA has been associated with Insulin Autoimmune Syndrome (IAS) — a rare condition where the body develops antibodies against its own insulin. It’s not a reason to avoid ALA for most people, but worth knowing if autoimmune conditions run in your history.

Berberine vs. Alpha Lipoic Acid: How They Compare

Both compounds target metabolic health, but through different entry points. This table summarizes the key differences before getting into why combining them makes sense.

BerberineAlpha Lipoic Acid (ALA)
Primary mechanismActivates AMPK — signals cells to absorb glucose and burn fatHelps cells convert glucose into energy; also a direct antioxidant
Main metabolic effectImproves glucose absorption and insulin responseSupports energy production inside cells; reduces oxidative stress
Helps insulin work betterYes — through multiple cellular signaling pathwaysYes — through overlapping but distinct pathways from berberine
Anti-inflammatoryYes — blocks proteins that trigger inflammationYes — neutralizes free radicals; replenishes vitamins C and E
Strongest clinical evidenceBlood sugar, HbA1c, cholesterol, insulin resistanceDiabetic nerve damage (neuropathy), insulin response, oxidative stress
Typical research dose1,000–1,500mg/day in divided doses300–600mg/day
Preferred formBerberine HCl (most human trial data uses this form)R-ALA (the biologically active form)
Key cautionCan amplify blood sugar-lowering medicationsRare: Insulin Autoimmune Syndrome in predisposed individuals
GI toleranceModerate — take with meals; start low and build upGenerally well-tolerated

Why Are Berberine and ALA Often Taken Together?

The case for combining berberine and ALA comes down to a single biochemical sequence: berberine gets glucose into cells, and ALA helps those cells do something useful with it.

Berberine drives glucose into cells — by activating AMPK and improving how cells respond to insulin. ALA ensures those cells can efficiently turn that glucose into energy, by acting as an essential cofactor in the step where pyruvate becomes ATP — the fuel your cells actually run on.

Without adequate ALA, increased glucose uptake can stall mid-process — pyruvate backs up rather than becoming energy. The two compounds cover back-to-back steps in the same sequence.

Both compounds also reduce inflammation, but through different routes. Research published in Inflammation Research found that AMPK activation — berberine’s primary mechanism — blocks key proteins that trigger chronic inflammation, and may protect against diabetes-related nerve damage. ALA, meanwhile, directly neutralizes free radicals and helps replenish other antioxidants like vitamins C and E that get depleted in the process.

The overlap isn’t redundancy. It’s coverage from different angles.

What the Research Says About the Combination

The mechanistic argument for combining berberine and ALA is solid. The individual compound evidence is solid. What’s limited is direct clinical trial data studying this specific combination — most available data comes from multi-ingredient products, which makes it difficult to isolate the pairing’s contribution.

This is worth being honest about. The pairing has a clear biological rationale and appears in multi-ingredient clinical protocols, but anyone expecting large-scale head-to-head trials specifically on this combination will be disappointed. The individual compound research is the real evidence base. The combination is reasonable extrapolation from that foundation.

Who Is This Stack Most Likely to Help?

The people with the clearest potential benefit from combining berberine and ALA tend to share a common metabolic picture: elevated fasting blood sugar, poor insulin response, high triglycerides, or the cluster of issues known as metabolic syndrome.

ALA has its strongest independent evidence in diabetic neuropathy — nerve damage caused by prolonged high blood sugar — so anyone dealing with those symptoms alongside metabolic concerns has a specific reason to consider it.

Other groups that come up in the clinical literature:

  • People with pre-diabetes trying to prevent progression through lifestyle changes and supplementation
  • Those managing blood sugar without medication who want to support insulin response from multiple angles
  • People using GLP-1 medications (like Ozempic or Wegovy) who have lost weight but still have underlying metabolic issues unresolved
  • People with PCOS, where poor insulin response is a central driver — ALA has been studied specifically in this population as part of a broader review of supplements in PCOS

For a broader look at how berberine sits within the metabolic supplement conversation, see our article on natural alternatives to metformin.

Dosing, Forms, and Cautions

What Are the Research-Based Doses for Each Compound?

Most clinical trials showing meaningful berberine outcomes used 1,000–1,500mg daily, split across two or three doses taken with meals. Berberine HCl is the specific form used in the vast majority of published human trials. Newer forms like dihydroberberine or phytosome-bound berberine exist and may absorb differently, but they carry far less clinical data to support them.

For ALA, 300–600mg daily is the range most commonly used in clinical research. Most commercial products contain a mix of the active and inactive forms of ALA (often labeled as “R/S-ALA” or just “ALA”). Products that specify “R-ALA” contain only the biologically active form — meaning the same milligram dose delivers more of what your body can actually use. If a product specifies R-ALA, the dosing math changes accordingly.

What Safety Considerations Apply to This Stack?

  • Berberine compounds the blood sugar-lowering effects of metformin, insulin, and other glucose-lowering medications. If you’re on any of those, monitor glucose levels and loop in your clinician.
  • ALA’s association with Insulin Autoimmune Syndrome is rare but documented, particularly in people with a specific genetic predisposition. The risk appears low in the general population but is worth flagging if autoimmune conditions run in your family or medical history.
  • Both compounds are generally well-tolerated. Across clinical trials, gastrointestinal discomfort is the most commonly reported berberine side effect — affecting roughly a third of participants in some studies — and typically resolves when doses are taken with meals or titrated up gradually.

Talk with your clinician before starting this combination, especially if you’re managing a chronic condition or taking prescription medications.

Which Biomarkers Should Move If Berberine and ALA Are Working?

If you’re taking berberine and ALA for a specific metabolic reason — blood sugar control, cardiovascular risk reduction, or insulin resistance — measurable biomarkers should shift within 8–12 weeks at therapeutic doses.

Fasting glucose and HbA1c (average blood sugar over 2–3 months) are the clearest signals for blood sugar effects. Fasting insulin and HOMA-IR (a calculated score that estimates insulin resistance from fasting glucose and insulin levels) give you the insulin response picture directly. Triglycerides and ApoB (a more precise measure of cardiovascular particle risk than standard LDL) are the cardiovascular markers berberine acts on most consistently. hs-CRP (a blood marker for chronic inflammation) is worth tracking if inflammation is part of the concern.

Without a baseline, you have no way to know which direction you started from — or whether anything changed. That’s the same problem with most supplementation: people take something for three months and try to remember whether they feel different. Feeling better is real data, but it’s not the only kind available.

As Dr. Jin-Xiong She, founder of Jinfiniti and researcher behind our supplement formulations, puts it: “The patients who get the most out of targeted supplementation are the ones who measure before they start. You’re not guessing at what needs to move — you know. And when you retest, you know if it moved.”

If you’re using berberine for cardiovascular support specifically, our guide to reducing ApoB levels covers which markers matter and what interventions the research supports.

Frequently Asked Questions

Can You Take Berberine and Alpha Lipoic Acid Together?

Yes. They work through different mechanisms — berberine primarily by activating AMPK to improve how cells absorb glucose, ALA by helping cells convert that glucose into usable energy and reducing oxidative stress — and there’s a sound biological rationale for pairing them. If you’re on medications that affect blood sugar, talk with your clinician before adding either compound.

What Does Alpha Lipoic Acid Do Alongside Berberine?

Berberine improves how much glucose gets into cells. ALA helps those cells convert that glucose into energy efficiently, by acting as a required step in the cellular energy-making process. ALA also adds independent effects on insulin response and free radical protection through pathways that don’t fully overlap with berberine’s.

Is There Direct Clinical Evidence for the Berberine and ALA Combination?

Not much, if you’re looking for trials studying this specific combination head-to-head. The evidence for each compound individually is solid, particularly around blood sugar and metabolic markers. The combination is backed by clear biological logic and used in clinical settings, but the direct combination trial data is limited — something any honest assessment of this stack should acknowledge.

How Long Before Berberine and ALA Produce Measurable Results?

Berberine trials have shown meaningful effects on fasting glucose and HbA1c within 4–12 weeks at standard doses. ALA’s effects on insulin response and nerve-related symptoms in clinical trials typically appear within 4–8 weeks at 300–600mg. Individual response varies depending on starting values, diet, and consistency.

Are There Any Risks to Combining Berberine and ALA?

Both compounds are generally safe for healthy adults at typical doses. The main cautions: berberine can amplify the effects of blood sugar medications, so monitor glucose if you’re on metformin or insulin. ALA has a rare association with Insulin Autoimmune Syndrome in people with a specific genetic predisposition. Digestive discomfort is the most common berberine side effect, usually manageable by starting at a lower dose or taking it with food. If you have any chronic conditions or take prescription medications, get medical guidance before starting.

  • Askari VR et al. A Mechanistic Review on How Berberine Use Combats Diabetes and Related Complications. Pharmaceuticals. 2024. https://doi.org/10.3390/ph17010007
  • Hidalgo-Lozada GM et al. Clinically Effective Molecules of Natural Origin for Obesity Prevention or Treatment. Int J Mol Sci. 2024. https://doi.org/10.3390/ijms25052671
  • Rochette L et al. Alpha-lipoic acid: molecular mechanisms and therapeutic potential in diabetes. Can J Physiol Pharmacol. 2015. https://doi.org/10.1139/cjpp-2014-0353
  • Capece U et al. Alpha-Lipoic Acid and Glucose Metabolism: A Comprehensive Update. Nutrients. 2023. https://doi.org/10.3390/nu15010018
  • Behl T et al. A spotlight on underlying the mechanism of AMPK in diabetes complications. Inflamm Res. 2021. https://doi.org/10.1007/s00011-021-01488-5
  • Yin J et al. Efficacy of berberine in patients with type 2 diabetes mellitus. Metabolism. 2008. https://doi.org/10.1016/j.metabol.2008.01.013
  • Alesi S et al. Nutritional Supplements and Complementary Therapies in Polycystic Ovary Syndrome. Adv Nutr. 2022. https://doi.org/10.1093/advances/nmab141
The Best Vitamin D3 Supplements: Image with four D3 supplement bottles in a sunlit forest.

The Best Vitamin D3 Supplements in 2026 for Every Need

What You Should Know

  • Vitamin D3 (cholecalciferol) raises and sustains blood levels significantly more effectively than D2, the form found in most fortified foods.
  • D3 is fat-soluble, so oil-based delivery (such as softgels with coconut oil) meaningfully improves absorption compared to dry tablet forms.
  • Pairing D3 with vitamin K2 as MK-7 matters more than most supplement labels communicate: K2 directs calcium to bones rather than arteries.
  • The only way to confirm a vitamin D supplement is working is to test blood levels before and after.

Most people know they should probably be taking vitamin D. Fewer know which form, how much, or whether the one they’ve been buying is actually doing anything.

More than 40% of U.S. adults have insufficient vitamin D levels. That number has been climbing for decades, even as the supplement aisle has expanded. The gap persists because deficiency is largely invisible until it isn’t. No dramatic symptoms. Just a slow background decline in energy, bone density, immune function, and mood that standard bloodwork often misses until levels have been low for a long time.

The good news is that D3 supplementation works. The less good news is that most people pick a supplement based on price or brand name, take it without knowing their baseline, and never verify that their levels actually improved.

This guide covers what actually matters in a D3 supplement, four picks organized by use case, and why adding a baseline test changes the entire equation.

PickProductD3 DoseK2 FormCarrier OilFormat
Best with K2Jinfiniti Vitamin D3 + K25,000 IUMK-7 (100mcg)Coconut oilSoftgel
Best softgel without K2Doctor’s Best Vitamin D32,000 IUNoneOlive oilSoftgel
Best for vegansNaturelo Vegan Vitamin D32,500 IUNoneCapsule
Best liquidThorne Vitamin D-3AdjustableNoneLiquid drops

What to Look for in a Vitamin D3 Supplement

There are dozens of D3 supplements on the market, and most of them look nearly identical on the label. A few distinctions actually matter.

Knowing what separates a well-designed formula from a commodity product makes it easier to evaluate any product you’re considering, including the ones not on this list.

D3, Not D2

Vitamin D comes in two supplemental forms. D2 (ergocalciferol) is derived from plants and found in many fortified foods. D3 (cholecalciferol) is the form your skin produces when exposed to sunlight. Studies consistently show that D3 raises and sustains blood levels of 25-hydroxyvitamin D, the main circulating form, more effectively than D2. For a supplement you’re taking specifically to improve your status, that distinction matters.

Whether K2 Is in the Formula

Vitamin D3 increases calcium absorption from the digestive tract. That’s the mechanism behind its bone health benefits. The issue is that pulling more calcium into circulation doesn’t automatically mean that calcium ends up in your bones.

Without vitamin K2, it can deposit in soft tissues and arterial walls instead. K2 activates two key proteins: osteocalcin, which binds calcium to bone tissue, and matrix Gla protein (MGP), which keeps calcium out of arteries. Think of them as calcium traffic controllers.

The most effective supplemental form of K2 is MK-7 (menaquinone-7), which stays active in the body for roughly 72 hours, compared to about 8 hours for MK-4. One daily dose of MK-7 provides consistent coverage throughout the day. If you’re taking a higher-dose D3 supplement without K2 in some form, it’s worth considering whether you’re getting the full bone benefit you’re aiming for.

Delivery Format and Fat Absorption

D3 is fat-soluble. Your intestines need dietary fat present to absorb it properly. Oil-based softgels, particularly those using coconut oil as a carrier, address this at the formulation level rather than relying on you to always take it with a fatty meal.

Dry tablets and capsules without an oil base have a meaningful absorption disadvantage. Liquid drops offer a different benefit: precise, flexible dosing. If you’re working with a clinician to reach a specific blood level, drops make it straightforward to titrate.

The Best Vitamin D3 Supplements for Every Need

Here’s what each pick does well and who it’s best suited for.

Best With K2: Jinfiniti Vitamin D3 + K2

Best With K2: Jinfiniti Vitamin D3 + K2

Best for: Adults supplementing for bone health, cardiovascular protection, or immune support who want a complete formula without managing multiple pills.

Jinfiniti Vitamin D3 + K2 delivers 5,000 IU of D3 alongside 100mcg of K2 as MK-7, suspended in a coconut oil base. It’s the only product on this list designed within a broader precision medicine ecosystem that includes biomarker testing to measure whether your levels actually respond.

The dose is appropriate for most adults addressing deficiency or maintaining optimal levels. The MK-7 form means one softgel per day provides a sustained active window, unlike MK-4 formulas that require multiple doses to maintain coverage throughout the day. The coconut oil carrier addresses the fat-soluble absorption issue at the formulation level.

The distinction worth flagging: most D3+K2 products use MK-4 because it’s less expensive to source. MK-7 has a substantially longer half-life. If your formula doesn’t specify which form of K2 it contains, it’s likely MK-4.

Available from: Jinfiniti

Best Softgel Without K2: Doctor’s Best Vitamin D3

Best Softgel Without K2: Doctor's Best Vitamin D3

Best for: People maintaining adequate levels who already have K2 covered and prefer a standalone D3 at a moderate dose.

Doctor’s Best Vitamin D3 (2,000 IU / 50mcg) is a clean, widely third-party tested softgel for people who get K2 through dietary sources (fermented foods, natto, aged cheeses) or a separate supplement, and prefer a standalone, lower-dose D3 option.

At 2,000 IU, it’s appropriate for maintenance supplementation in adults without severe deficiency who eat a diet with reasonable K2 exposure. One of the better value-per-dose options in this category.

Available from: Doctor’s Best

Best for Vegans: Naturelo Vegan Vitamin D3

Best for Vegans: Naturelo Vegan Vitamin D3

Best for: Vegans and fully plant-based eaters who want D3 without animal-derived ingredients.

Standard D3 supplements are derived from lanolin, a wax extracted from sheep’s wool. Most people don’t think much about this, but for vegans it matters. Naturelo’s Vegan Vitamin D3 uses cholecalciferol sourced from lichen, a plant-based source that produces the same D3 molecule your skin synthesizes from sunlight.

At 2,500 IU, it’s a solid maintenance or mild correction dose for adults without severe deficiency. Lichen-derived D3 has the same bioavailability as lanolin-derived D3, which makes this a genuine equivalent rather than a compromise.

Available from: Naturelo

Best Liquid Form: Thorne Vitamin D-3

Best Liquid Form: Thorne Vitamin D-3

Best for: People who prefer not to swallow capsules, those titrating dose under clinical guidance, or anyone prioritizing NSF Sport certification.

Thorne’s Vitamin D-3 drops are NSF Certified for Sport, meaning they’ve been independently tested for label accuracy, purity, and the absence of banned substances. The liquid format allows precise, incremental dose adjustments.

That’s particularly useful when working with a clinician to bring deficient levels into range. You might start at a higher corrective dose for several weeks, then step down to a maintenance level. Fixed-dose capsules don’t accommodate that easily. Drops do.

Available from: Thorne

Dosing D3 and Why Testing Changes the Equation

The standard recommended daily intake for vitamin D is 600 to 800 IU, with most regulatory bodies setting a tolerable upper limit around 4,000 IU. But individual needs vary considerably based on starting levels, sun exposure, body composition, and how well a particular person absorbs fat-soluble nutrients.

Someone with severely deficient levels may need 5,000 IU or more per day to reach the sufficient range. Someone already in range may maintain on much less. The dose that’s right for you is not something a label can tell you.

As Dr. Jin-Xiong She, founder of Jinfiniti Precision Medicine, explains: “Vitamin D is one of the most consistently deficient micronutrients we see across patient populations. But the important question isn’t just whether you’re deficient. It’s whether your supplement is actually closing that gap. A blood test tells you both, and it’s the only way to dose with any real precision.”

If you’ve been dealing with fatigue that doesn’t respond to obvious fixes, vitamin D status is one of the first micronutrients worth checking. It’s also worth knowing that D3 doesn’t work in isolation. Magnesium is required to convert vitamin D to its active form, and low magnesium can blunt the effect of D3 supplementation even when doses are adequate.

Standard vitamin D blood tests measure serum 25-hydroxyvitamin D (25(OH)D), the main circulating storage form. Most clinicians consider 30 ng/mL the lower threshold of sufficiency. Many longevity-focused researchers suggest optimal function sits closer to 40 to 60 ng/mL. Testing before you start and again after 8 to 12 weeks of supplementation is the straightforward way to find out where you land.

Frequently Asked Questions

What is the best form of vitamin D3?

D3 (cholecalciferol) is the most bioavailable supplemental form of vitamin D and consistently outperforms D2 in raising and maintaining blood levels. Within D3 supplements, oil-based delivery (such as softgels with a coconut oil carrier) improves absorption compared to dry tablet or capsule forms.

Do I need K2 with vitamin D3?

It depends on your dose and diet. At 2,000 IU and above, pairing D3 with K2 (as MK-7) helps ensure that the calcium D3 mobilizes gets directed to bone tissue rather than soft tissue and arterial walls. If your D3 supplement doesn’t include K2, look for it in fermented foods like natto or consider a separate K2 supplement. If you eat very few fermented foods, a combined D3+K2 formula is the more reliable approach.

Can I take too much vitamin D3?

Yes, though toxicity requires sustained supplementation at very high doses, generally well above 10,000 IU daily over extended periods. Symptoms of excess include elevated blood calcium, nausea, and kidney stress. Testing your blood levels is the most reliable way to stay in the sufficient range without overdoing it.

What’s the difference between MK-4 and MK-7?

Both are forms of vitamin K2, but their activity windows differ significantly. MK-4 has a half-life of roughly 6 to 8 hours, which means multiple daily doses are needed for sustained effect. MK-7 remains active for approximately 72 hours, making once-daily dosing genuinely effective. Most clinical research supporting K2 for bone and cardiovascular health uses the MK-7 form.

How do I know if my vitamin D3 supplement is working?

Test. A serum 25-hydroxyvitamin D test measures your current blood level and, when repeated after 8 to 12 weeks of supplementation, confirms whether your dose is having the intended effect. Without that feedback, you’re making decisions based on what the label says rather than what your body is actually doing.

Image of a senescent 'zombie cell'

‘Zombie Cells’ Are Quietly Aging You Faster

What You Should Know

  • Zombie cells are aging cells that stop dividing but don’t die, continuously releasing inflammatory compounds that damage the tissue around them.
  • They accumulate naturally with age because the immune system becomes less efficient at clearing them over time.
  • Not all zombie cells are harmful; some serve short-term repair roles, but chronic buildup is linked to a range of age-related conditions.
  • Fisetin and quercetin are the best-studied natural compounds for targeting zombie cells, with early human trial data supporting their use.

Right now, somewhere in your body, there are cells that have stopped working but haven’t died. They’ve dropped out of the cell cycle completely, sitting inert in your tissues while continuously leaking toxic signals into everything around them.

Scientists call them senescent cells. Most people call them zombie cells. And the older you get, the more of them you collect.

What makes this worth understanding is that the process runs silently, with no obvious symptoms, for years before it shows up as something recognizable. The good news is that this mechanism is well understood, and the science of addressing it has moved faster than most people realize.

Fisetin + Quercetin Complex

Target senescent cells naturally.

Jinfiniti SenoAid mockup with gradient background

What Are Zombie Cells?

In a healthy cell cycle, cells divide, wear out, and eventually self-destruct through a process called apoptosis, the body’s built-in cleanup mechanism. Old cells die. New cells replace them. The system works.

Zombie cells skip the last step. They stop dividing, but they don’t die. Instead, they enter a kind of permanent standby mode and start releasing a steady stream of inflammatory proteins and enzymes. Researchers call this the senescence-associated secretory phenotype, or SASP. Think of it as a slow chemical leak that doesn’t stop.

One or two zombie cells aren’t a serious problem. The issue is accumulation: thousands or millions of them building up across your tissues over years, generating chronic low-grade inflammation that gradually impairs the cells and organs around them.

Healthy Aging CellZombie (Senescent) Cell
Divides normally?Yes, until worn outNo
Dies via apoptosis?YesNo, resists death
Releases inflammatory signals?MinimalYes, continuously
Cleared by immune system?Generally yesLess so, especially with age

Why They Pile Up With Age

When you’re young, your immune system is reasonably good at identifying and clearing senescent cells before they cause lasting problems. Short-term senescence actually serves a purpose — it plays a role in wound healing and in suppressing abnormal cell growth. The cells form, do their job, and get cleared out.

With age, that clearance becomes less efficient. Zombie cells start accumulating faster than your body removes them. Several things accelerate this process:

  • DNA damage from UV exposure, environmental toxins, or replication errors over time
  • Chronic oxidative stress from poor diet, inactivity, or prolonged illness
  • Ongoing low-grade inflammation, which itself triggers more cellular senescence, creating a feedback loop that compounds over time
  • Past illness or injury that left unresolved cellular damage behind

The result is a gradual accumulation that builds over decades, not weeks. By the time most people notice something is wrong — persistent fatigue, joint pain, slower recovery from illness — the buildup has been underway for years.

What Zombie Cells Are Linked To

Senescent cell accumulation doesn’t cause one specific disease. It appears to accelerate whatever your biology is already predisposed to. That’s part of what makes it hard to study and easy to miss.

The conditions consistently linked to high zombie cell burden include:

  • Alzheimer’s disease and cognitive decline
  • Osteoarthritis and chronic joint inflammation
  • Cardiovascular disease and arterial stiffness
  • Type 2 diabetes and insulin resistance
  • Pulmonary fibrosis (progressive lung tissue scarring)
  • Osteoporosis and bone loss
  • Muscle loss with aging (sarcopenia)
  • Chronic inflammatory conditions across multiple organ systems

The pattern is consistent across both animal models and early human research: zombie cells don’t cause disease from scratch. They speed up the diseases you were already heading toward.

Some Zombie Cells Actually Help Your Body Heal

The “destroy all zombie cells” narrative is an oversimplification — and a fairly important one to get right.

A 2022 study published in Science from UC San Francisco found that some senescent cells are embedded in healthy young tissue, particularly in the lungs, intestines, and skin, where they function as repair sentinels. When researchers used senolytic drugs to eliminate all senescent cells in these tissues, healing from injury actually slowed down.

This finding actually sharpens the case for addressing zombie cells. The research community’s approach is increasingly focused on intermittent, targeted interventions that reduce chronic accumulation rather than aggressively wiping out every senescent cell in the body. This is sometimes called “hit-and-run” dosing: brief senolytic treatment with rest periods in between.

The goal is burden reduction, not total elimination. That distinction matters if you’re considering any senolytic supplement or protocol.

Can You Measure Your Zombie Cell Burden?

There’s no simple test that directly counts your senescent cells. But that doesn’t mean you’re flying blind.

Senescence markers, the proteins zombie cells produce at elevated levels, can be measured as reliable indicators of cellular aging. One of the most established is beta-galactosidase (β-gal), an enzyme that accumulates in senescent cells and is used in research settings as a standard marker of cellular senescence. These markers are included in Jinfiniti’s AgingSOS Advanced Panel, alongside other biological aging biomarkers.

This is where biological age testing becomes practically useful. Chronological age tells you how many years you’ve lived. Biological age, tracked through markers like these, tells you more about how your cells are actually holding up. That gap is often where the clearest opportunities for intervention are.

The Natural Senolytics With the Most Evidence

A senolytic is any compound that selectively targets and promotes the death of senescent cells, by disabling the survival pathways those cells rely on to persist. Several pharmaceutical senolytics exist, including dasatinib, a cancer drug used in research settings. For most people exploring natural approaches, two compounds have the most evidence behind them.

They’re both plant-derived flavonoids, each studied specifically for senolytic activity. They work on different mechanisms, which is why research supports using them together rather than choosing one.

Fisetin

Among 10 flavonoids screened in a major study at the Mayo Clinic, fisetin ranked as the most potent natural senolytic. In aged mice, intermittent fisetin treatment reduced senescence markers across multiple tissues, restored tissue homeostasis, and extended both median and maximum lifespan. The effects persisted after fisetin cleared the body, consistent with how a hit-and-run mechanism works, rather than a drug effect that requires continuous presence.

Human tissue studies, using adipose (fat) tissue samples, showed fisetin reduced senescent cell burden in a cell-type-specific way, meaning it didn’t indiscriminately eliminate every senescent cell, only certain populations. That selectivity matters clinically.

Fisetin is found in small amounts in strawberries, apples, and onions. The doses used in research are significantly higher than what diet alone provides.

Quercetin

Quercetin was the first flavonoid identified as senolytic, and it has more human data behind it than any other natural compound in this category.

In a first-in-human pilot study published in EBioMedicine, three days of dasatinib plus quercetin (1000mg daily) significantly reduced senescent cell burden in fat tissue and skin within 11 days, with measurable drops in circulating SASP inflammatory markers. This was the first peer-reviewed evidence that senolytics can directly clear senescent cells in humans, not just in animal models.

Quercetin and fisetin target different types of senescent cells through different pathways. Combined, they cover a broader range than either one alone.

“Targeting cellular senescence is one of the eight root causes of biological aging we look at clinically,” says Dr. Jin-Xiong She, founder of Jinfiniti Precision Medicine. “Quercetin and fisetin have the strongest evidence among natural senolytic compounds, which is why combining them made sense as a formulation approach.”

What the Evidence Actually Says

The animal data is strong and has been replicated across multiple independent labs. The early human data, particularly from the dasatinib and quercetin trials, is genuinely promising. But most human trials are still small and pilot-stage, and large randomized controlled trials are ongoing. This is a young field.

A few practical things to understand:

  • Bioavailability varies. Fisetin has relatively low bioavailability in standard form. Compounds like bromelain and piperine can improve absorption, which is a real consideration in any senolytic formulation.
  • Dosing approach matters. The hit-and-run method appears more consistent with the research than continuous daily use. Most protocols use short dosing windows with periods off.
  • The safety profile is favorable. For the natural flavonoids, there is little evidence of adverse effects at the doses studied. This is distinct from pharmaceutical senolytics like dasatinib, which have well-documented side effects from their primary clinical use.

To summarize where the science stands: solid mechanism, encouraging early human evidence, good safety profile for natural senolytics, and an evidence base that’s still being built out. If you have underlying health conditions or take medications, talk with your clinician before starting any senolytic protocol.

Chronic low-grade inflammation and cellular senescence reinforce each other, so looking at both together gives a more complete picture of what’s driving cellular aging.

Frequently Asked Questions

What are zombie cells?

Zombie cells — or senescent cells — are aging cells that have stopped dividing and resist normal cell death. Instead of clearing out of the body, they stay in your tissues and continuously release inflammatory compounds that can impair surrounding healthy cells over time.

What causes zombie cells to accumulate?

They accumulate naturally with age as the immune system becomes less efficient at clearing them. DNA damage, chronic oxidative stress, ongoing low-grade inflammation, and past illness can all accelerate the process.

Can you get rid of zombie cells naturally?

Fisetin and quercetin are the best-studied natural compounds for reducing zombie cell burden. They are senolytics — compounds that selectively promote the death of senescent cells by disabling the survival pathways those cells depend on. Early human data and extensive animal research support their use. Large-scale human trials are ongoing.

What are senolytics?

Senolytics are compounds that selectively eliminate senescent cells. Unlike general anti-inflammatory agents, which suppress symptoms, senolytics target the cells themselves by exploiting their dependence on specific pro-survival pathways. Both pharmaceutical and natural senolytics exist.

Is fisetin or quercetin better for senescent cells?

Both are backed by solid evidence. Fisetin is the more potent natural senolytic in head-to-head flavonoid comparisons. Quercetin has more human trial data. Because they work on different mechanisms and target different types of senescent cells, the research supports using them together rather than choosing one over the other.

How do I know if zombie cells are a problem for me?

There is no direct consumer test that counts senescent cells. However, senescence markers like beta-galactosidase can be measured as part of a comprehensive biological aging panel. Jinfiniti’s AgingSOS Advanced Panel includes these markers alongside other cellular health indicators, giving a more complete picture of how your biology is actually aging.

  • Reyes, N. S., Krasilnikov, M., Allen, N. C., Lee, J. Y., Hyams, B., Zhou, M., Ravishankar, S., Cassandras, M., Wang, C., Khan, I., Matatia, P., Johmura, Y., Molofsky, A., Matthay, M., Nakanishi, M., Sheppard, D., Campisi, J., & Peng, T. (2022). Sentinel p16INK4a+ cells in the basement membrane form a reparative niche in the lung. Science, 378(6616), 192–201. https://doi.org/10.1126/science.abf3326
  • Yousefzadeh, M. J., Zhu, Y., McGowan, S. J., Angelini, L., Fuhrmann-Stroissnigg, H., Xu, M., Ling, Y. Y., Melos, K. I., Pirtskhalava, T., Inman, C. L., McGuckian, C., Wade, E. A., Kato, J. I., Grassi, D., Wentworth, M., Burd, C. E., Arriaga, E. A., Ladiges, W. L., Tchkonia, T., Kirkland, J. L., Robbins, P. D., & Niedernhofer, L. J. (2018). Fisetin is a senotherapeutic that extends health and lifespan. EBioMedicine, 36, 18–28. https://doi.org/10.1016/j.ebiom.2018.09.015
  • Hickson, L. J., Langhi Prata, L. G. P., Bobart, S. A., Evans, T. K., Giorgadze, N., Hashmi, S. K., Herrmann, S. M., Jensen, M. D., Jia, Q., Jordan, K. L., Kellogg, T. A., Khosla, S., Koerber, D. M., Lagnado, A. B., Lawson, D. K., LeBrasseur, N. K., Lerman, L. O., McDonald, K. M., McKenzie, T. J., Passos, J. F., Tchkonia, T., & Kirkland, J. L. (2019). Senolytics decrease senescent cells in humans: Preliminary report from a clinical trial of Dasatinib plus Quercetin in individuals with diabetic kidney disease. EBioMedicine, 47, 446–456. https://doi.org/10.1016/j.ebiom.2019.08.069

Account Access

Welcome back

Continue your health journey with a secure login.