

Secure • Private • Science-backed
A top-down view of foods that increase ferritin levels

How to Increase Ferritin Quickly: 7 Evidence-Based Strategies

You’re exhausted. Your hair is thinning. You can’t get through a workout without hitting a wall. Standard bloodwork comes back normal, your doctor says everything looks fine, and you leave with no answers and the same symptoms.

That story is common enough to have a clinical name: iron deficiency without anemia. And the marker your labs probably didn’t highlight is ferritin.

Ferritin is the protein your body uses to store iron inside cells. When stores run low, your body starts pulling from that reserve to keep hemoglobin production going, which means ferritin drops first, often months or years before your red blood cell count shows anything unusual. By the time anemia appears on a standard CBC, iron depletion has usually been affecting cellular function for a while.

If your ferritin is low and you’re trying to raise it, the process takes longer than most people expect, but the steps are specific and actionable. This article covers what the research actually shows.

What You Should Know

  • Ferritin is your body’s iron reserve protein, and it drops before anemia develops, which means you can have real symptoms with “normal” bloodwork.
  • The fastest reliable way to raise ferritin involves combining dietary iron, absorption enhancers, and removing blockers, not just taking more iron.
  • Iron deficiency disrupts mitochondrial function and energy production even before hemoglobin falls, which is why fatigue is often the first sign and why a normal hemoglobin reading can still miss the problem.
  • Most people who are actively replenishing ferritin see measurable increases within 8–12 weeks; consistent monitoring is the only way to know if what you’re doing is working.

What Ferritin Does in Your Body

Ferritin does more than hold iron in reserve. It’s part of how your body regulates the entire iron economy.

Here’s how the system works: iron circulates in your blood bound to a carrier protein called transferrin. When cells need iron, they pull it from transferrin. When supply exceeds immediate demand, the excess is packed into ferritin for storage. When demand exceeds what’s circulating, the body draws down ferritin reserves.

The problem is that ferritin isn’t just a storage depot. Iron stored in ferritin is also required by the mitochondria. Iron is a cofactor for three of the four enzyme complexes in the mitochondrial electron transport chain, the system that converts oxygen and nutrients into ATP, the molecule your cells use for energy. A 2017 clinical review found that iron deficiency can profoundly disturb mitochondrial function, disrupting the biosynthesis of hemoglobin, myoglobin, and cytochromes. Translation: even before you’re technically anemic, low ferritin can mean your cells are generating less ATP than they should, and that’s why the fatigue from low ferritin often feels deeper than ordinary tiredness.

Iron is also required for DNA replication and immune cell function. Low ferritin touches more systems than most people realize.

Why Standard Lab Reference Ranges Miss the Problem

The conventional lower threshold for ferritin varies by lab, but it often sits around 12–15 ng/mL for adults. Many functional medicine providers target 50–100 ng/mL or higher, particularly for women with fatigue or hair loss. That gap matters because you can have measurable mitochondrial energy deficits and significant hair shedding at levels that conventional panels mark as “normal.”

Hair follicles are among the most metabolically active structures in the body, and they’re among the first to be rationed when iron stores fall below a functional threshold. A 2022 observational study in Dermatology Practical & Conceptual of 250 women with telogen effluvium (the clinical term for diffuse stress-related hair shedding) found that ferritin levels were significantly lower in those patients compared to healthy controls. Hair loss associated with iron deficiency often begins before ferritin drops into the flagged “deficient” range.

Take this as a reason to test specifically for ferritin, not just hemoglobin, rather than a reason to self-treat without data.

The 7 Strategies for Raising Ferritin Quickly

Raising ferritin requires the right combination of inputs and a consistent approach. No single change gets you there on its own.

Prioritize Heme Iron Sources

Dietary iron comes in two forms: heme and non-heme. Heme iron is found only in animal protein and is significantly more bioavailable. A foundational analysis in the American Journal of Clinical Nutrition modeling iron absorption from 24 complete meals found that the type and source of dietary iron explained the largest portion of variability in absorption, with heme iron consistently outperforming plant sources across conditions.

The best dietary sources of heme iron:

  • Beef liver (approximately 6–7 mg per 3 oz serving)
  • Oysters and clams (among the highest iron-per-serving seafood)
  • Lean red meat: beef, lamb, venison
  • Dark poultry: legs and thighs over breast
  • Tuna and other dark-fleshed fish

For vegetarians and vegans, plant sources of iron (lentils, beans, tofu, fortified grains, dark leafy greens) are important, but the absorption rate from non-heme sources is lower. Pairing them with vitamin C consistently improves the yield.

Use Vitamin C at the Right Time

Vitamin C enhances the conversion of non-heme iron into a form the intestine can absorb more readily. The benefit applies specifically to non-heme iron and is most relevant for people relying heavily on plant-based sources.

That said, a well-designed 2020 randomized clinical trial published in JAMA Network Open compared iron supplementation plus 200 mg of vitamin C against iron supplementation alone in 440 patients with iron deficiency anemia. At the 8-week mark, ferritin increased by 35.75 ng/mL in the vitamin C group versus 34.48 ng/mL in the iron-only group, not a statistically significant difference. In patients already taking supplemental iron in an adequate dose, the additional vitamin C didn’t change the outcome.

The practical takeaway: vitamin C matters most when you’re relying on food sources and non-heme iron. It’s less critical as an add-on to a properly dosed iron supplement. Talk with your clinician about whether adding vitamin C to your iron supplement makes sense for your specific situation.

Remove the Absorption Blockers

Some common foods and drinks significantly reduce iron absorption when consumed alongside iron-rich meals or supplements. The same model that quantified absorption from dietary sources also documented how much individual factors could lower it.

  • Tea and coffee: polyphenols in both bind to iron and reduce absorption substantially. The effect is dose-dependent and occurs even with moderate consumption around meals.
  • Calcium: a glass of milk or calcium supplement taken with an iron-rich meal can measurably reduce absorption.
  • Phytates: found in unsoaked legumes, whole grains, and seeds. Soaking or fermenting these foods reduces the phytate content and improves iron yield.
  • Excess fiber taken immediately with iron.

The fix is timing. Iron-rich meals and iron supplements work best taken separately from coffee, tea, and high-calcium foods, ideally by at least an hour on either side. You don’t need to eliminate these foods; you need to create a window.

Consider Taking Supplements on Alternate Days

This one surprises most people. Research into iron absorption regulation has found that after the intestine absorbs a dose of iron, it temporarily increases production of hepcidin, a hormone that signals the gut to absorb less iron. Translation: taking iron daily can cause the body to absorb each subsequent dose less efficiently than if you spaced doses out.

A meta-analysis of 129 randomized controlled trials of iron supplementation in children, published in BMJ Global Health, found that intermittent (1–2 times per week) and frequent (3–7 times per week) regimens were similarly effective at reducing iron deficiency anemia, though ferritin levels increased more with higher-frequency supplementation. Talk with your clinician about what dosing interval is appropriate for your specific situation — but every-other-day is worth asking about if you’re experiencing GI side effects from daily iron.

Choose the Right Form of Iron Supplement

Not all oral iron supplements are the same. The most common prescription form is ferrous sulfate, which is effective but can cause significant GI side effects (constipation, nausea, stomach cramping) that lead people to stop taking it.

Alternative forms include:

  • Iron bisglycinate (glycinate chelate): generally better tolerated than ferrous sulfate, with comparable absorption in most people
  • Ferric maltol: a newer formulation with good evidence in IBD patients where absorption is compromised
  • Heme iron (from liver concentrate): bypasses the hepcidin-regulated pathway entirely, which may offer absorption advantages, particularly for people with gut issues

If you’ve tried and stopped iron supplements because of side effects, the issue may be the form rather than the supplement category. Talk with your clinician about switching formulations before concluding that oral supplementation doesn’t work for you.

Address Underlying Root Causes

This is the step most ferritin articles skip entirely.

Ferritin doesn’t stay low without a reason. The most common root causes include:

  • Heavy menstrual bleeding: the single most common driver in premenopausal women, and often underestimated. Monthly blood loss can outpace dietary and supplemental iron intake, particularly if periods are heavy or prolonged.
  • Poor gut absorption: conditions including celiac disease, Crohn’s disease, SIBO, and low stomach acid all reduce the amount of iron your intestine can take up. Taking more iron doesn’t resolve the problem if absorption is impaired.
  • Chronic inflammation: ferritin is an acute-phase reactant, meaning it rises in response to inflammation. This can make ferritin levels harder to interpret: someone can have elevated ferritin and still be functionally iron-deficient if chronic inflammatory signaling is sequestering iron inside cells. Context and additional markers matter.
  • Insufficient dietary intake: common in vegetarian and vegan diets, during pregnancy, and in endurance athletes whose demand exceeds typical dietary supply.

“Low ferritin is almost always the downstream sign of something specific,” says Dr. Jin-Xiong She, founder of Jinfiniti Precision Medicine. “Identifying whether the problem is supply, absorption, or blood loss determines which intervention actually moves ferritin in the right direction. Supplementing without that answer often produces slow or inconsistent results.”

If you’ve been supplementing for more than 8–12 weeks with limited progress, the root cause investigation is the next step, not a higher dose.

Track It, Don’t Guess

Ferritin responds slowly. Unlike some markers that shift in days or weeks, rebuilding iron stores takes time, typically 3 to 6 months of consistent supplementation before ferritin returns to a functional range from a significantly depleted starting point.

That timeline makes retesting essential. A meta-analysis of 21 randomized controlled trials in adults with non-anaemic iron deficiency found that IV iron (the fastest intervention available) improved physical function and fatigue compared to placebo, with ferritin rising by an average of 245 µg/L. Oral iron works slower but remains effective for most people when combined with the strategies above. The only way to know whether it’s working for you, and at what dose, is to retest at 8–12 weeks.

The AgingSOS® at-home health panels from Jinfiniti include comprehensive biomarker assessment, giving you a full picture of iron status alongside inflammation markers, micronutrient levels, and other factors that influence how your ferritin actually responds to intervention.

What About IV Iron?

For people with severely depleted stores, a significant absorption problem, or a condition like heart failure or chronic kidney disease where oral supplementation isn’t viable, intravenous iron is an option. A randomized controlled trial comparing IV iron against oral iron in pregnant women with IDA found that IV iron significantly reduced rates of anemia at delivery compared to oral supplementation, though both approaches have appropriate contexts.

IV iron is not a shortcut for otherwise healthy people with mild-to-moderate ferritin deficiency. It carries its own risks, requires clinical monitoring, and the evidence for its use in non-anemic populations, while growing, is still rated “low” quality by systematic review standards. For most people, the combination of dietary optimization, the right supplement form, and consistent dosing over several months produces results that don’t require an infusion.

Frequently Asked Questions

How quickly can you raise ferritin levels?

With consistent oral supplementation and dietary changes, most people see measurable ferritin increases within 4–8 weeks. Returning to a functional range from a significantly depleted starting point typically takes 3–6 months. The timeline depends on how low you’re starting from, your root cause, how well you absorb iron, and whether you’re actively losing it through bleeding or a gut condition.

What ferritin level should I be targeting?

Conventional lab reference ranges mark levels as low as 12 ng/mL as “normal” for women, but many clinicians working in functional or integrative medicine target 50–100 ng/mL as an optimal range for women, particularly those with fatigue or hair loss. There is no single universally agreed threshold. Talk with your clinician about what target makes sense given your symptoms and overall health picture.

Should I take iron supplements every day or every other day?

Either can be appropriate depending on your starting level, your GI tolerance, and the form of iron you’re taking. Some research suggests that alternate-day dosing can maintain absorption efficiency because it allows hepcidin levels to return to baseline between doses. Talk with your clinician about which schedule fits your situation.

What foods should I avoid when trying to increase ferritin?

Avoid consuming tea, coffee, and high-calcium foods within an hour of an iron-rich meal or an iron supplement. You don’t need to eliminate these from your diet; the timing window is the key variable.

Can I test my ferritin at home?

Not via a finger-prick test, but comprehensive at-home biomarker panels are available. For a complete picture of what’s driving low ferritin and how your iron status connects to other markers like inflammation, the AgingSOS® panels are worth exploring.

What does low ferritin feel like?

The most common presentation includes persistent fatigue that doesn’t fully resolve with sleep, reduced exercise tolerance, difficulty concentrating or brain fog, increased hair shedding, brittle nails, cold hands and feet, and restless legs, particularly at night. These symptoms often appear before ferritin drops into the flagged “deficient” range on standard labs, which is why testing specifically for ferritin matters.

🧬 Related Reading

References

  1. Musallam KM, Taher AT. Iron deficiency beyond erythropoiesis: should we be concerned? Curr Med Res Opin. 2018;34(1):81–93. doi:10.1080/03007995.2017.1394833
  2. İbiş S, Aksoy Saraç G, Akdağ T. Evaluation of MCV/RDW Ratio and Correlations With Ferritin in Telogen Effluvium Patients. Dermatol Pract Concept. 2022;12(3):e2022151. doi:10.5826/dpc.1203a151
  3. Li N, Zhao G, Wu W, et al. The Efficacy and Safety of Vitamin C for Iron Supplementation in Adult Patients With Iron Deficiency Anemia: A Randomized Clinical Trial. JAMA Netw Open. 2020;3(11):e2023644. doi:10.1001/jamanetworkopen.2020.23644
  4. Hallberg L, Hulthén L. Prediction of dietary iron absorption: an algorithm for calculating absorption and bioavailability of dietary iron. Am J Clin Nutr. 2000;71(5):1147–60. doi:10.1093/ajcn/71.5.1147
  5. Andersen CT, Marsden DM, Duggan CP, et al. Oral iron supplementation and anaemia in children according to schedule, duration, dose and cosupplementation: a systematic review and meta-analysis of 129 randomised trials. BMJ Glob Health. 2023;8(2). doi:10.1136/bmjgh-2022-010745
  6. Dugan C, Cabolis K, Miles LF, Richards T. Systematic review and meta-analysis of intravenous iron therapy for adults with non-anaemic iron deficiency: An abridged Cochrane review. J Cachexia Sarcopenia Muscle. 2022;13(6):2637–2649. doi:10.1002/jcsm.13114
  7. Lewkowitz AK, Stout MJ, Cooke E, et al. Intravenous versus Oral Iron for Iron-Deficiency Anemia in Pregnancy (IVIDA): A Randomized Controlled Trial. Am J Perinatol. 2021;39(8):808–815. doi:10.1055/s-0041-1740003
Hematocrit blood platelets image

How to Increase Low Hematocrit Levels Naturally

What You Should Know

  • To raise hematocrit naturally, start by identifying the cause: iron and B12 if deficiency is confirmed, aerobic exercise and adequate sleep for ongoing support, and inflammation reduction when that’s the driver.
  • Normal hematocrit is approximately 41–50% for men and 36–44% for women; levels consistently below this range with symptoms warrant investigation.
  • Low hematocrit has two distinct root causes (nutrient deficiency and chronic inflammation) requiring different interventions, and the standard dietary advice only applies to one of them.
  • Standard blood tests show that hematocrit is low but often don’t reveal which mechanism is responsible; that distinction is what determines which approach will work.

To raise low hematocrit levels naturally, the approach depends on the root cause. Iron, B12, and folate-rich foods are effective when deficiency is confirmed. Aerobic exercise, consistent sleep, and stress reduction support red blood cell production over time. When chronic inflammation is the underlying driver, those dietary strategies often fall short, and reducing the inflammatory burden is what’s actually needed.

That last scenario is where most advice on this topic stops short. A low hematocrit number tells you that red blood cell production has fallen short. It doesn’t tell you why. The “why” determines what works.

CLIA-Certified Blood Panel

Find out what’s actually behind your low hematocrit.

Jinfiniti AgingSOS green gradient background

What is Hematocrit and Why Does it Matter?

Hematocrit is the percentage of your total blood volume made up of red blood cells. A reading of 42% means 42 out of every 100 units of blood are red blood cells; the rest is plasma, white blood cells, and platelets.

Red blood cells carry hemoglobin, the iron-rich protein that binds to oxygen in the lungs and delivers it to tissues throughout the body. When hematocrit falls, oxygen delivery falls with it. Less oxygen reaching your cells means less ATP, the molecule your cells use for fuel. Translation: less energy available for everything from muscle contraction to clear thinking.

Low hematocrit is fundamentally an oxygen delivery problem, and the fatigue, mental fog, and breathlessness that follow are the same mechanism expressing itself across different systems.

What Are Normal Hematocrit Levels?

The Cleveland Clinic reports that normal hematocrit is approximately 41–50% for men and 36–44% for women, though reference ranges vary by lab. Pregnancy, altitude, hydration status, and age all influence where an individual’s numbers naturally land.

Common symptoms of low hematocrit include:

  • Persistent fatigue that doesn’t improve with rest
  • Shortness of breath during activity that wouldn’t normally cause it
  • Brain fog or difficulty concentrating
  • Pale skin, cold hands and feet
  • Rapid or irregular heartbeat
  • Dizziness or lightheadedness

Mildly low readings don’t always indicate a serious problem. But levels consistently below the normal range, especially when paired with symptoms, warrant investigation rather than monitoring alone.

High hematocrit (generally above 55% in adults) also carries risks. Thicker blood increases cardiovascular strain and clotting risk. Causes range from dehydration to polycythemia vera. If you are tracking your levels over time, both directions matter.

Why Is Your Hematocrit Low?

Most advice on raising hematocrit treats it as a single problem with a single solution: add iron, add B12, eat better. The clinical reality is more specific than that.

Low hematocrit has two meaningfully different causes. Identifying which one applies changes everything about how to address it.

When the Problem Is a Nutrient Shortage

The body needs specific raw materials to produce healthy red blood cells: iron, vitamin B12, folate, and copper, among others. When any of these is deficient, erythropoiesis (red blood cell production) slows. Iron deficiency is the most common cause of anemia worldwide. B12 and folate deficiency produce a different pattern: large, structurally abnormal red blood cells that can’t carry oxygen effectively.

In these cases, the standard dietary and supplementation guidance works because it addresses the actual problem.

When the Problem Is Chronic Inflammation

This is where most advice falls short. Anemia of inflammation, also called anemia of chronic disease, is estimated to be the second most common form of anemia worldwide, yet it receives almost no coverage in consumer health content.

The mechanism differs from nutrient deficiency in a meaningful way. In anemia of inflammation, inflammatory cytokines (signaling proteins produced during chronic low-grade inflammation) actively suppress red blood cell production in the bone marrow. They also trigger the release of hepcidin, a peptide hormone that sequesters iron in storage cells, making it unavailable for erythropoiesis even when iron stores are adequate.

In this scenario, iron supplementation doesn’t help because iron availability isn’t the problem. The body has iron. Inflammatory signaling is preventing it from being used.

Research published in Advances in Hematology describes how anemia of inflammation involves impaired erythropoietin production, blunted bone marrow responsiveness to erythropoietin, and impaired iron metabolism driven by inflammatory cytokines. The underlying triggers include chronic infections, autoimmune conditions, kidney disease, and persistent low-grade inflammation that doesn’t always produce obvious outward symptoms.

This is why some people follow all the correct dietary advice and see little improvement: the barrier to higher hematocrit isn’t what they’re supplementing for. If inflammation is the root cause, reducing it is the intervention, not adding more iron. Understanding which supplements have evidence behind them for chronic inflammation is a useful next step for anyone in this pattern.

How to Increase Low Hematocrit Levels Naturally: The Nutrient Approach

If deficiency is the confirmed cause of low hematocrit, the nutrient-based approach is well-supported by evidence. These interventions work when they’re targeting the right problem.

Iron: Effective When Deficiency Is Confirmed

Dietary iron comes in two forms. Heme iron, found in animal products like red meat, poultry, and seafood, absorbs at rates of roughly 15–35%. Non-heme iron, found in plant sources like lentils, spinach, and fortified grains, absorbs at 2–20% depending on what else is consumed alongside it.

A few practical points on optimizing iron absorption:

  • Vitamin C significantly increases non-heme iron absorption. Combining citrus with plant-based iron sources (lemon juice on a spinach salad, orange juice with fortified cereal) makes a measurable difference.
  • Tannins in tea and coffee, calcium in dairy, and phytates in whole grains reduce iron absorption when consumed at the same meal.
  • Cooking in cast iron transfers small amounts of dietary iron to food, particularly with acidic ingredients like tomato-based dishes.

One important caveat: do not supplement with iron without first confirming deficiency through testing, specifically ferritin and serum iron, not hematocrit alone. Iron supplementation in someone who doesn’t need it promotes oxidative stress and may worsen conditions where inflammation is already elevated. Work with your clinician before adding iron supplements.

Vitamin B12 and Folate

Both are required for normal red blood cell maturation. Deficiency of either produces megaloblastic anemia, a pattern where red blood cells are abnormally large and structurally unable to carry oxygen effectively.

B12 is found almost exclusively in animal products: meat, fish, eggs, and dairy. Vegans and vegetarians are at meaningfully higher risk of deficiency. Folate is more widely distributed in leafy greens, legumes, and fortified foods, but malabsorption, certain medications, and genetic variants affecting folate metabolism (particularly MTHFR variants) can produce inadequate levels even with sufficient dietary intake.

If your hematocrit is low and B12 or folate status hasn’t been tested, it should be. Understanding your actual folate levels matters. High folate on a blood test isn’t always straightforward to interpret, and context changes what the number means.

Hydration and What It Does to Your Reading

Hematocrit is a ratio, not an absolute cell count. Dehydration concentrates blood plasma, making the red blood cell ratio appear higher than it is. Overhydration has the opposite effect: a temporary dilutional drop in the reading with no actual change in red blood cell count.

If you are tracking hematocrit over time, consistent hydration in the 24 hours before a blood draw produces more reliable data points for comparison.

What Lifestyle Changes Raise Hematocrit Naturally?

Diet addresses supply. These factors support the conditions under which the body produces and maintains healthy red blood cell levels over time.

Aerobic Exercise

Moderate, regular aerobic training stimulates erythropoietin (EPO) production, the kidney-produced hormone that signals bone marrow to generate more red blood cells. A narrative review in Frontiers in Physiology documents this erythropoietic response as a well-established adaptation to sustained endurance training.

The effect is dose-dependent. Three to five moderate-intensity aerobic sessions per week supports healthy erythropoiesis over time. Very intense training without adequate recovery can temporarily lower hematocrit through plasma volume expansion, a known pattern in endurance athletes sometimes called dilutional pseudoanemia. Consistency at a sustainable intensity is more effective than occasional high-output sessions.

Sleep and Stress Reduction

Chronic stress elevates cortisol and promotes the release of pro-inflammatory cytokines. This connects directly to the anemia of inflammation pathway described above. Stress sustained over weeks or months can meaningfully suppress erythropoiesis through the same inflammatory mechanisms. Sleep is also when the body performs significant cellular repair, including in the bone marrow where red blood cells originate.

For people whose energy hasn’t improved despite dietary changes, fatigue that persists even when standard blood tests look normal often has sleep and chronic stress as overlooked contributors, and both are measurably addressable.

Why Isn’t Your Hematocrit Responding to Diet Changes?

If your hematocrit has been consistently low despite adequate iron, B12, and folate intake, the root cause almost certainly lies elsewhere.

Chronic inflammation is the most clinically significant alternative explanation, and it’s one a standard CBC does not reveal. A complete blood count tells you that hematocrit is low. It does not measure inflammatory cytokines, oxidative stress markers, or the biological patterns that drive anemia of inflammation.

“When hematocrit doesn’t respond to the expected interventions, that’s a signal to look upstream,” says Dr. Jin-Xiong She, founder of Jinfiniti Precision Medicine. “At the inflammatory environment, at nutrient absorption, at the full biological picture, not just a single number. Treating a number without understanding its cause is how people spend months supplementing things they don’t need.”

The same hematocrit reading (say, 34%) can reflect iron deficiency anemia, B12 deficiency, chronic kidney disease, or anemia of inflammation. Each requires a meaningfully different response. The intervention that fixes one can be ineffective or actively counterproductive in another.

For women, hematocrit also fluctuates across the menstrual cycle, and blood loss from heavy periods is one of the most common and undertreated contributors to chronically low levels. Understanding how your menstrual cycle affects blood test results is worth doing before drawing conclusions from any single data point.

A broader biomarker panel, one that includes inflammatory cytokines, oxidative stress markers, and micronutrient status, produces the picture that allows for precise intervention rather than repeated guesswork.

Frequently Asked Questions

What is a dangerously low hematocrit level?

Most clinicians consider a hematocrit below 30% in adults to be clinically significant and a threshold that warrants prompt medical evaluation. Levels this low indicate severely reduced oxygen-carrying capacity and may require intervention beyond dietary changes. Symptoms like severe shortness of breath, chest pain, or fainting require immediate medical attention regardless of where your specific numbers fall.

How quickly can hematocrit levels increase naturally?

It depends on the cause. When iron deficiency is treated with supplementation, hematocrit typically begins improving within two to three weeks, with full recovery taking three to six months. B12 and folate deficiencies respond within a similar timeframe. Anemia of inflammation resolves more slowly, and only when the underlying inflammatory condition is adequately addressed. Testing before and after any intervention is the only reliable way to confirm whether the change is working.

Can dehydration cause low hematocrit?

Dehydration actually raises hematocrit, not lowers it. By reducing plasma volume, it concentrates the red blood cell ratio. Overhydration can temporarily lower the reading through dilution, without any actual change in red blood cell count. This is one reason consistent hydration before blood draws matters for accurate tracking over time.

What is anemia of inflammation and how is it different from iron deficiency?

Iron deficiency anemia occurs when the body lacks enough iron to produce sufficient hemoglobin. Anemia of inflammation occurs when chronic inflammatory signaling disrupts red blood cell production even when iron stores are adequate. Hepcidin, released in response to inflammation, sequesters iron in storage cells and makes it unavailable for erythropoiesis. Iron supplementation does not address this mechanism. Treatment requires identifying and reducing the underlying inflammatory burden.

Should I take iron supplements if my hematocrit is low?

Only if iron deficiency has been confirmed through testing, specifically ferritin and serum iron levels. Taking iron without a confirmed deficiency is not a neutral intervention. Excess iron can promote oxidative stress and may worsen conditions where inflammation is already a factor. Always work with your clinician before starting iron supplementation.

  • Ganz, T., & Nemeth, E. (2014). Anemia of inflammation. PLOS Medicine, 11(4). https://pmc.ncbi.nlm.nih.gov/articles/PMC4115203/
  • Price, E. A., & Schrier, S. L. (2010). Unexplained aspects of anemia of inflammation. Advances in Hematology. https://doi.org/10.1155/2010/508739
  • Millet, G. P., et al. (2018). The effects of altitude training on erythropoietic response and hematological variables in adult athletes. Frontiers in Physiology. https://doi.org/10.3389/fphys.2018.00375
  • Lacourt, T. E., et al. (2018). The high costs of low-grade inflammation: Persistent fatigue as a consequence of reduced cellular-energy availability. Frontiers in Behavioral Neuroscience. https://doi.org/10.3389/fnbeh.2018.00078
  • Cleveland Clinic. (2024). Hematocrit test: What it is, levels, and high & low range. https://my.clevelandclinic.org/health/diagnostics/17683-hematocrit
  • MedlinePlus. (2024). Hematocrit test. https://medlineplus.gov/lab-tests/hematocrit-test/
High folate levels on a blood test

High Folate Levels: What Elevated Folate Means on a Blood Test

You got your blood results back. Folate is flagged — higher than the reference range. And now you’re not sure whether to worry about it, reduce your supplement intake, or just wait for your next appointment and hope someone explains it.

Here’s the honest answer: an elevated folate number, on its own, tells you very little. Whether it matters, and what to do about it, depends entirely on what else is happening in your bloodwork — particularly your B12 and homocysteine levels. Without those, you’re reading one sentence from the middle of a paragraph.

This article breaks down what high folate levels actually mean on a blood test, why the number is routinely misread, and what your next step should actually be.

What You Should Know

  • A folate level above 20 ng/mL is generally considered elevated, but this number alone isn’t enough to draw conclusions from.
  • The most common cause of high folate is taking multiple supplements that each contain folic acid, often without realizing they add up.
  • High folate can mask a vitamin B12 deficiency, allowing neurological damage to progress without the usual warning signs.
  • Folate, B12, and homocysteine need to be read together to understand what an elevated folate result actually means for you.

CLIA-Certified Blood Panel

Test folate, B12, and homocysteine in one panel.

Jinfiniti AgingSOS green gradient background

What High Folate Means on a Blood Test

Folate is the natural form of vitamin B9, found in leafy greens, legumes, and citrus. Folic acid is the synthetic version, added to supplements and — in the US and Canada — mandatorily to fortified grain products since 1998. Your body processes them differently, and that distinction becomes important when levels are elevated.

When a doctor orders a folate test, they’re usually measuring one of two things.

Serum Folate vs. RBC Folate: Why the Difference Matters

Serum folate measures the amount of folate circulating in the liquid portion of your blood. It reflects recent intake — what you’ve eaten and supplemented over the past few days. Have a spinach salad and a B-complex the morning before your blood draw, and your serum folate will likely read higher than it would on a typical day.

Red blood cell (RBC) folate is a different measurement. It reflects how much folate has been incorporated into your red blood cells over their lifespan, roughly 90 to 120 days. Think of it the way you’d think of HbA1c for blood sugar: a longer-term snapshot rather than a daily reading. RBC folate is generally considered the more meaningful indicator of true folate status, but it’s ordered less frequently.

Most flagged results that people see are serum folate. That context matters: serum folate can fluctuate meaningfully based on recent meals and supplements, which means a single elevated reading doesn’t necessarily represent your baseline.

What’s Considered a High Folate Level

Standard reference ranges vary by lab, but serum folate above 20 ng/mL is widely cited as elevated. Some labs use slightly different thresholds. The important caveat is that these ranges were designed primarily to identify deficiency, not to define an upper ceiling for optimal health. A number above range is a prompt to investigate further — not a standalone diagnosis.

Why Your Folate Levels Are High

There are several reasons folate can accumulate in the blood. Understanding which one applies to you changes what, if anything, should be done about it.

The underlying mechanism in most cases is the same: intake is exceeding the body’s ability to convert and clear it. But the reasons for that imbalance vary.

Supplement Stacking — The Most Common Culprit

The recommended daily allowance for most adults is 400 micrograms (mcg) of folate. The problem is that many people are unknowingly taking several times that amount.

A standard multivitamin might contain 400 to 800 mcg of folic acid. A separate B-complex often adds another 400 to 800 mcg. If someone is also taking a prenatal vitamin or a folate-specific supplement, the cumulative dose can reach 1,500 to 2,000 mcg or more per day — before any food is factored in.

This is the most common reason for elevated serum folate: not a single high-dose supplement, but several moderate-dose ones taken simultaneously without tracking the total.

Fortified Foods Add More Than Most People Realize

Mandatory folic acid fortification of enriched grain products has been in place in the US since 1998. Bread, pasta, rice, breakfast cereals, and flour all contain added folic acid. A 2002 study found that after fortification was introduced, nearly half of participants who had previously been below the daily folate requirement were no longer deficient — which illustrates how effective, and how pervasive, fortification has become.[1]

For someone who eats a typical North American diet and also takes a daily multivitamin, baseline folic acid intake from food alone is already substantial before supplementation is layered on.

MTHFR Variants: High Serum Folate, Low Functional Folate

This is the scenario most people don’t expect: it’s possible to have elevated serum folate and still be functionally folate-deficient at the cellular level.

The MTHFR gene produces an enzyme responsible for converting folic acid into its active, usable form (5-methyltetrahydrofolate, or 5-MTHF). Common variants of this gene — particularly C677T, which affects an estimated 10 to 15% of the general population and up to 25% of people of Hispanic ancestry — reduce that conversion capacity.[2]

When the conversion process is impaired or overwhelmed, folic acid accumulates in the blood as unmetabolized folic acid (UMFA). UMFA is the synthetic form that hasn’t been converted to a form the body can actually use. High serum folate in someone with an MTHFR variant may reflect this accumulation, not genuine folate sufficiency.

This is one reason why high serum folate can coexist with symptoms you’d typically associate with deficiency — and why the number alone doesn’t tell the whole story.

Kidney Disease and Reduced Clearance

Folate is water-soluble, meaning excess is normally excreted through urine. When kidney function is compromised, that clearance slows down, and folate accumulates.

Chronic kidney disease, and even mild reductions in kidney function, can contribute to elevated levels. If kidney disease is present or suspected, that context should inform how an elevated folate result is interpreted.

The B12 Problem: Why This Is the Number to Check First

Of all the risks associated with elevated folate, the most clinically significant — and the most frequently missed — is its potential to conceal a vitamin B12 deficiency.

This isn’t a theoretical concern. It’s been recognized for decades, and it’s the reason folate and B12 should almost always be tested together.

How High Folate Can Mask a B12 Deficiency

Folate and B12 work together to produce healthy red blood cells. When either is deficient, the result is megaloblastic anemia — larger, malformed cells that can’t carry oxygen effectively. Anemia is often the first signal that prompts a B12 deficiency diagnosis.

Here’s where elevated folate becomes a problem. A 2008 review published in the American Journal of Clinical Nutrition found that high folate intake can correct the anemia associated with B12 deficiency, eliminating the hematological warning sign while the underlying deficiency continues unchecked. What it cannot do is stop the neurological damage that B12 depletion causes over time.[3]

B12 is essential for maintaining the myelin sheath — the protective coating around nerve fibers. Its depletion causes progressive neurological damage: numbness and tingling in the extremities, balance problems, cognitive decline, and in severe cases, irreversible nerve injury. Because these symptoms develop gradually and subtly, a missed diagnosis can allow damage to accumulate for months or years.

There’s also a metabolic mechanism at play. When B12 levels are low, folate becomes “trapped” in a form the body cannot use (5-methyltetrahydrofolate), causing serum folate levels to rise further. This is sometimes called the methylfolate trap. The elevated folate reading is, in part, a consequence of the B12 problem — not evidence that folate status is adequate.

High Folate With Normal B12: What That Pattern Means

This is the combination that generates the most confusion, and it deserves a direct answer.

If your folate is elevated and your B12 comes back normal, that’s generally reassuring — but “normal” B12 on a standard serum test has meaningful limitations. Serum B12 can remain within range even when B12 is functionally insufficient at the cellular level.

One NHANES review found that among older adults, high folate combined with low B12 was associated with a substantially higher risk of cognitive impairment compared to people with adequate levels of both — even when B12 appeared borderline rather than overtly deficient.[4]

The functional markers that give a clearer picture are homocysteine and methylmalonic acid (MMA). Homocysteine rises when either folate or B12 is insufficient for normal metabolism. MMA rises specifically when B12 is functionally deficient. If both are within range alongside elevated folate, the risk profile is much lower. If homocysteine is elevated, further investigation is warranted regardless of what the standard B12 number shows.

Who Is Most at Risk

A few groups are more likely to face serious consequences from the high-folate-and-low-B12 pattern:

  • Older adults. B12 absorption declines with age as stomach acid production drops. Subclinical B12 deficiency is common before it becomes clinically apparent, and high folate is most likely to mask it in this group.
  • People with MTHFR variants. UMFA accumulation is more likely when the conversion enzyme is less active, and standard folate tests don’t distinguish between metabolized and unmetabolized forms.
  • People stacking multiple supplements. This is probably the largest at-risk category by sheer numbers — health-conscious people unknowingly exceeding safe folic acid intake by combining a multivitamin, a B-complex, and fortified foods without tracking the cumulative total.

Symptoms of High Folate: When They’re Actually From Something Else

One reason high folate often goes unaddressed is that it rarely causes obvious symptoms on its own. Most people with elevated serum folate feel no different.

The symptom burden associated with high folate is almost entirely indirect — the result of what high folate is hiding or enabling, rather than a direct effect of the folate itself.

What High Folate Itself Rarely Causes

In most cases, chronically elevated serum folate from supplementation does not produce noticeable symptoms. Folate is water-soluble, and excess is partially cleared through urine, which limits acute toxicity.

The NIH Office of Dietary Supplements notes that the tolerable upper intake level for folic acid from supplements is set at 1,000 mcg per day for adults — above that, concerns shift primarily to the B12 masking issue and potential effects on immune function, not acute side effects.

Symptoms That Point to the B12 Issue Underneath

If high folate is present alongside any of the following, the question isn’t whether folate is causing them directly — it’s whether high folate has been masking a B12 deficiency that’s been quietly progressing:

  • Persistent fatigue that doesn’t improve with rest
  • Tingling or numbness in the hands or feet
  • Difficulty with balance or coordination
  • Mood changes, irritability, or low motivation
  • Brain fog or difficulty concentrating

These are B12 neurological symptoms. And in people who have been supplementing with folic acid for a long time without also monitoring B12, that possibility deserves to be taken seriously. The trail of symptoms often feels like a separate problem — which is exactly what makes this combination easy to miss on standard bloodwork.

What to Do When Your Folate Is High

Elevated folate is a prompt to look more carefully, not a reason to panic or immediately stop everything you’re taking. The right response depends on context — specifically, what the rest of your biomarkers show.

The most useful thing you can do is resist the temptation to interpret a single number in isolation.

Test First: Folate Doesn’t Tell You Much Alone

“What we see consistently is that people fixate on a single elevated marker and miss the pattern that surrounds it,” says Dr. Jin-Xiong She, founder of Jinfiniti Precision Medicine. “Folate means something different depending on what your B12 and homocysteine are doing. You can’t make a responsible recommendation without seeing the full picture.”

That full picture includes at minimum:

  • Serum or RBC folate (already have this)
  • Vitamin B12 (serum, though functional markers are more informative)
  • Homocysteine (rises when either folate or B12 is functionally insufficient)
  • Methylmalonic acid (MMA), which rises specifically when B12 is functionally deficient

If your standard bloodwork shows high folate but didn’t include those markers, that’s worth following up on — particularly if you’re over 50, taking multiple supplements, or experiencing any of the neurological symptoms described above.

Jinfiniti’s AgingSOS Advanced Panel measures homocysteine alongside NAD+, inflammatory markers, and 25 other biomarkers, giving you the broader picture that a standard folate test alone can’t provide. It’s designed precisely for situations like this — where a single flagged result only makes sense when you can see what’s happening around it.

This is also relevant for people who assume that getting tired all the time with normal blood test results means there’s no biological explanation. Standard panels often don’t include the markers that would reveal an underlying B-vitamin imbalance.

Review All Your Sources of Synthetic Folic Acid

Before adjusting anything, do a full audit of where your folic acid is coming from. Common sources people underestimate:

  • Multivitamins (typically 400 to 800 mcg per serving)
  • B-complex supplements (often another 400 to 800 mcg)
  • Prenatal vitamins (frequently 800 to 1,000 mcg)
  • Fortified breakfast cereals (up to 400 mcg per serving)
  • Enriched bread, pasta, rice, and flour

If the cumulative total is significantly above 400 mcg, that’s likely the primary driver of the elevation, and the simplest adjustment is reducing overlapping supplements. Don’t assume that more B vitamins are always better — the evidence on excess folic acid, particularly regarding UMFA accumulation and the B12 interaction, argues for a more measured approach.

The Form of Folate Matters

If continued supplementation is appropriate, the form matters significantly. Folic acid is the synthetic precursor that requires enzymatic conversion. 5-MTHF (methylfolate) is the already-active form, with a few meaningful advantages:

  • Doesn’t require the MTHFR enzyme to become usable
  • Doesn’t accumulate as UMFA when intake is high
  • Does not mask B12-related anemia the way synthetic folic acid does

This is the same logic that underlies choosing supplement forms carefully across the board — the same reason form matters when comparing magnesium glycinate vs. citrate: bioavailability and downstream effect aren’t the same across all versions of a nutrient.

For people with MTHFR variants, switching from folic acid to 5-MTHF is a particularly well-supported recommendation. For others, simply reducing total intake is often sufficient.

Work With Your Clinician, Not Around Them

High serum folate by itself doesn’t tell you whether your B12 is functionally adequate, whether you have an MTHFR variant, or whether UMFA is accumulating in your system. Those are questions that require additional testing and clinical context.

Don’t attempt to self-diagnose MTHFR from a single blood test, and don’t abruptly stop supplements without understanding what you actually need. A clinician who understands B-vitamin metabolism can help you interpret the full picture and make adjustments that are specific to your situation.

🧬 RELATED READING

Frequently Asked Questions

Is it dangerous to have high folate levels?

High folate from synthetic folic acid can pose risks — primarily by masking a vitamin B12 deficiency and, at very high doses, potentially through UMFA accumulation. Whether your specific elevated result is cause for concern depends on your B12 status, homocysteine levels, and total folic acid intake. Elevated folate from natural food sources is generally not a concern.

Can too much folic acid cause nerve damage?

Folic acid itself doesn’t cause nerve damage directly. The risk is indirect: high folic acid can mask the anemia caused by B12 deficiency, delaying diagnosis while neurological damage from the B12 deficiency progresses. If high folate and any neurological symptoms coexist, B12 status should be thoroughly evaluated — not just through a standard serum B12 test, but with functional markers like homocysteine and MMA.

What does high folate with normal B12 mean?

In many cases, this combination is not cause for concern. However, standard serum B12 tests can appear normal even when B12 is functionally insufficient. If you have high folate and normal B12 but are experiencing fatigue, numbness, or cognitive changes, it’s worth asking your clinician about homocysteine and MMA testing, which provide a more accurate picture of functional B12 status.

Can you take too much methylfolate?

Methylfolate (5-MTHF) is generally considered safer than synthetic folic acid because it doesn’t accumulate as UMFA and doesn’t mask B12 deficiency. That said, very high doses of any folate form can still interfere with folate metabolism. Some people, particularly those sensitive to methylated B vitamins, report side effects from high-dose methylfolate. Staying within reasonable supplementation ranges and working with a clinician is still the right approach.

How do I lower my folate levels?

The most straightforward step is auditing and reducing overlapping sources of synthetic folic acid — particularly multiple supplements each containing folic acid. Reducing fortified grain consumption can also help. Switching from folic acid to 5-MTHF, if supplementation is still needed, lowers the risk of accumulation. Levels typically normalize within a few weeks of reducing intake. Always confirm next steps with your clinician before making changes, particularly if other health conditions are involved.

  1. Ray JG, Vermeulen MJ, Boss SC, Cole DEC. Declining Rate of Folate Insufficiency Among Adults Following Increased Folic Acid Food Fortification in Canada. Springer Science and Business Media LLC; 2002. https://doi.org/10.1007/bf03405010
  2. Hecker J, Layton R, Parker RW. Adverse Effects of Excessive Folic Acid Consumption and Its Implications for Individuals With the Methylenetetrahydrofolate Reductase C677T Genotype. Springer Science and Business Media LLC; 2025. https://doi.org/10.7759/cureus.79374
  3. Molloy AM, Kirke PN, Brody LC, Scott JM, Mills JL. Effects of Folate and Vitamin B12 Deficiencies During Pregnancy on Fetal, Infant, and Child Development. SAGE Publications; 2008. https://doi.org/10.1177/15648265080292s114
  4. Bailey RL, Jun S, Murphy L, Green R, Gahche JJ, Dwyer JT, et al. High folic acid or folate combined with low vitamin B-12 status: potential but inconsistent association with cognitive function in a nationally representative cross-sectional sample of US older adults participating in the NHANES. Elsevier BV; 2020. https://doi.org/10.1093/ajcn/nqaa239
A woman compares her body age to her chronological age

What Does Body Age Mean and Can You Actually Lower It?

You’ve probably come across it somewhere: a gym scale that spits out a “metabolic age,” a wellness quiz that tells you your body is 43 when your actual age is 37, or an app that promises to calculate your “real age” from a few health inputs. Most people notice the number, feel vaguely curious or vaguely alarmed, and move on without really understanding what it represents.

Body age — also called biological age — is a genuinely useful concept. The problem is that most of the tools that introduce people to it are measuring something much simpler than what the science actually describes.

The real version is worth understanding, because it’s considerably more specific — and more useful — than what those quizzes deliver.

The Short Summary

  • Body age reflects how fast your cells are actually aging, not how long you’ve been alive.
  • Most consumer body age calculators compare your health metrics to population averages — they’re not measuring cellular aging directly.
  • The biomarkers most closely linked to true biological aging include DNA methylation patterns, telomere length, chronic inflammatory load, and intracellular NAD+ levels.
  • Body age can diverge from chronological age in both directions, and several of the markers driving that gap are directly measurable and addressable.

CLIA-Certified Blood Panel

48 biomarkers that reveal your cellular age from home.

Jinfiniti AgingSOS green gradient background

Body Age Is Not What Most Calculators Are Measuring

There’s a real concept hiding inside most body age tools. But what those tools actually calculate is a different, much blunter thing.

Chronological Age vs. Body Age

Chronological age is the number of years you’ve been alive. It’s also the number that shows up as a primary risk factor in most clinical guidelines for chronic disease. That correlation is real — the longer you’ve been alive, the more accumulated cellular damage you’re likely to carry.

But it’s an average, not a certainty. Two people born the same year can be in meaningfully different cellular condition. Same genetic background, similar lifestyle choices, and one of them is functioning five years ahead of their age on the inside. The other is behind. Chronological age can’t tell you which one you are.

Body age — also called biological or physiological age — reflects the actual condition of your cells and tissues. It accounts for accumulated cellular damage, DNA expression patterns, genetic factors, how well your metabolic systems are running, and a range of other things a birthday can’t capture. It’s closer to what’s actually happening in your body right now.

What Most Body Age Tools Actually Do

The majority of body age calculators — from gym scales to wellness apps to some online “biological age” tests — work by comparing your health metrics against population averages for your age group. If your blood pressure, cholesterol, BMI, or resting heart rate sit above the average for your demographic, your body age score comes back older. Below average, and it comes back younger.

This isn’t useless. Risk factor awareness matters. But comparing your numbers to a population average is not the same thing as measuring how fast your cells are actually aging. Two people with identical risk factor scores can have meaningfully different biological ages at the cellular level. That’s why researchers have spent decades developing more specific measurement tools.

If persistent fatigue or low energy has you questioning whether your standard labs are giving you the full picture, there are specific biomarkers that standard blood tests routinely miss.

What’s Actually Happening Inside Your Cells

Real biological aging shows up at the molecular level: chemical marks accumulating on DNA, protective caps wearing down at the ends of chromosomes, inflammatory signals building in tissue, cellular energy systems losing efficiency. These are the mechanisms behind the aging process, and they’re what precision measurement actually tracks.

DNA Methylation and the Epigenetic Clock

Every time your cells divide, small chemical compounds called methyl groups attach to specific sites on your DNA. This process — DNA methylation — doesn’t alter your genetic sequence. What it does is change how genes are expressed, turning some on and some off. Over time, those methylation patterns shift in ways that correlate strongly with aging.

Researchers have used this to build what are called epigenetic clocks: models that estimate biological age from methylation data collected at hundreds or thousands of genomic sites. The best-known include the Horvath clock, PhenoAge, and GrimAge.

A 2022 review in Ageing Research Reviews concluded that these clocks correlate with morbidity, mortality, and age-related disease risk, and that they respond measurably to lifestyle interventions.[1]

Epigenetic clocks are currently the most validated single-marker approach to estimating biological age.

Telomere Length and Cellular Wear

Telomeres are the protective sequences at the ends of chromosomes — think of the plastic tips on shoelaces. Each time a cell divides, those tips get slightly shorter. When they get too short, the cell either stops dividing or initiates a stress response.

Shorter telomeres track with higher rates of age-related disease and earlier mortality. A 2021 review in Frontiers in Genetics found that telomere length is most informative when used alongside other biomarkers rather than as a standalone measure — as a single data point, it gives only a rough estimate of aging rate.[2]

No single marker tells the whole story. Multi-marker approaches consistently outperform single tests in research on biological age, and this is a good example of why.

Inflammation and Cellular Senescence

As cells age, some stop dividing but don’t die. These senescent cells, sometimes called “zombie cells,” don’t just go quiet. They secrete a mix of inflammatory proteins called the senescence-associated secretory phenotype (SASP) that can push neighboring cells toward the same state. The result is a kind of chronic, low-grade systemic inflammation researchers call “inflammaging.”

A 2023 review in Signal Transduction and Targeted Therapy describes inflammaging as one of the core drivers of biological aging, with direct connections to neurodegeneration, cardiovascular disease, and metabolic decline. The accumulation of senescent cells and the inflammatory load they produce is one of the clearest signs that body age is pulling ahead of chronological age.[3]

NAD+ Decline and Cellular Energy

NAD+ (nicotinamide adenine dinucleotide) is a molecule your cells rely on to produce energy, repair DNA, and regulate hundreds of metabolic processes. It declines steadily with age, with measurable drops often starting in the 30s.

That decline matters because NAD+ is involved in several biological aging pathways simultaneously. Lower NAD+ means less capacity for mitochondrial energy production, slower DNA repair, and upregulated inflammatory signaling.

A systematic review covering 147 studies in Experimental Gerontology found that declining NAD+ levels track closely with age-related degenerative processes, and that restoring those levels produces measurable effects in both preclinical and early clinical research.[4]

What makes NAD+ worth particular attention here is that it’s directly measurable. Unlike some aging biomarkers that require tissue biopsy or complex genomic analysis, intracellular NAD+ can be assessed from a blood sample — a clear readout of where that specific pathway stands.

If you want context on how mitochondrial supplements factor into cellular energy production, that’s a useful place to start.

How Body Age Is Actually Measured

The gap between a gym scale readout and a clinical biological age assessment is significant. Here’s what more precise measurement actually involves.

Epigenetic Clock Testing

Dedicated epigenetic age tests analyze DNA methylation patterns from a blood or saliva sample, then run the data through an established clock algorithm to generate a biological age estimate. These tests are more expensive than standard bloodwork, and predictive accuracy varies by which model is used.

A 2025 review in Frontiers in Cardiovascular Medicine notes that advances in omics technologies and biomarker research are improving the precision of biological aging assessments, with integration of multiple data streams producing more accurate and useful results than any single marker alone.[5]

Blood Biomarker Panels

Comprehensive blood panels that include inflammatory cytokines, senescence markers, NAD+ levels, longevity proteins like Klotho, and metabolic indicators give a multi-system picture of where biological aging actually stands. The value comes from looking across pathways — not just one.

A panel that measures only one or two markers will miss most of what’s driving body age. The hallmarks of aging interact with each other. Mitochondrial dysfunction drives NAD+ depletion. Cellular senescence amplifies inflammatory load. Inflammaging suppresses NAD+ metabolism. A single data point doesn’t give you an accurate picture.

What Makes a Biomarker Worth Measuring

Researchers use fairly specific criteria to evaluate aging biomarkers: they should predict health outcomes better than chronological age alone, reflect the actual mechanisms of aging rather than secondary effects of disease, be measurable repeatedly without harm, and respond to interventions in a trackable way.

Biomarkers that meet these criteria — including epigenetic methylation patterns and intracellular NAD+ — are the ones that generate useful information.

Understanding how to test NAD+ levels is a reasonable first step for anyone starting to explore their own cellular picture.

What Affects Your Body Age — and How to Improve It

The factors that drive body age aren’t abstract — they operate directly on the cellular mechanisms described above. Here’s what the research actually supports, and how to improve your body age across each lever.

How to Improve Your Body Age

Exercise

  • Regular physical activity supports telomere maintenance and lowers systemic inflammatory markers.
  • Resistance training improves body composition, helps preserve muscle mass, and supports NAD+ metabolic efficiency.
  • Regular exercise at moderate intensity — around 150 minutes per week — shows measurable effects on epigenetic aging patterns in clinical studies.

Sleep quality

  • Chronic sleep disruption is one of the fastest accelerants of epigenetic aging in the literature.
  • Poor sleep elevates inflammatory cytokines, which compounds senescent cell accumulation over time.
  • Consistent, restorative sleep is one of the few lifestyle choices that moves multiple aging pathways at once.

Diet and metabolic health

  • A balanced diet low in processed foods and refined sugars and high in vitamins and minerals reduces body fat and lowers chronic inflammatory load directly.
  • Caloric restriction and intermittent fasting show effects on NAD+ metabolism and cellular autophagy — the process by which cells clear out damaged components.
  • Blood sugar dysregulation accelerates glycation damage independently of other risk factors, adding measurable years to biological age on its own.

Stress management

  • Prolonged psychological stress correlates with accelerated telomere shortening and elevated senescence markers.
  • Chronic cortisol elevation suppresses NAD+-dependent repair mechanisms over time.
  • Exercise, sleep, and mindfulness all show overlapping effects on inflammatory and epigenetic aging markers — managing stress and managing body age are the same project.

NAD+ support

  • NAD+ can be measured directly, which means it’s one area where you can verify whether an intervention is actually working rather than assuming it is.
  • Unlike most lifestyle interventions, targeted NAD+ precursor supplementation allows you to track a specific molecular readout before and after — not just how you feel.

Why Measuring Before Acting Matters

Most people try things and hope for improvement. That’s reasonable as far as it goes — but it doesn’t tell you which pathways are actually depleted in your particular biology.

Someone with measurably low NAD+ and normal inflammatory markers has a different cellular picture from someone with elevated senescence markers and adequate NAD+. The right approach for each is different. Without a baseline, you’re applying a generic strategy to a specific problem — and you won’t know whether it worked.

🧬 RELATED READING

Getting a Clearer Picture of Your Body Age

The question people are really asking when they encounter body age calculators is: is my body holding up the way it should be? The frustration isn’t with the question. It’s that most available tools aren’t built to actually answer it.

A longevity panel like AgingSOS that includes NAD+, senescence markers, inflammatory cytokines, Klotho, and metabolic indicators doesn’t just return a number. It shows which specific systems need attention, which are functioning within range, and where to start.

“Most people come to us after they’ve already tried the obvious answers,” says Dr. Jin-Xiong She, founder of Jinfiniti Precision Medicine. “What body age really means at the cellular level is whether your systems are being maintained, or are slowly losing ground. Testing gives you that answer. Without it, you’re managing your health without knowing which problem you’re actually solving.”

Body age as a concept only becomes useful when you can measure the things behind it. A quiz score doesn’t change anything. Knowing your NAD+ is suboptimal, your inflammatory markers are elevated, or your Klotho is low — that gives you somewhere to start.

Frequently Asked Questions

What Is the Difference Between Body Age and Biological Age?

The terms are used interchangeably in most contexts. Body age and biological age both refer to how your cells and tissues are functioning compared to chronological age norms. “Body age” tends to appear in consumer-facing tools (gym scales, apps), while “biological age” is more common in clinical and research settings. Same concept, different context.

Can Body Age Be Lower Than Your Chronological Age?

Yes, and it happens more than people expect. People with consistently healthy habits, well-maintained NAD+ levels, low chronic stress, and good sleep regularly show biological ages below their chronological age on panel testing. The relationship between how long you’ve lived and how fast you’ve aged is not fixed.

What Is a Normal Body Age?

There’s no single universal standard. Biological age assessments compare your markers to reference ranges built from population data. The specific number matters less than whether your key markers are trending in the right direction — and whether the interventions you’re making are actually moving them.

Can You Reverse Your Body Age?

The evidence supports slowing the rate of biological aging and, in some cases, improving specific markers meaningfully. “Reversing” is probably stronger language than most clinical research warrants. Epigenetic clocks have shown responsiveness to lifestyle and supplementation interventions in controlled studies.

What Is the Most Accurate Way to Measure Body Age?

Epigenetic clock testing is currently the most validated single approach. In practice, multi-marker blood panels that include NAD+, inflammatory cytokines, senescence markers, and longevity proteins like Klotho give a more complete and useful picture than any single test. The goal isn’t a single number — it’s understanding which systems are on track and which need attention.

  1. Duan R, Fu Q, Sun Y, Li Q. Epigenetic clock: A promising biomarker and practical tool in aging. Elsevier BV; 2022. https://doi.org/10.1016/j.arr.2022.101743
  2. Vaiserman A, Krasnienkov D. Telomere Length as a Marker of Biological Age: State-of-the-Art, Open Issues, and Future Perspectives. Frontiers Media SA; 2021. https://doi.org/10.3389/fgene.2020.630186
  3. Li X, Li C, Zhang W, Wang Y, Qian P, Huang H. Inflammation and aging: signaling pathways and intervention therapies. Springer Science and Business Media LLC; 2023. https://doi.org/10.1038/s41392-023-01502-8
  4. Braidy N, Liu Y. NAD+ therapy in age-related degenerative disorders: A benefit/risk analysis. Elsevier BV; 2020. https://doi.org/10.1016/j.exger.2020.110831
  5. Sanada F, Hayashi S, Morishita R. Targeting the hallmarks of aging: mechanisms and therapeutic opportunities. Frontiers Media SA; 2025. https://doi.org/10.3389/fcvm.2025.1631578
A patient receiving an eGFR blood test in a clinic

eGFR Blood Test: What It Means, Normal Range, and Next Steps

Reading your lab report and wondering “what does eGFR mean?” Trust us, you’re not alone. It stands for estimated glomerular filtration rate and it’s one of the primary numbers clinicians look at to understand how well your kidneys are filtering your blood.

It’s also a number that gets misunderstood quickly. eGFR is an estimate derived from your other lab values. A single “low” value does not definitively mean you have chronic kidney disease.

What You Should Know

  • eGFR is a calculated estimate of kidney filtration, not a direct measurement.
  • “Normal” depends on your age, trends over time, and whether there’s kidney damage on urine testing.
  • One low eGFR can be temporary from illness, dehydration, or medications.
  • The most helpful next test is usually a repeat eGFR plus a urine albumin-to-creatinine ratio (uACR).

CLIA-Certified Biomarker Panel

Test your eGFR with other markers of kidney function.

Jinfiniti AgingSOS green gradient background

What is eGFR in a Blood Test?

eGFR stands for estimated glomerular filtration rate, which is a way to approximate how much blood your kidneys filter each minute. The “glomeruli” are tiny filtering units inside your kidneys, and the “filtration rate” describes how efficiently they clear waste and extra fluid.

Most routine kidney panels do not “measure GFR” directly. Instead, your lab report lists an eGFR number that’s calculated from other values in your blood sample.

When people search “eGFR meaning” or “what is eGFR in blood test,” the simplest answer is this: it’s a quick snapshot of kidney filtration that helps flag reduced kidney function early.

How eGFR Is Calculated (and Why It’s an Estimate)

Your eGFR is usually calculated from serum creatinine level, plus factors like age and sex. Creatinine is a waste product made when your body uses creatine for energy, so it tends to rise when filtration slows.[1]

That calculation is useful, but it has blind spots. Anything that changes creatinine without changing filtration can nudge your eGFR up or down.

Creatinine: Helpful, but Easy to Skew

Creatinine is influenced by muscle mass, diet, supplements, and even last night’s workout. That’s why two people with the same kidney function can show different creatinine values.

If you’ve ever wondered whether supplements can confuse lab results, our guide to creatine vs creatinine breaks down what’s normal and what’s not.

CKD-EPI and the 2021 Update You May See on Your Report

Many laboratories now report eGFR using the 2021 CKD-EPI creatinine equation, which removed race from the calculation. A 2021 paper helped validate newer approaches, and some people saw their reported eGFR shift slightly after their lab switched formulas.[2]

If your report says “eGFR CKD-EPI,” it usually refers to the equation used, not a separate test.

When Cystatin C Can Make eGFR More Accurate

If creatinine is likely to mislead (very high muscle mass, low muscle mass, older age, or unusual diets), clinicians sometimes add cystatin C. Cystatin C is a protein produced by your cells at a steadier rate, and it can improve accuracy when creatinine is “noisy.”

If you want a plain-English deep dive, see our guide to cystatin C levels and normal ranges.

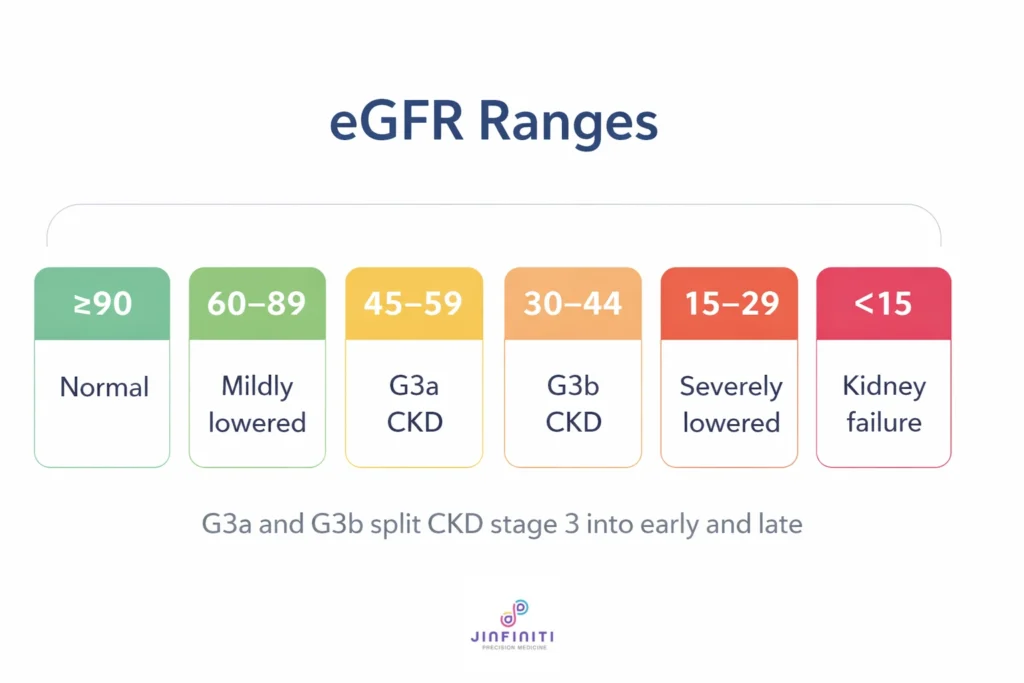
Infographic showing normal ranges for eGFR on a blood test

Normal eGFR Range (and Why Age Matters)

People often search “eGFR normal range” hoping for one clean cutoff. The reality is messier, because eGFR tends to decline as you get older, even in otherwise healthy adults.

Most labs flag an eGFR below 60 as “low,” but interpretation depends on your trend and whether there’s evidence of kidney damage. The National Kidney Foundation explains this age and context issue well, and even offers a handy eGFR calculator for professionals.

eGFR Test Results and Next Steps

Here’s a practical way to interpret common eGFR ranges (assuming the result is confirmed and not from an acute illness).

eGFR (mL/min/1.73m²)What it can meanWhat’s usually checked next
≥90Often normal filtrationLook for kidney damage on urine testing if there are risk factors (diabetes, high blood pressure)
60–89Mildly reduced or age-related declineRepeat labs and check urine albumin (uACR) if risk factors are present
45–59Moderately reduced filtrationConfirm persistence, check uACR, review meds, assess blood pressure and diabetes control
30–44More significant reductionSame as above, with closer follow-up and possible nephrology input
15–29Severe reductionUrgent evaluation and specialist care is common
<15Kidney failure rangeSpecialist-led care and planning is typical

That “1.73m²” is a standardized body surface area used for comparison across people, which is why eGFR is not a perfect individualized measurement.

Low eGFR: Common Causes (Not All Are Chronic Kidney Disease)

Seeing “eGFR low” on your results can feel like a siren. The key question is whether this is a one-time dip or a persistent pattern.

A single low number can happen when your body is under temporary stress, even if your kidneys are structurally fine.

Temporary Reasons eGFR Can Drop

These are some of the most common “false alarms” that can lower eGFR on a laboratory test:

  • Dehydration or poor fluid intake before the blood draw.
  • Recent vomiting, diarrhea, fever, or other acute illness.
  • Some medications, especially NSAIDs (like ibuprofen) in higher or frequent doses.
  • Intense exercise shortly before testing.
  • Recent creatine supplementation that raises creatinine without true damage in healthy people (context matters).

If any of these were true for you, repeating the test once you’re back to baseline is often more informative than spiraling over a single report.

Ongoing Causes of Reduced eGFR

When eGFR stays low, the most common long-term drivers are metabolic and vascular. The big ones include diabetes, high blood pressure, and underlying kidney diseases.

That’s one reason kidney results are often interpreted alongside blood sugar and inflammation markers, such as HbA1c and CRP.

eGFR Stages and How CKD Is Actually Diagnosed

It’s tempting to map one lab result to one diagnosis. Kidney guidelines do not work that way.

Chronic kidney disease is defined by either reduced eGFR or evidence of kidney damage that persists for at least 3 months.

Why Urine Albumin Matters as Much as eGFR

Kidney risk is staged using both eGFR and albuminuria (protein leakage into urine). A urine albumin-to-creatinine ratio (uACR) helps detect kidney damage even when eGFR is still “normal.”[3]

A urine albumin-to-creatinine ratio (uACR) is a key companion test because it changes long-term risk and follow-up decisions.

If you’re trying to connect related labs, it can also help to understand what albumin levels in blood can suggest about overall health and inflammation (even though urine albumin is the kidney-specific piece).

What To Do If Your eGFR Is Low

The best next step is usually not a supplement or a cleanse. It’s a clearer answer.

A repeat test plus the right companion labs often tells you whether you’re seeing a temporary fluctuation or a real trend.

A Simple Next-Step Checklist

  • Repeat creatinine and eGFR when you’re well hydrated and not acutely ill.
  • Add urine albumin-to-creatinine ratio (uACR) to look for kidney damage.
  • Review medications with your clinician, especially frequent NSAID use.
  • Check blood pressure and long-term glucose control (often with HbA1c).
  • Consider cystatin C if creatinine-based eGFR doesn’t fit your body type or situation.

When It’s Worth Calling a Clinician Quickly

Seek prompt medical advice if you see a rapid drop from your usual results, if your eGFR is very low, or if you have symptoms like swelling, shortness of breath, confusion, or very low urine output.

Those scenarios can signal an acute kidney problem that needs immediate evaluation.

How To Support Kidney Health (Without Guessing)

Kidney protection is mostly boring, which is good news. The habits that help are the same ones that reduce cardiovascular and metabolic risk.

Here’s what tends to matter most, based on guideline-level consensus.

  • Keep blood pressure in a healthy range and treat hypertension when present.
  • Control blood sugar if you have prediabetes or diabetes, since high glucose drives kidney damage over time.
  • Avoid frequent high-dose NSAIDs unless a clinician advises otherwise.
  • Aim for a balanced diet and adequate hydration, especially around testing.
  • Don’t “protein panic” without context. Protein targets should be personalized if CKD is confirmed.

If you’re tracking uric acid because of kidney stones or gout risk, our guide to uric acid test ranges can help you interpret that number alongside kidney function.

A Practical Perspective from Dr. Jin-Xiong She

Dr. Jin-Xiong She, PhD (genomic medicine researcher and founder of Jinfiniti), often reminds patients that kidney numbers need context.

“Your kidneys don’t wake up one morning and decide to ‘be low.’ If eGFR drops, your job is to find out whether it’s a temporary stress signal or a persistent pattern, then act on the cause.”

That’s also why Jinfiniti leans on the Test, Act, Optimize approach. You measure first, you respond based on data, and you retest to confirm what’s working.

If You Want a Bigger Health Picture

eGFR is a kidney-focused number, but it rarely exists in isolation. Blood pressure, glucose control, inflammation, and cardiovascular risk all push on kidney outcomes over time.

If you want to track kidney-relevant markers alongside a broader set of longevity biomarkers, the AgingSOS Essential Panel includes common kidney function markers like creatinine and cystatin C as part of a multi-system view.

All testing is processed through Jinfiniti’s high-complexity CLIA laboratory in Augusta, Georgia, which matters when you’re making health decisions based on lab results.

Frequently Asked Questions

What is eGFR in a blood test?

eGFR is an estimate of kidney filtration calculated from blood markers like creatinine plus age and sex.

What is a normal eGFR?

Many healthy adults fall above 90, but “normal” depends on age and whether there’s kidney damage on urine albumin testing.

Is eGFR 60 bad?

An eGFR below 60 is often flagged as low, yet CKD usually requires persistence for at least 3 months or evidence of kidney damage.

Can dehydration cause low eGFR?

Yes. Dehydration can raise creatinine temporarily, which lowers the calculated eGFR until you rehydrate and recover.

What does “eGFR CKD-EPI” mean?

It typically refers to the equation your lab used to calculate eGFR.

How often should eGFR be checked?

It depends on your risk factors and prior results. If a result is abnormal, repeating eGFR and adding uACR is a common next step.

What’s the difference between eGFR and GFR?

GFR is the concept (true filtration rate). eGFR is a calculated estimate used in routine laboratory testing.

Should I worry if creatinine is normal but eGFR is low?

Sometimes labs calculate eGFR in a way that creates borderline values, especially in older adults. Trends and urine albumin often matter more than one isolated number.

What tests help confirm chronic kidney disease?

A repeat eGFR plus urine albumin-to-creatinine ratio is foundational, along with evaluation of underlying causes.

Can you improve your eGFR levels?

Yes, especially if a low result was driven by dehydration, acute illness, or a medication effect. Long-term improvement depends on the underlying cause and risk-factor control.

Referenced Sources

  1. Mula-Abed WAS. Estimated Glomerular Filtration rate (eGFR): A Serum Creatinine-based Test for the Detection of Chronic Kidney Disease and its Impact on Clinical Practice. Oman Medical Journal; 2012. https://doi.org/10.5001/omj.2012.87
  2. Inker LA, Eneanya ND, Coresh J, Tighiouart H, Wang D, Sang Y, et al. New Creatinine- and Cystatin C–Based Equations to Estimate GFR without Race. Massachusetts Medical Society; 2021. Available from: https://doi.org/10.1056/nejmoa2102953
  3. Inoue K, Streja E, Tsujimoto T, Kobayashi H. Urinary albumin-to-creatinine ratio within normal range and all-cause or cardiovascular mortality among U.S. adults enrolled in the NHANES during 1999–2015. 2021.
Featured image showing the best at-home health test kits

The Best At-Home Health Test Kits in 2026: Full Comparison

At-home health testing got a glow-up. In 2026, the market spans everything from single-biomarker finger-prick kits to 100+ marker panels paired with dashboards, wearable integrations, and AI-assisted insights.

The important thing is that the good options don’t “do the testing” in your home. They use home-friendly collection and then send your sample to a regulated clinical lab, often a CLIA-certified laboratory in the U.S., for processing. That’s the line between a useful health signal and a glorified fortune cookie.

This guide compares the best home health test kits across three categories: comprehensive blood biomarker platforms, targeted single-purpose kits, and gut microbiome tests. You’ll also see how Jinfiniti’s AgingSOS Ultimate Panel fits as a longevity-first option processed at Jinfiniti’s high-complexity CLIA-certified lab.

Medical note: At-home tests can be powerful for screening and trend tracking. They don’t diagnose disease on their own or replace medical care.

What You Should Know

  • The most trustworthy kits send your sample to a CLIA-certified lab for analysis, not a mystery “instant” reader.
  • If you want longevity data, look for panels that include advanced aging markers, not just cholesterol and glucose.
  • Venous blood draws tend to be most precise, but high-quality capillary testing can still be useful for tracking trends.
  • The “best” kit depends on your goal: longevity, hormones, metabolic health, gut symptoms, or convenience.

Quick Picks (Best Home Tests by Goal)

  • Best longevity panel (deep aging markers): AgingSOS Ultimate Panel
  • Best for maximum biomarker breadth (big annual snapshot): Function Health
  • Best for frequent, at-home blood monitoring (convenience): SiPhox Health
  • Best all-in-one optimization bundle (data + action tools): OneTwenty
  • Best for integrating blood + DNA + wearables (data dashboard): InsideTracker
  • Best targeted tests on a budget (wide menu): Everlywell
  • Best targeted tests with clinician support: LetsGetChecked
  • Best for peer-reviewed validation focus: imaware
  • Best gut microbiome platform (actionable recommendations): Viome

Head-to-Head Comparison Table

PlatformTypical Price StyleWhat You TestSample TypeTurnaroundSupportBest For
Jinfiniti AgingSOS Ultimate PanelPer test + subscription options48 advanced longevity biomarkersBlood draw (mobile phlebotomy available)VariesExpert interpretation + consultationLongevity tracking, advanced aging markers
Function HealthAnnual membership~100 unique biomarkers, 2 rounds/yearVenous draw at labFast dashboard, notes laterClinician notes + action planBroadest blood snapshot
SiPhox HealthPer-test or membershipUp to ~60 biomarkersAt-home (finger-prick or EasyDraw upper-arm device)~1 weekDashboard + AI insightsFrequent tracking from home
OneTwentyAnnual membership tiers100+ biomarkers + wearable metricsLab draw, some at-home optionsDays to a weekCoaching + clinical support (model varies)“Done-for-you” optimization
InsideTrackerPlatform membership + add-on tests40+ biomarkersLab draw or mobile add-onDaysAction plan, strong integrationsBlood + DNA + wearables in one place
EverlywellPer testTargeted tests (30+ options)Finger-prick or saliva (varies)DaysPhysician-reviewed resultsNarrow questions, low entry cost
LetsGetCheckedPer testTargeted testsFinger-prick/saliva/urine (varies)DaysPhysician consults, treatment pathways for some testsResults plus clinical guidance
imawarePer testTargeted testsFinger-prickDaysData + limited telehealth (context dependent)Validation-forward testing
ViomePer test + subscription optionsGut microbiome, sometimes add-onsStool (and sometimes blood/saliva)WeeksFood guidance + supplements (optional)Gut-focused personalization
Tiny HealthPer test or membershipGut microbiomeStoolWeeksCoaching add-onsDeep DNA-based microbiome profile

Pricing and features can change. Treat this as a structured comparison, then confirm the exact current plan before you buy.

How We Ranked the Best At-Home Health Test Kits

We prioritized five things.

  • Lab standards: CLIA-certified lab processing when applicable, plus clear reporting.
  • Coverage: breadth of biomarkers (or depth in a specific domain like gut).
  • Sample quality: venous draw vs capillary, and how error-prone collection is.
  • Actionability: do you get next steps, not just red and green dots.
  • Support: clinician notes, consults, coaching, or treatment pathways.

Comprehensive Blood Biomarker Platforms

These are the heavy hitters. They’re designed for prevention, longevity tracking, and finding issues before you feel them.

Jinfiniti AgingSOS Ultimate Panel


CLIA-Certified Biomarker Panel

48 longevity biomarkers including NAD+ and Klotho.

Jinfiniti AgingSOS green gradient background

Most at-home platforms are built around “general wellness labs.” AgingSOS is built around aging biology. If your goal is healthspan optimization, you want markers that map to longevity mechanisms like inflammation, metabolic resilience, cardiovascular risk, oxidative stress, nutrient status, senescence signaling, and hormone balance.

At a glance

  • Panel depth: 48 advanced biomarkers designed for longevity and prevention
  • Sample: Blood draw (mobile phlebotomy available)
  • Processing: Run through Jinfiniti’s high-complexity CLIA-certified laboratory in Augusta, Georgia
  • Guidance: Free expert consultation included, plus personalized supplement and lifestyle recommendations
  • Two alternative panels at lower price points: Advanced Panel and Essential Panel

What it measures (and why that’s different):

  • Cellular resilience markers that are rarely available in mainstream DTC testing, including intracellular NAD+ and Klotho
  • Cardiovascular risk beyond basic cholesterol, including ApoB and Lp(a), plus expanded lipid fractions
  • Inflammation and senescence signaling, including multiple inflammatory cytokines and senescence markers (for example β-gal)
  • Metabolic depth, including insulin resistance and broader metabolic health markers
  • Oxidative stress and micronutrients, to help connect symptoms and performance issues to actionable drivers

Why the CLIA lab point matters:
Your sample is only as trustworthy as the lab that processes it. AgingSOS is processed inside Jinfiniti’s own high-complexity CLIA-certified lab, which is a meaningful quality signal for test performance, quality systems, and ongoing oversight.

Best for:

  • People who want a longevity-first baseline that goes beyond standard labs
  • Anyone running a serious “test, act, optimize” loop and planning to retest after interventions
  • Optimizers who want rare markers to validate whether their protocol is actually moving the needle

What to keep in mind:

  • A blood draw adds a little friction compared to mail-only kits, but it improves sample quality and expands what you can measure.
  • This is intentionally comprehensive. If you only need one answer (like vitamin D), a targeted test can cost less.

How to get more value from your results:

  • Pick one priority lever (lipids, insulin resistance, inflammation, micronutrients, hormones)
  • Make one meaningful change for 8–12 weeks
  • Retest on a schedule that matches the lever you’re pulling, then adjust

Function Health

Function Health is the “big snapshot” membership. It’s built for people who want broad, clinic-style bloodwork, twice a year, with a clean dashboard and clinician-reviewed guidance.

What you get:

  • Two rounds of testing per year, typically an annual panel around ~100 unique biomarkers plus a mid-year panel around ~60 tests
  • Coverage across heart health, hormones, thyroid, liver and kidney markers, heavy metals, nutrients, inflammation, and more

Collection experience:

  • Requires venous blood draws through partner lab locations
  • Many members report that the draw can be split into two appointments because of the number of vials

Results and interpretation:

  • Results often populate quickly in the dashboard
  • Clinician notes typically arrive later, so you get the numbers first and the narrative after

Who it’s best for:

  • People who want a wide, twice-yearly baseline and are comfortable doing in-lab blood draws
  • Anyone who prefers a dashboard and clinician notes over coaching calls and programs

Strengths:

  • Among the broadest biomarker coverage available in DTC memberships
  • Designed for longitudinal tracking so you can see trends, not just one-off values

Limitations:

  • Blood draw logistics and extra fees can add friction
  • Implementation support is lighter than coaching-heavy platforms

Tip: If you’re doing two rounds per year, plan your timing around life cycles that actually change biomarkers (training blocks, weight loss phases, diet shifts). That way your “before and after” is meaningful, not random.

SiPhox Health

SiPhox is the convenience-first option for people who want repeatable testing without living at a lab appointment desk. It’s designed around frequent cadence and at-home collection.

What you get:

  • Panels that can cover up to ~60 biomarkers, depending on the plan
  • A dashboard built for tracking trends, with wearable integrations and guided insights

Collection experience:

  • Uses at-home collection options, including a proprietary, needle-free upper-arm device (“EasyDraw”) for certain panels
  • Because at-home collection can be more error-prone, following prep and collection instructions matters more here than with venous draws

Results and interpretation:

  • Results are typically delivered in about 5–7 days
  • The platform leans into AI-assisted explanations, plus practical next steps and supplement recommendations

Who it’s best for:

  • People who want frequent trend tracking (monthly or quarterly style rhythms)
  • Anyone optimizing training, metabolism, sleep, or recovery who wants regular feedback loops

Strengths:

  • Convenience and cadence, which is what actually makes most people stick with testing
  • Often a strong value proposition when you want multiple tests per year

Limitations:

  • At-home collection can be less forgiving if you rush the process
  • If your goal is a single, ultra-deep yearly snapshot, some venous-based platforms may feel more complete

Tip: Treat it like a lab day. Hydrate, follow fasting instructions, avoid a brutal workout right before collection, and keep conditions consistent across retests.

OneTwenty (formerly Outlive.bio)

OneTwenty is the “full system” approach. Instead of stopping at results, it bundles testing with action tools like coaching, supplements, and clinical pathways.

What you get:

  • Multiple comprehensive blood panels per year (often positioned as 2–4 rounds depending on plan)
  • AI-driven insights, plus coaching support through chat
  • Personalized supplement packs and additional tools (for example, a smart scale)
  • Access to prescriptions in certain cases (for example, GLP-1s, HRT, TRT) when clinically appropriate

Collection experience:

  • Blood draws through a wide network of lab locations
  • Some plans offer at-home draw add-ons for convenience

Who it’s best for:

  • People who want “data plus execution,” not just dashboards
  • Anyone overwhelmed by biomarker results who wants a guided path from numbers to decisions

Strengths:

  • One of the most implementation-forward models in this space
  • Bundling can reduce decision fatigue because it packages testing and follow-through

Limitations:

  • It’s a newer platform, so feature sets and workflows may evolve
  • As with any bundled model, value depends on whether you’ll actually use the coaching and action tools

Tip: If you choose an all-in-one platform, commit to one measurable outcome per quarter (ApoB down, fasting insulin down, hs-CRP down, ferritin normalized). Otherwise you’re just collecting pretty graphs.

InsideTracker

InsideTracker is for the “quantified self” crowd. It shines when you already have data, or you want to combine blood testing with genetics and wearables in one ecosystem.

What you get:

  • Blood testing that typically covers 40+ biomarkers depending on the package
  • Membership options that range from uploading existing lab work to recurring in-lab testing tiers
  • An action plan oriented around nutrition, lifestyle, and supplement suggestions

Data integrations (the differentiator):

  • Optional genetic testing through InsideTracker’s kit or uploaded genetic data from consumer providers
  • Wearable integration through common platforms so labs can be interpreted in context (sleep, activity, HRV)
  • An “InnerAge” style biological age estimate, designed to translate lab patterns into something more intuitive

Who it’s best for:

  • People who want a strong analysis layer over time
  • Anyone with existing labs who wants a system to consolidate and interpret them

Strengths:

  • Excellent for integrating multiple data sources
  • Flexible entry point, from “upload only” to frequent testing

Limitations:

  • Coaching and clinical support are not the core of the product
  • Higher tiers can get expensive if you want frequent testing

Tip: If you’re using a platform like this, upload at least 12 months of labs if you have them. Trendlines reveal far more than a single measurement.

Targeted At-Home Test Kits (Lower Cost, Narrower Scope)

Targeted kits are best when you have one specific question.

Think “Is my thyroid off?” not “Give me a complete longevity map.” They tend to be cheaper, easier to collect (often finger-prick, saliva, or urine), and faster to act on. The tradeoff is you’re seeing a narrow slice of the health picture, so interpretation depends heavily on context, symptoms, and what else is going on.

If you’re new to testing, targeted kits can be a smart first step. If you’re optimizing for longevity or prevention, a comprehensive panel usually gives you better leverage.

Everlywell

Everlywell is the “big menu” brand. It’s best when you want an affordable entry point and the ability to pick from a wide range of tests without committing to a full biomarker membership.

What you can test:

  • Hormone and reproductive health panels
  • Thyroid screening
  • Cholesterol and lipid markers
  • HbA1c and diabetes screening style tests
  • Vitamin and nutrient checks
  • Additional specialty tests depending on the current catalog

Collection and processing:

  • Most kits use finger-prick blood or saliva, depending on the marker
  • Samples are processed through CLIA-certified labs and results are generally delivered in a few business days
  • Results are typically physician-reviewed, with a dashboard designed for easy interpretation

Who it’s best for:

  • People with a single goal (thyroid check, lipid check, A1c check)
  • Anyone who wants a low-friction first step into biomarkers

Strengths:

  • One of the widest test selections and lowest barriers to entry
  • User-friendly experience and straightforward ordering

Limitations and watch-outs:

  • These are generally “results plus guidance,” not full physician consultations
  • Certain test types in the industry (for example some IgG-based food sensitivity formats) are scientifically controversial, so treat them as signals for experimentation, not a medical verdict

Tip: Use targeted kits as a decision filter. If something flags, follow up with repeat testing or clinician-directed labs before making big health decisions.

LetsGetChecked

LetsGetChecked is the targeted testing pick for people who want clinical support baked in. The headline difference is that physician consultations are included, which can reduce the “Now what?” feeling after you open results.

What you can test:

  • A broad targeted menu, including hormone panels, general health markers, and STI testing

Collection and processing:

  • Kits can use finger-prick blood, saliva, or urine depending on the test
  • Samples are processed in a CLIA-certified laboratory and results are typically returned in a few days

Support model (why people choose it):

  • Physician consultations included on results
  • For certain positive STI results, treatment pathways may be available depending on the service area and clinical eligibility
  • Many users value the added nursing support layer for reassurance and follow-through

Who it’s best for:

  • People who want a targeted test but also want a clinician in the loop
  • Anyone who wants help deciding whether a result needs retesting, treatment, or deeper workup

Strengths:

  • Strong support infrastructure compared to results-only kits
  • Clinically oriented workflow that focuses on next steps

Limitations:

  • Fewer à la carte options than the biggest menu brands
  • Pricing can be higher, especially for more comprehensive targeted panels

Tip: If you’re choosing LetsGetChecked, write down your questions before you test. The consult is most valuable when you show up with context, symptoms, and goals.

imaware

imaware is the validation-forward choice. It’s known for being one of the few at-home blood testing platforms with peer-reviewed validation published in a clinical chemistry journal, which is rare in this category.

What you can test:

  • A curated set of clinically oriented tests, including testosterone, heart health panels, thyroid, vitamin D, diabetes screening, celiac disease, STI testing, and allergy-style panels

Collection and processing:

  • Typically finger-prick blood collection for many panels
  • Samples are processed through CLIA-certified and CAP-accredited labs, which adds another layer of quality signaling

Who it’s best for:

  • People who prioritize method rigor and validation over having the biggest test catalog
  • Anyone who wants targeted labs but wants to avoid the “wellness score” vibe

Strengths:

  • Strong scientific credibility relative to most consumer testing brands
  • Focused, clinical-style panels

Limitations:

  • Smaller menu than mass-market competitors
  • Less emphasis on personalized recommendations or lifestyle programming

Tip: If you care about accuracy, consistency still matters. Retest under similar conditions (fasted state, time of day, training load) so changes reflect biology, not noise.

Gut Microbiome Tests

Microbiome testing is best viewed as a structured experimentation tool. It can help you form hypotheses about food tolerance, fiber response, and gut ecosystem balance, then run a cleaner “test and learn” loop.

A quick decoder ring for the tech:

  • 16S sequencing is older and cheaper. It’s useful for broad bacterial patterns, but has limited resolution.
  • Shotgun metagenomics (DNA) is deeper. It can identify a wider range of organisms, but DNA doesn’t tell you whether microbes are active.
  • Metatranscriptomics (RNA) aims to show what microbes are doing right now, which can be more actionable.

No matter the method, results are not diagnoses. They’re directional signals that can inform diet experiments, symptom tracking, and follow-up care.

Viome

Viome is one of the most technology-forward microbiome platforms. It uses AI-driven metatranscriptomics (RNA sequencing), which aims to capture not only which microbes are present, but which ones are actively producing metabolites. That “activity” layer is the key reason people choose it over DNA-only options.

What you get:

  • A gut microbiome report paired with food guidance designed around your microbial activity signals
  • Optional upgraded packages that add additional sample types (depending on the current offering)
  • Subscription paths that can include custom-formulated supplements and periodic retesting

Who it’s best for:

  • People who want actionable food guidance and are willing to iterate
  • Anyone who prefers a more “systems” interpretation rather than a list of bacteria

Strengths:

  • One of the most advanced sequencing approaches in consumer gut testing
  • Recommendations tend to be framed as practical, experimentable steps

Limitations and watch-outs:

  • Subscription models can add up over time
  • Microbiome recommendations are probabilistic. The best outcomes come from pairing them with symptom tracking and disciplined re-testing

Tip: Don’t change everything at once. Pick 1–2 variables (fiber target, fermented foods, polyphenol intake) and retest after 8–12 weeks.

Tiny Health

Tiny Health uses deep shotgun metagenomics (DNA-based sequencing) to profile bacteria and other organisms in the gut. It originally built its reputation in pregnancy and infant microbiome testing, then expanded into adult gut options.

What you get:

  • A deep microbiome profile designed to surface patterns you can act on through diet and lifestyle
  • Optional coaching add-ons depending on the package

Who it’s best for:

  • People who want a DNA-deep microbiome profile and are comfortable waiting longer for results
  • Anyone interested in microbiome changes across life stages (for example pregnancy, postpartum, early childhood, then adult tracking)

Strengths:

  • Deeper sequencing than 16S-style tests
  • Strong fit for families who want consistent testing across stages

Limitations and watch-outs:

  • Turnaround can be slower than many competitors
  • DNA-based profiles can identify microbes that are present but not necessarily active

Tip: Microbiome testing is most useful when you pair it with a simple tracker (stool consistency, bloating, energy, skin, cravings). Otherwise you’re looking at a map with no compass.

Other Microbiome Options (Quick View)

BrandMethodTypical StrengthTradeoff
Ombre16S sequencingOften cheaper entryLess depth than shotgun methods
BIOHMDNA-based approachIncludes fungi angleLess standardized across the space
FloréWhole genome + custom blendsCustom probiotic formulationsPremium pricing

Accuracy, Regulation, and the “Can I Trust This?” Question

There’s a big difference between a cheap retail self-test and a lab-processed kit.

CLIA-Certified Processing

CLIA (Clinical Laboratory Improvement Amendments) is the U.S. framework that regulates clinical lab testing to support accurate, reliable, and timely results.

In practice, it means a lab has to meet standards for quality systems, personnel qualifications, and ongoing performance monitoring.

That’s why it’s a good sign when your kit is processed through a CLIA-certified laboratory, including Jinfiniti’s high-complexity CLIA lab.

The 2025 BMJ Warning About DIY Tests

In 2025, two BMJ papers raised concerns about many over-the-counter self-tests sold in retail settings.[1][2]

The key takeaway was not “all at-home testing is bad.” It was simpler: cheap, off-the-shelf tests often had weak evidence, confusing instructions, or poor guidance on what to do next.

Lab-processed platforms are different because you’re relying on regulated lab systems, not only a consumer-operated strip test.

Finger-Prick vs Venous Draw

Venous draws are often the precision leader.

Capillary tests can still be useful for trend tracking, especially when you repeat under similar conditions.

If you’re comparing results over time, consistency is your best friend.

  • Test at the same time of day when possible
  • Follow fasting instructions
  • Avoid heavy training right before the draw
  • Retest borderline results instead of spiraling over one number

How to Choose the Best At-Home Health Test Kit for You

Start with your goal. Everything gets easier after that.

If Your Goal Is Longevity and Aging Tracking

Pick a panel that includes advanced cardiovascular risk markers and aging-related signals.

  • Jinfiniti AgingSOS Ultimate Panel is built for this use case.
  • Broad wellness panels can still help, but they may miss the rarer longevity markers.

If You Want a Big Annual Health Snapshot

Choose a comprehensive blood platform.

  • Function Health is often chosen for breadth.
  • OneTwenty can be appealing if you want bundled action tools.

If You Want Frequent Tracking Without Lab Visits

At-home recurring testing models can make compliance easier.

  • SiPhox Health is built around repeatable at-home collection.

If You Have One Specific Question

Go targeted.

  • Everlywell and LetsGetChecked are often used for narrow testing needs.
  • imaware can be a strong fit if validation is your top concern.

If Your Symptoms Are Gut-Centered

Microbiome testing can help you build a structured elimination and reintroduction plan.

  • Viome emphasizes activity-based insights.
  • Tiny Health emphasizes deep DNA-based profiling.

What to Do After You Get Your Results

The real win is not the PDF. It’s the loop.

  1. Pick one focus area (metabolic health, inflammation, lipids, micronutrients, hormones).
  2. Make one meaningful change you can stick to for 6 to 12 weeks.
  3. Retest strategically, not impulsively.
  4. Escalate to a clinician if you see red flags or symptoms that need medical evaluation.

If you’re using a longevity panel like AgingSOS, the best approach is simple: baseline, intervene, and retest on a schedule that matches your goals.

FAQ

Are at-home health test kits accurate?

They can be, especially when the sample is processed by a CLIA-certified laboratory and you follow collection instructions carefully.

What does “CLIA-certified lab” mean?

CLIA is the U.S. regulatory program that sets standards for clinical lab testing quality. CLIA-certified labs are required to meet defined requirements for reliability and oversight.

Is finger-prick blood as accurate as a venous blood draw?

Venous draws typically have higher precision. Finger-prick data can still be useful for screening and trend tracking when you test consistently.

How often should you retest biomarkers?

Many people retest every 3 to 12 months depending on the goal. If you’re making a focused intervention, 8 to 12 weeks is often enough to see direction.

Which at-home test is best for longevity tracking?

Look for panels that include advanced cardiovascular risk markers and aging-related signals. Jinfiniti’s AgingSOS Ultimate Panel is built specifically for longevity and prevention.

Can these tests diagnose disease?

No. They can highlight risk signals or abnormal values, then guide follow-up with a clinician.

What should you do if a result is out of range?

Retest if the result is borderline or unexpected, and talk with a clinician if it’s meaningfully abnormal or you have symptoms.

Are gut microbiome tests actually useful?

They can be useful for structured experimentation with diet and lifestyle. Treat them as directional tools, not definitive diagnoses.

Why are some cheap retail self-tests unreliable?

Some rely on weaker evidence, unclear instructions, or poor guidance on interpretation and next steps. Lab-processed testing tends to be more robust.

Do you need to fast before at-home blood testing?

Often yes, especially for lipids, glucose, and insulin-related markers. Always follow the kit’s instructions.

Bottom Line

If you want the most longevity-relevant picture, you’ll get more value from panels built around aging mechanisms and processed at a regulated lab, not a basic retail test.

If you want a broad annual snapshot, comprehensive blood platforms can cover a lot of ground.

If you want to track change week-to-week or month-to-month, convenience matters more than perfect comprehensiveness.

Referenced Sources

  1. Davenport C, Richter A, Hillier B, Scandrett K, Agarwal R, Baldwin SW, et al. Direct-to-consumer self-tests sold in the UK in 2023: cross sectional review of information on intended use, instructions for use, and post-test decision making. BMJ; 2025. https://doi.org/10.1136/bmj-2025-085546
  2. Hillier B, Deeks JJ, Alderman J, Kale AU, Macdonald T, Baldwin SW, et al. Direct-to-consumer self-tests sold in the UK in 2023: cross sectional review of regulation and evidence of performance. BMJ; 2025. https://doi.org/10.1136/bmj-2025-085547
Estradiol (E2) Testing Featured Image

Estradiol (E2) Blood Test: How It Works and Normal Levels

Estradiol (E2) is the main estrogen doctors measure in a standard blood test to evaluate estrogen levels and overall reproductive health. It plays a huge role in ovulation, menstrual cycle timing, bone health, and many “why do I feel off?” hormone questions.

The tricky part is that estradiol is supposed to change. A normal result on day 3 of your cycle can look “low” on day 14, and a normal result during ovulation can look “high” compared to most lab printouts.

What You Should Know

  • Estradiol changes a lot across the menstrual cycle, so timing matters.
  • “Normal” ranges depend on your sex, age, cycle phase, pregnancy status, and hormone medications.
  • At very low levels (often in men and postmenopause), test method matters and some assays read higher than reality.
  • Estradiol makes the most sense when you interpret it with FSH, LH, and symptoms, not as a single number.

CLIA-Certified Biomarker Panel

Get clarity into your hormones.

Jinfiniti AgingSOS green gradient background

What is Estradiol (E2)?

Estradiol is the most biologically active form of estrogen circulating in your blood. In premenopausal women, most estradiol is produced by the ovaries, with smaller contributions from the adrenal glands and fat tissue.

In men and postmenopausal women, estradiol is usually made by converting testosterone and other hormones into estrogen through an enzyme called aromatase. That’s why body composition, medications, and liver health can influence levels.

How the Estradiol Blood Test Works

An estradiol blood test is a simple blood draw. A laboratory measures the amount of estradiol in serum (the liquid portion of a blood sample). Results are commonly reported in pg/mL (picograms per milliliter). Some labs report pmol/L, and a rough conversion is pg/mL × 3.67 = pmol/L.

Immunoassay vs LC-MS/MS (why it matters)

Not all estradiol tests measure low levels equally well.

  • Immunoassays are widely used and work well for higher estradiol concentrations (common in reproductive-age peaks).
  • LC-MS/MS (mass spectrometry) is often preferred when estradiol is expected to be low, such as in men, postmenopause, or people using aromatase inhibitors (see ARUP Consult’s comparison of estrogen testing methods).

If you are tracking small changes at low levels, it’s worth asking which method your lab uses.

Why You Might Need an E2 Test

A glowing, semi-transparent lily flower in shades of pink and purple, symbolizing women's hormonal health.

Estradiol is ordered for more than fertility. It’s also a “context clue” in broader hormone evaluation.

Common reasons clinicians check estradiol include:

  • Cycle timing and ovulation questions, especially with irregular periods
  • Fertility evaluation, infertility workups, and IVF monitoring, often paired with FSH and LH
  • Amenorrhea (missing periods) or very infrequent periods
  • Menopause transition questions when symptoms and timing are unclear
  • Gynecomastia (breast tissue in men) or unexpected feminizing symptoms
  • Puberty evaluation concerns, including precocious puberty (early puberty) in children, when clinically indicated
  • Therapy monitoring: hormone therapy (including estrogen therapy) or medications that block estrogen production

If you’re also looking at thyroid and adrenal factors that can affect cycles, you may see estradiol ordered alongside a TSH blood test, a T4 (thyroxine) test, or a DHEA-S test.

Normal Estradiol Levels (E2)

As noted by UCSF Health, estradiol reference ranges vary by lab. They also vary by cycle phase, which is the biggest reason people get confused by their results.

Here are typical estradiol ranges you’ll see in many lab references. Treat these as general guideposts, then use your lab’s flagged range and your timing to interpret the result.

Group / timingTypical estradiol range (pg/mL)What that usually means
Adult male~10–50Lower baseline production, mostly from aromatization
Premenopausal, early follicular (roughly day 2–5)~20–150Baseline level before a dominant follicle ramps up
Premenopausal, mid-cycle peak (around ovulation)~150–650Often the highest point of the cycle
Premenopausal, luteal phase (after ovulation)~30–450Supported by the corpus luteum, then falls before a period
Postmenopausal~0–30 (often <10 on sensitive assays)Ovarian production has largely shut down

A simple way to think about cycle changes

Early in the cycle, estradiol starts relatively low. It rises as follicles grow, then peaks around ovulation.

After ovulation, estradiol typically dips and rises again during the luteal phase, then falls before menstruation if pregnancy does not occur.

When to Test (Timing is Everything)

Before you interpret estradiol, pin down the timing. A number without context is like a timestamp without a date.

Common timing choices

  • Cycle baseline: Many fertility workups measure estradiol early in the cycle (often around day 2–3) with FSH.
  • Ovulation tracking: Estradiol can be checked around the expected ovulation window, usually alongside LH.
  • Luteal phase questions: If symptoms suggest low luteal support, clinicians may focus on progesterone and sometimes estradiol after ovulation.

If you’re not cycling regularly, your clinician may use ultrasound or additional labs to interpret where you are in the cycle.

How to Prepare for an Estradiol Blood Test

Most of the time you do not need to fast. The bigger issue is making sure your provider and lab know what could skew interpretation.

Before your blood draw, consider this checklist:

  • List hormone meds and contraceptives. Oral estrogen, patches, injections, and some fertility meds can raise estradiol.
  • Mention testosterone or DHEA use. These can change estradiol through conversion.
  • Ask about high-dose biotin. Some immunoassays can be affected by biotin supplements. If you take it, ask your lab whether you should pause before testing (see AACC guidance on biotin interference).
  • Try to use the same lab and method if you are trending results over time.

High Estradiol vs Low Estradiol (What Test Results Mean)

Estradiol is a “why” hormone. Your test results are the start of the story, not the ending.

High estradiol

High estradiol can be normal, especially at mid-cycle or in pregnancy. Outside of expected contexts, a high result can be linked to:

  • Estrogen therapy or fertility medications
  • Higher aromatase activity (often influenced by body fat)
  • Liver conditions that change hormone metabolism
  • Rarely, estrogen-producing tumors (evaluated with imaging and other labs)

A single high result is not a diagnosis. Timing, symptoms, and repeat testing matter.

Low estradiol

Low estradiol is common after menopause. In premenopausal women, low estradiol can be seen with:

  • Hypothalamic amenorrhea (stress, under-fueling, excessive exercise)
  • Pituitary signaling issues
  • Primary ovarian insufficiency
  • Postpartum or breastfeeding changes
  • Medications that suppress estrogen production

This is where pairing estradiol with other hormones helps. A high FSH with low estradiol can point toward ovarian causes, while low or normal FSH/LH with low estradiol can point toward hypothalamic or pituitary suppression.

If prolactin is part of your workup (common in irregular cycles), see our guide to the prolactin blood test.

Accuracy Notes (Why Two E2 Tests Might Not Match)

Estradiol testing is not perfectly standardized across all labs. One reason is that different assays and calibration approaches can produce slightly different numbers, which is why efforts like the CDC’s Hormone Standardization (HoSt) Program for steroid hormones exist. That’s why you can see slightly different numbers when you switch locations, methods, or reference ranges.

Low-level estradiol is where differences show up the most. If you are postmenopausal, male, or using an estrogen-blocking medication, consider asking whether LC-MS/MS is available for more reliable low-level measurement.

Dr. Jin-Xiong She, founder of Jinfiniti Precision Medicine, puts it simply: “Estradiol is a context hormone. The number tells a better story when you know the timing and the assay.”

Frequently Asked Questions

What’s the difference between estrogen and estradiol?

“Estrogen” is a family of hormones. Estradiol (E2) is the most active and the most commonly measured in blood testing.

Can I test estradiol on any day of my cycle?

Yes, but interpretation depends on timing. If you don’t know your cycle day or you have irregular cycles, your clinician may pair estradiol with FSH, LH, and other markers to estimate what’s happening.

What is a normal estradiol level in menopause?

Postmenopausal estradiol is typically low, often under 30 pg/mL, and sometimes under 10 pg/mL on sensitive assays. Your lab’s reference range is the best guide.

Why would estradiol be high but FSH is normal?

Timing is the first thing to check. Mid-cycle estradiol can be high while FSH stays within a reference interval. Medications, body composition, and lab method can also play a role.

Which estradiol test is best?

For many routine checks, standard immunoassays are fine. If very low levels matter (men, postmenopause, aromatase inhibitors), LC-MS/MS is often the better choice.

The Bottom Line

Estradiol is one of the most useful hormone tests, but only when you interpret it in context. Match the result to your cycle timing (or life stage), use your lab’s reference range, and consider method differences if you are tracking low levels.

If your symptoms and results don’t line up, the next best step is usually a repeat test with better timing and a fuller hormone picture.

A pregnant woman receiving progesterone test results

Progesterone Test: What It Measures and Normal Levels

Progesterone is the hormone that quietly runs the second half of your menstrual cycle. After ovulation, it rises to prepare the uterine lining for a possible pregnancy, then drops again if pregnancy doesn’t happen.

Because of this on-off pattern with progesterone, your number from a progesterone blood test isn’t inherently “good” or “bad.” It’s often just a timestamp. 

What You Should Know

  • A progesterone blood test measures progesterone in your bloodstream (serum progesterone).
  • In cycling women, progesterone is low before ovulation and higher after ovulation.
  • The “normal range” depends on your cycle phase or pregnancy trimester.
  • If timing is off by a few days, the result can look “abnormal” even when your hormones are working normally.

CLIA-Certified Longevity Testing

Understand your hormones with the Ultimate Longevity Panel.

Jinfiniti AgingSOS green gradient background

What Does a Progesterone Blood Test Measure?

A progesterone test measures the level of progesterone (a steroid hormone) circulating in your blood.

Clinicians use serum progesterone lab testing to evaluate ovulation timing and support early pregnancy assessment when symptoms or history suggest it may be helpful.

Why Doctors Order a Progesterone Test

Progesterone testing is most useful when your clinician is trying to answer a specific question. These are the most common ones.

Did you ovulate?

If you’re trying to conceive, the test is often used as an ovulation confirmation. Progesterone should rise after ovulation because the corpus luteum (the structure left behind after the egg is released) starts producing progesterone.[1]

This is why many fertility clinics test progesterone about 7 days after ovulation (often around cycle day 21 for a 28-day cycle).

Is progesterone high enough to support early pregnancy?

In early pregnancy, progesterone supports implantation and helps maintain the uterine lining.

Low progesterone can show up in several situations, including:

  • threatened miscarriage (bleeding/cramping)[2]
  • suspected ectopic pregnancy[3]
  • pregnancy after fertility treatment, where clinicians are monitoring support therapy

If pregnancy symptoms overlap with thyroid symptoms (fatigue, mood changes, sleep disruption), pairing this context with thyroid markers can be helpful. Our TSH blood test ranges guide explains why thyroid labs can look “normal” even when you feel off.

Why are cycles irregular or bleeding abnormal?

Progesterone helps stabilize the uterine lining after ovulation. If you don’t ovulate regularly, progesterone often stays low, and you may see:

  • irregular cycles
  • mid-cycle spotting
  • heavier or unpredictable bleeding

Because hormones rarely act alone, it can be useful to look at related markers of inflammation and nutrient status that can influence cycles and ovulation.

For example, chronic inflammation shows up in labs like CRP levels and sometimes broader immune markers like cytokine testing.

When Should You Get a Progesterone Test?

Progesterone changes quickly. Timing is the difference between a useful result and a misleading one.

If you’re testing for ovulation

Ask your clinician which method you’re using to time the draw:

  • Cycle-day timing (commonly day 21 in a 28-day cycle)
  • “7 days after ovulation” timing (more accurate if your cycle isn’t 28 days)
  • LH surge timing if you use ovulation predictor kits

Progesterone typically peaks in the mid‑luteal window, which is why timing the draw to your ovulation day (not just calendar day 21) matters.

If you’re testing during pregnancy

Progesterone is sometimes checked in early pregnancy when there’s bleeding, a history of miscarriage, or a need to monitor progesterone therapy.

Because levels vary widely, clinicians usually interpret results with symptoms, ultrasound findings, and other labs rather than relying on a single number.

Normal Progesterone Levels (Chart)

Progesterone reference ranges vary by lab and test method. The table below shows the most common clinical reference intervals.

Units: ng/mL (nanograms per milliliter)

Group / timingTypical reference range (ng/mL)
Men0.0–0.5
Women, follicular phase (before ovulation)0.1–0.9
Women, ovulatory phase0.1–12.0
Women, luteal phase (after ovulation)1.8–23.9
Pregnancy, 1st trimester11.0–44.3
Pregnancy, 2nd trimester25.4–83.3
Pregnancy, 3rd trimester58.7–214.0
Postmenopause0.0–0.1

(These intervals vary by lab and method. Use the reference range shown on your report as the final authority.)

A quick reality check about “normal”

If your blood draw happened too early (before progesterone rises) or too late (after it starts falling), your result may sit outside the expected range even if you ovulated.

That’s why many clinicians repeat progesterone or pair it with other tracking data (LH surge, basal body temperature, ultrasound, or a full hormone panel).

What High Progesterone Levels Can Mean

High progesterone is most common in pregnancy, where it naturally rises by trimester.

Outside pregnancy, elevated progesterone can sometimes be associated with:

  • ovarian cysts
  • adrenal gland disorders[4]
  • rarer hormone-producing tumors

High progesterone outside pregnancy is uncommon, but it can show up with certain ovarian cysts or adrenal hormone disorders.

If a “high” result surprises you, ask two questions first:

  • Were you pregnant or possibly pregnant?
  • Was the blood draw done after ovulation (when progesterone is supposed to be higher)?

What Low Progesterone Levels Can Mean

Low progesterone can mean very different things depending on context.

If you’re not pregnant

A low mid-luteal progesterone can suggest:

  • you did not ovulate that cycle (anovulation)
  • ovulation happened later than expected and the test was early
  • a short luteal phase (progesterone drops earlier than expected)

Symptoms that often travel with chronically low progesterone include:

  • irregular periods
  • spotting before a period
  • sleep disruption
  • hot flashes (in perimenopause)

If you are pregnant

In early pregnancy, low progesterone can be one sign clinicians consider when evaluating:

  • ectopic pregnancy
  • threatened miscarriage

That doesn’t mean the test alone can diagnose those conditions. It’s one data point, and it needs to be interpreted alongside symptoms, ultrasound, and other labs.

What Affects Progesterone Levels (and Test Results)

Even with perfect timing, these factors can shift progesterone or how it reads.

  • Cycle variability: stress, travel, illness, and perimenopause can delay ovulation.
  • Medications: progesterone or progestin-containing therapy (including some fertility protocols) can raise levels.
  • Body composition and energy balance: extreme calorie restriction or heavy training can disrupt ovulation.
  • Nutrient status: cholesterol is the building block for steroid hormones, and B-vitamin status can influence hormone metabolism and methylation pathways.

If you’re digging into nutrient-related testing, our guide on Vitamin B3 testing and our breakdown of homocysteine testing are good next reads.

When to Talk to a Clinician

Progesterone testing is simple. Interpreting it can be tricky.

Consider a medical review if you have:

  • cycles that are consistently irregular
  • repeated early pregnancy loss
  • bleeding with pregnancy symptoms
  • severe pelvic pain, dizziness, or shoulder pain (possible ectopic emergency)

If you’re working with a clinician, bring the timing details with you:

  • first day of your last period
  • estimated ovulation day or LH surge day
  • whether you’re using hormonal medications

That context makes the lab far more useful.

Hormone Testing and Beyond with Jinfiniti

Too often clinicians focus on one lab value without seeing the forest through the trees.

Here’s how Jinfiniti founder Prof. Jin-Xiong She, PhD, frames it:

“A progesterone result is only as smart as the timing behind it. If you don’t know where you are in your cycle, the number can’t tell the right story.”

That mindset matches the way we at Jinfiniti approach biomarkers across the board: test with precision, interpret with context, then act on the insights.

Looking for a comprehensive overview of hormones? The AgingSOS® Ultimate Panel includes several crucial hormone biomarkers into one easy-to-read report.

If reproductive health is your focus, you may also like our article on NAD and NMN supplements and fertility, which walks through research on cellular energy and egg quality.

Referenced Sources

Triiodothyronine (T3) Test: What It Measures and Normal Ranges

Triiodothyronine (T3) Test: What It Measures and Normal Ranges

The T3 thyroid function test measures thyroid hormone levels. Your doctor orders it when they suspect hyperthyroidism or are monitoring treatment. However, using the test to diagnose hypothyroidism is strongly discouraged.

If your doctor ordered this blood test, here’s what it measures and what your results mean.

What You Should Know

  • T3 is the active thyroid hormone, but 80% of it is produced outside your thyroid gland through conversion from T4
  • Normal ranges vary by age and laboratory, with children having higher levels than adults
  • This test is mainly used to diagnose and monitor hyperthyroidism, not hypothyroidism
  • Biotin supplements can cause false results and should be stopped 2-3 days before testing

CLIA-Certified Longevity Testing

Check your thyroid health with our Ultimate Longevity Panel.

Jinfiniti AgingSOS green gradient background

What Does a T3 Blood Test Measure?

T3 (triiodothyronine) is your body’s most active thyroid hormone. It governs metabolism, energy production, and many other cellular functions.

Here’s a fun fact about T3 that most people don’t know: although your thyroid produces both T4 and T3, the vast majority of T4 gets converted to T3 by enzymes known as deiodinases.

20% of your circulating T3 comes directly from secretion by your thyroid gland.

That’s why we say that T3 is “downstream” from T4. Your thyroid makes mostly T4 and uses it like a storage form to convert to T3 where it’s needed in your tissues.

Over 99% of circulating T3 is bound to proteins. Only 0.3% remains as Free T3 available to enter cells and cause a biological effect.

When Do Doctors Order a T3 Test?

The primary indication for T3 testing is to diagnose and classify hyperthyroidism (overactive thyroid). It’s ordered when TSH is suppressed and your doctor wants more information about your thyroid status.

The classic scenario is called T3-toxicosis. This happens when TSH is low or undetectable, free T4 is normal, but T3 is elevated.

Patients with T3-toxicosis frequently have early Graves disease or an autonomously functioning thyroid nodule. Without ordering a T3 test, these patients would be undiagnosed for thyroid disease.

Hyperthyroidism affects about 1.2% of the U.S. population, split between overt (0.5%) and subclinical (0.7%) cases.[1]

T3 testing also helps monitor hyperthyroidism treatment. Some patients normalize their free T4 sooner than T3 during antithyroid drug therapy or after radioiodine treatment.

Persistent T3 elevation can indicate ongoing thyrotoxicosis even when other markers improve.

When T3 Testing Doesn’t Help

Major endocrine guidelines give a Grade A recommendation against using T3 to diagnose hypothyroidism. The American Association of Clinical Endocrinologists and American Thyroid Association are explicit about this.[2]

Why? T3 often remains normal in mild primary hypothyroidism.

Your body compensates by increasing TSH-driven stimulation and ramping up deiodinase activity. This preserves T3 levels even as T4 falls.

Low T3 is also common in severe illness without any actual thyroid disorder. This pattern, called non-thyroidal illness syndrome (NTIS), can confuse diagnosis and lead to inappropriate treatment.

Total T3 vs Free T3: Which Test Do You Need?

Most clinical guidelines prefer total T3 over free T3 testing for routine practice. The reason comes down to test reliability.

Free T3 immunoassays are less well-validated than free T4 assays. They’re more vulnerable to method-dependent bias and interference from medications or supplements.

Total T3 measures both bound and free hormone combined. It’s widely available, relatively stable, and supported by decades of clinical validation.

Free T3 reflects only the unbound, biologically active fraction. In theory, this should be more meaningful than total T3.

But in practice, the assay limitations often outweigh the theoretical advantage.

What About Reverse T3?

Reverse T3 (rT3) is an inactive form produced when T4 is broken down along an inactivation pathway. It rises during severe illness and stress.

The American Thyroid Association’s patient guidance states clearly that rT3 measurement is not clinically useful in healthy, non-hospitalized people for determining whether hypothyroidism exists.[3]

Some practitioners order rT3 to evaluate “adrenal fatigue” or chronic fatigue syndrome. Current evidence doesn’t support this use.

What Are Normal T3 Levels?

T3 reference ranges vary by laboratory, testing method, and age group. There are no universal cutoffs.

The ranges below come from major clinical laboratories and population studies.

Total T3 Normal Ranges

Age GroupNormal Range (ng/dL)
Children100-260
Adults (general)75-200
Women70-180

Free T3 Normal Ranges by Age

Age GroupNormal Range (pg/mL)
Newborns1.5-4.2
1-5 years2.6-5.1
6-10 years2.7-5.2
11-18 years2.8-4.4
18-30 years2.3-4.2
31-60 years2.3-4.1
60+ years2.0-3.8

Free T3 levels decline naturally with age. This physiological change is normal and doesn’t necessarily indicate thyroid disease.

TSH levels also tend to rise slightly in older adults.

Why Your Lab Might Use Different Ranges

Reference intervals depend on the assay platform, calibration method, and population studied. Until testing methods are standardized across laboratories, you’ll see variation.

Always interpret your results using the reference range printed on your lab report.

More importantly, T3 should never be interpreted in isolation. Doctors evaluate it alongside TSH and free T4 to understand the complete picture.

A high T3 with suppressed TSH and normal free T4 tells a different story than high T3 across the board.

🧬 MORE BIOMARKER TESTING

  • T4 converts to T3 in your tissues. Learn about T4 (thyroxine) testing and how it works with T3.
  • Hormone imbalances affect each other. See how prolactin levels interact with thyroid function.
  • Complete hormone assessment reveals the full picture. Discover what DHEAS testing shows about adrenal and metabolic health.

How to Prepare for a T3 Test

A T3 test requires a blood sample drawn from your arm. No fasting is required.

The most important preparation happens before you reach the lab.

Understanding how T3 works with other thyroid markers helps put your results in context. TSH testing serves as the first-line screening for thyroid problems.

Stop Biotin Supplements

Biotin (vitamin B7) is the leading cause of misleading thyroid test results. It interferes with many immunoassays and can make results appear falsely normal or abnormal.

The American Thyroid Association recommends stopping biotin for at least 2 days before thyroid testing. Some laboratories recommend 72 hours or longer, especially for high-dose supplements.

Studies show that even 10mg daily can interfere with TSH, free T4, and T3 measurements.[4]

If you take a multivitamin, check the label. Many contain biotin at doses high enough to cause interference.

Time Your Thyroid Medication

If you take levothyroxine (T4), have your blood drawn before taking your morning dose. Levels can rise transiently after ingestion, which skews results.

If you take liothyronine (T3) or combination preparations, timing matters even more. Serum T3 can spike 2-5 hours after taking thyroid extract.

The half-life of liothyronine varies widely among individuals, from 6 to 22 hours.

Standardize your blood draw timing. Drawing just before your morning dose (a trough level) gives the most consistent results for monitoring.

Disclose Pregnancy and Illness

Pregnancy changes thyroid hormone binding proteins, which shifts total T3 levels even when thyroid function is normal. Tell your doctor if you’re pregnant or taking estrogen therapy.

Recent serious illness can lower T3 through non-thyroidal illness syndrome. This doesn’t mean your thyroid is failing.

Your doctor needs this context to interpret results correctly.

When T3 Results Can Be Misleading

Several factors can cause T3 results that don’t match your true thyroid status.

Biotin Interference

This deserves repeating because it’s so common. High-dose biotin supplements can cause falsely low or falsely high results depending on the assay design.

If your results don’t make clinical sense and you take biotin, repeat the test after stopping the supplement for at least 72 hours.

Non-Thyroidal Illness Syndrome

Severe illness, surgery, or critical care hospitalization can lower T3 without true hypothyroidism. Reverse T3 often rises while T3 falls.

This represents a metabolic adaptation to stress. Treatment with thyroid hormone hasn’t shown clear benefit in this setting.

The pattern usually resolves as you recover from the underlying illness.

Binding Protein Changes

Pregnancy, liver disease, and certain medications change the proteins that bind thyroid hormones. This shifts total T3 levels.

Free T3 measurements are supposed to avoid this problem. But as mentioned earlier, free T3 assays have their own reliability issues.

This is why doctors prefer total T3 but interpret it in clinical context.

Medication Effects

Beyond thyroid medication timing, other drugs can affect T3 levels. Steroids, beta-blockers, and amiodarone all influence thyroid hormone metabolism.

Bring a complete medication list to your appointment.

Understanding Your Test Results

Your doctor will interpret T3 alongside other thyroid markers. Here’s what different patterns mean:

TSHFree T4T3What It Means
LowNormalHighClassic T3-toxicosis pattern requiring workup for Graves disease or toxic nodules
LowHighHighOvert hyperthyroidism from multiple possible causes
Normal or HighLowLowCould be hypothyroidism (check free T4) or non-thyroidal illness (T3 drops first during illness)
NormalNormalLowOften non-thyroidal illness or medication effect rather than true thyroid disease

Dr. Jin-Xiong She, founder of Jinfiniti Precision Medicine, emphasizes the importance of comprehensive testing. “Thyroid function exists on a spectrum,” he explains. “A single marker rarely tells the complete story. We need to see how TSH, T4, and T3 work together to understand cellular health.”

When results don’t align with symptoms or other lab values, your doctor might order retesting using a different assay method or recommend specialist evaluation.

The Bigger Picture: Thyroid Health and Longevity

T3 is one piece of your thyroid puzzle. Complete thyroid assessment includes TSH, free T4, thyroid antibodies, and sometimes additional markers depending on your clinical picture.

Understanding your thyroid status matters because thyroid hormones affect every cell in your body. They regulate metabolism, energy production, body temperature, heart rate, and cognitive function.

Testing gives you data to make informed decisions rather than guessing about supplementation or treatment.

Jinfiniti’s AgingSOS Ultimate Panel includes comprehensive thyroid markers as part of a complete longevity assessment. These panels measure NAD+, inflammatory markers, cardiovascular risk factors, and metabolic health alongside thyroid function.

This integrated approach lets you see how different biological systems interact and identify areas for optimization before symptoms develop.

Referenced Sources

  1. Ross DS, Burch HB, Cooper DS, Greenlee MC, Laurberg P, Maia AL, et al. 2016 American Thyroid Association Guidelines for Diagnosis and Management of Hyperthyroidism and Other Causes of Thyrotoxicosis. SAGE Publications; 2016. https://doi.org/10.1089/thy.2016.0229
  2. Garber JR, Cobin RH, Gharib H, Hennessey JV, Klein I, Mechanick JI, et al. Clinical Practice Guidelines for Hypothyroidism in Adults: Cosponsored by the American Association of Clinical Endocrinologists and the American Thyroid Association. Elsevier BV; 2012. https://doi.org/10.4158/ep12280.gl
  3. Leung AM. A High Proportion of Serum rT3 Tests Are Ordered by a Relatively Small Number of Providers in a U.S.-Wide Sample. SAGE Publications; 2018. https://doi.org/10.1089/ct.2018;30.337-339
  4. Ylli D, Soldin SJ, Stolze B, Wei B, Nigussie G, Nguyen H, et al. Biotin Interference in Assays for Thyroid Hormones, Thyrotropin and Thyroglobulin. SAGE Publications; 2021. https://doi.org/10.1089/thy.2020.0866
T4 (Thyroxine) Blood Test

T4 (Thyroxine) Blood Test: What It Measures and Normal Ranges

A T4 blood test measures thyroxine, the main hormone your thyroid gland produces. Doctors use this thyroid function test to diagnose thyroid disorders, monitor treatment, and catch problems that TSH testing alone might miss.

Your thyroid makes T4 as an inactive storage form that must convert to active T3 before your cells can use it. Testing both TSH and T4 together gives a complete picture of thyroid health.

Low T4 levels can explain persistent fatigue, brain fog, weight gain, and metabolic problems even when TSH looks normal. High T4 levels signal an overactive thyroid that needs treatment.

What You Should Know

  • Free T4 tests measure usable thyroid hormone, while total T4 includes inactive, protein-bound hormone
  • Normal ranges shift dramatically from infancy through old age and during pregnancy
  • Biotin supplements create falsely abnormal results that mimic serious thyroid disease
  • Taking your thyroid medication before the test skews results and leads to incorrect dosing

CLIA-Certified Longevity Testing

Check your thyroid health with our Ultimate Longevity Panel.

Jinfiniti AgingSOS green gradient background

What is a T4 Test and What Does it Measure?

A T4 test measures thyroxine, the primary hormone your thyroid gland produces. Your thyroid makes T4 using iodine and the amino acid tyrosine through a process orchestrated by an enzyme called thyroid peroxidase.

About 90% of what your thyroid secretes is T4. However, T4 isn’t active. It’s a storage hormone that needs to be converted into the active hormone T3 (triiodothyronine) in your liver, kidneys and other tissues before being used by cells throughout your body.

Your blood contains two forms of T4:

  • Bound T4: Between 99.9% and 99.97% is bound to transport proteins like thyroxine-binding globulin (TBG), transthyretin, and albumin. This bound pool acts as a reservoir, protecting your body from sudden hormone swings.
  • Free T4: Only the tiny free (unbound) fraction can enter cells or convert to active T3.

That’s why measuring free T4 gives a more accurate picture of thyroid function than measuring total T4.

Think of bound T4 as money in a savings account and free T4 as cash in your wallet. You need savings for stability, but only the cash you can actually spend affects your day-to-day life.

Free T4 vs. Total T4: Which Test Is Better?

Your doctor can order two different T4 tests, and the distinction matters for accurate diagnosis.

Total T4 measures everything, both protein-bound and free hormone. Free T4 measures only the unbound, biologically active fraction. Free T4 is preferred for diagnosing hypothyroidism because it reflects the hormone available to your tissues.

Here’s why that preference exists:

Test TypeWhat It MeasuresAffected by Protein Changes?Best Use
Total T4Bound + free hormoneYes, highly sensitive to TBG fluctuationsScreening when free T4 unavailable
Free T4Unbound hormone onlyMinimally, reflects true tissue statusDiagnosis and monitoring

Why protein binding matters:

Pregnancy, birth control pills, liver disease, and certain medications dramatically change TBG levels. This shifts total T4 up or down while free T4 stays normal. Testing the wrong marker leads to misdiagnosis.

A pregnant woman might have total T4 that looks high but free T4 that’s perfectly normal. Her body simply made more binding protein to support the pregnancy. Treating her for hyperthyroidism based on total T4 alone would be dangerous.

The 2021 ASCO guidelines specifically recommend free T4 over total T4 for this reason. You want to know how much hormone your cells can actually use, not how much is sitting in storage.

Why Your Doctor Orders a T4 Test

Doctors typically order T4 testing for four main reasons:

1. Follow up on an abnormal TSH result

TSH tells you something is wrong with your thyroid axis, but T4 reveals the severity and helps pinpoint where the problem lives.

2. Monitor thyroid medication

If you’re taking levothyroxine for hypothyroidism, your doctor checks both TSH and free T4 every 6 weeks after dose changes and annually once you’re stable. The T4 level shows whether your replacement dose is working.

3. Diagnose the type and severity of thyroid dysfunction

  • High TSH with low free T4 = primary hypothyroidism (underactive thyroid)
  • Low TSH with high free T4 = hyperthyroidism (overactive thyroid)

The T4 number tells your doctor how aggressive treatment needs to be.

4. Catch central hypothyroidism

This is the overlooked one. When your pituitary or hypothalamus fails to produce enough TSH or TRH (thyrotropin-releasing hormone), your thyroid gets no signal to make hormone. TSH might be low, normal, or only slightly elevated while free T4 is severely deficient.

Relying solely on TSH screening misses these patients. That’s why many laboratories now run TSH and free T4 together as a first-line test.

You might also get T4 testing if you’re on immune reconstitution therapy for multiple sclerosis or being monitored for thyroid cancer recurrence.

Normal T4 Ranges by Age and Life Stage

Thyroid hormone needs change dramatically from birth through old age. Using a one-size-fits-all reference range leads to misdiagnosis at both ends of life.

Pediatric ranges:

Newborns experience a TSH surge after birth that temporarily elevates T4. This is a necessary part of brain development. These levels are highest in the first month and decline continuously through childhood and adolescence.[1]

AgeFree T4 (ng/dL)TSH (mU/L)
At birth1.1 – 4.23.84 – 11.75
1 month0.8 – 2.81.18 – 3.57
1 year0.8 – 2.81.17 – 3.55
5 years0.8 – 2.81.15 – 3.47
12 years0.8 – 2.11.09 – 3.31
16-17 years (male)0.8 – 2.81.05 – 3.16
16-17 years (female)0.8 – 1.51.05 – 3.16
Adult (>18 years)0.9 – 1.70.4 – 4.1

Pregnancy ranges:

Pregnancy creates its own set of complications. Your body needs 40% to 100% more thyroid hormone to support both you and your developing baby.

Key changes during pregnancy:

  • Estrogen surges increase TBG, raising total T4
  • Human chorionic gonadotropin (hCG) acts as a weak TSH mimic, temporarily suppressing TSH while elevating T4

Trimester-specific reference ranges are required to avoid misdiagnosis:[2]

Pregnancy StageTSH (mIU/L)Free T4 (pmol/L)Total T4 (μg/dL)
First Trimester0.1 – 2.512.2 – 20.85.9 – 12.9
Second Trimester0.2 – 3.010.8 – 20.77.4 – 15.2
Third Trimester0.3 – 3.09.5 – 16.07.9 – 14.9

Thyroid hormone deficiency during the first trimester increases risks of low fetal intelligence, nervous system problems, and stillbirth.

Elderly ranges:

Older adults present another diagnostic challenge. Analysis of the NHANES III database shows the upper limit of normal TSH increases from 3.5 mIU/L in 20-29-year-olds to 7.5 mIU/L in those over 80.[3]

This rise may be adaptive. Studies suggest that as TSH declines within the normal range in elderly people, mortality risk actually increases.

Treating a mildly elevated TSH in an 85-year-old with normal free T4 might do more harm than good.

How to Prepare for Your T4 Test

Most T4 tests require no fasting, but several preparation steps are critical for accurate results. Your doctor will order a blood sample drawn from a vein in your arm, typically at a lab or medical office.

Stop biotin supplements 2 to 5 days before testing:

This is not optional. Biotin (vitamin B7) interferes with laboratory assays that use biotin-streptavidin technology. Hair, skin, and nail supplements often contain 5,000 to 10,000 mcg of biotin, well above the 30 mcg recommended daily allowance.[4]

Excess biotin disrupts the binding of immune complexes to magnetic microparticles in the lab test. This creates:

  • Falsely low TSH
  • Falsely high free T4 and free T3
  • A biochemical pattern that perfectly mimics hyperthyroidism or Graves’ disease

Patients have been wrongly diagnosed with serious thyroid conditions and even scheduled for surgery based on biotin-skewed results. Some researchers suggest even a single 10 mg dose can produce inaccurate results for up to 24 hours.

Additional preparation steps:

  • Delay your morning levothyroxine dose until after the blood draw (taking it before causes a transient free T4 peak that doesn’t reflect your steady-state level)
  • Use the same laboratory for repeated tests when possible (different labs use different assays with slightly different reference ranges)
  • Tell your doctor about all medications and supplements you take

🧬 MORE BIOMARKER TESTING

  • TSH testing reveals pituitary function. Understanding TSH blood test ranges helps you interpret T4 results correctly.
  • Prolactin affects thyroid hormone balance. High prolactin can interfere with thyroid function—learn about prolactin blood test levels.
  • Hormone imbalances often occur together. Check your DHEAS levels alongside thyroid tests for complete endocrine health.

What Can Affect Your T4 Results?

A vast array of medications and health conditions can interfere with T4 testing.

Medications that reduce thyroid hormone absorption:

If you take levothyroxine with any of these, your body gets less hormone than the dose suggests, potentially elevating TSH:

  • Proton pump inhibitors (PPIs)
  • Calcium carbonate
  • Ferrous sulfate
  • Sucralfate

Medications that change binding protein levels:

These affect total T4 while free T4 stays normal:

  • Increase TBG (raising total T4): Estrogens, birth control pills, tamoxifen, methadone
  • Decrease TBG (lowering total T4): Androgens, anabolic steroids, glucocorticoids

Medications that displace T4 from proteins:

These create falsely elevated free T4 readings:

  • Heparin
  • High-dose salicylates (over 2 grams daily)
  • High-dose furosemide (over 80 mg IV)
  • NSAIDs

Special medication considerations:

Amiodarone, a common heart rhythm medication, deserves special mention. It contains 37% iodine by weight and blocks the conversion of T4 to T3 in tissues. This creates complex patterns, either amiodarone-induced hypothyroidism or thyrotoxicosis, that confuse diagnosis.

Anticonvulsants like phenytoin and carbamazepine speed up how fast your liver metabolizes thyroid hormones. This drops both total and free T4 even though you’re clinically euthyroid (normal thyroid function).[5]

How liver disease affects T4:

Your liver converts most T4 to T3 and makes TBG. In cirrhosis:

  • Free T3 drops significantly
  • Free T4 and TSH often stay normal or slightly elevated
  • Some patients need higher levothyroxine doses because impaired bile secretion reduces tablet absorption

How kidney disease affects T4:

Chronic kidney disease (CKD) creates multiple problems:

  • Impaired kidney function means less iodine excretion, which can trigger hypothyroidism through the Wolff-Chaikoff effect (iodine overload)
  • CKD reduces deiodinase enzyme production, causing “low T3 syndrome” where T4 doesn’t convert properly
  • Lower free T4 levels in CKD patients are associated with worse kidney function and higher mortality risk[6]

Severe illness effects:

Non-thyroidal illness syndrome (NTIS) or “euthyroid sick syndrome” occurs during critical illness, starvation, or trauma. Your body downregulates the thyroid axis to conserve energy.

The most common finding is low T3, but when T4 drops too, the prognosis is grim. When total T4 falls below 3 μg/dL, mortality risk is about 50%. Below 2 μg/dL, the risk exceeds 80%.

Understanding Your T4 Test Results

Free T4 results make sense only in the context of TSH levels.

Common test result patterns:

TSH LevelFree T4 LevelDiagnosisWhat It MeansCommon Symptoms
HighLowPrimary hypothyroidismYour thyroid gland isn’t making enough hormone, so your pituitary pumps out more TSH trying to stimulate itFatigue, cold intolerance, low heart rate, weight gain
Low or normalLowCentral hypothyroidismYour pituitary or hypothalamus isn’t signaling properly, so your thyroid doesn’t get the message to produce hormoneSame as primary hypothyroidism, but often missed if only TSH is checked
LowHighHyperthyroidismYour thyroid is overproducing hormone, so your pituitary shuts down TSH to try slowing itUnexplained weight loss, rapid or irregular heartbeat, increased bowel movements
NormalAbnormalEarly disease or binding issuesCan happen early in disease or during recovery from illness; may signal protein binding problems rather than true thyroid dysfunctionVariable depending on underlying cause

The T4 to T3 conversion problem:

“T4 is not an active substance. It needs to be activated in the body by conversion into T3,” explains Dr. Antonio Bianco, a leading thyroid researcher at the University of Chicago. About 15% of hypothyroid patients on standard levothyroxine therapy have T3 levels below the normal range despite “normal” TSH and T4. This happens because their bodies don’t convert T4 to T3 efficiently.

A genetic polymorphism in the DIO2 gene makes it harder for some people to convert T4 to T3. “This deficiency can be aggravated, in some people, because the deiodinase does not function well due to a genetic polymorphism,” notes Dr. Bianco. These patients need combination T4/T3 therapy, not just T4 alone.

Reverse T3 considerations:

Some practitioners also measure reverse T3 (rT3), an inactive byproduct of T4 metabolism. Under high stress, fasting, or chronic illness, your body preferentially converts T4 into rT3 rather than active T3. High rT3 can compete with T3 at cellular receptors, creating hypothyroid symptoms even when TSH and T4 look normal.

When “Normal” Isn’t Optimal

The debate over optimal versus normal thyroid ranges continues to evolve.

Conventional labs use reference ranges like 0.9 to 1.7 ng/dL for free T4 and 0.4 to 4.5 mIU/L for TSH. Functional medicine practitioners often aim for narrower targets:

  • Free T4 in the upper third of the range (1.2 to 1.8 ng/dL)
  • TSH between 1.0 and 2.0 mIU/L

They argue that many patients at the low-normal end of conventional ranges still suffer brain fog, fatigue, and metabolic dysfunction.

Recent research complicates the picture. A systematic review in Lancet Diabetes Endocrinology found that people with free T4 in the 20th to 40th percentile of normal had the least risk of death and heart disease.[7] Those in the 80th to 100th percentile (high-normal) showed:

  • 57% higher risk of heart disease-related death
  • 22% higher risk of heart disease
  • 34% higher risk of death from any cause

This suggests that pushing free T4 into the high-normal range, especially in older adults, may be counterproductive.

Normal ranges represent population averages, not individual optimization. Some people feel great at the low end. Others need levels in the upper third. Testing, symptoms, and individual response matter more than hitting an arbitrary target.

Test Your Thyroid Health with AgingSOS

Your thyroid controls energy production, metabolism, brain function, and cellular repair. A comprehensive thyroid panel reveals the complete picture.

The AgingSOS® Ultimate Panel includes TSH, free T3, and free T4—the three markers you need to understand thyroid function fully. You’ll also get 45 additional biomarkers covering inflammation, metabolic health, cardiovascular risk, and cellular aging.

This is the most complete longevity assessment available. You get precise NAD+ measurement, rare markers like Klotho, senescence indicators, and advanced cardiovascular testing—all from a single blood draw.

Every panel includes a free expert consultation to interpret your results and create a personalized optimization plan. Mobile phlebotomy is available if you prefer testing at home.

Referenced Sources

  1. Soldin OP, Jang M, Guo T, Soldin SJ. Pediatric Reference Intervals for Free Thyroxine and Free Triiodothyronine. SAGE Publications; 2009. https://doi.org/10.1089/thy.2009.0037
  2. Alexander EK, Pearce EN, Brent GA, Brown RS, Chen H, Dosiou C, et al. 2017 Guidelines of the American Thyroid Association for the Diagnosis and Management of Thyroid Disease During Pregnancy and the Postpartum. SAGE Publications; 2017. https://doi.org/10.1089/thy.2016.0457
  3. Sheehan MT. Biochemical Testing of the Thyroid: TSH is the Best and, Oftentimes, Only Test Needed – A Review for Primary Care. Marshfield Clinic Research Institute; 2016. https://doi.org/10.3121/cmr.2016.1309
  4. Effraimidis G, Maria Hilsted L, Feldt-Rasmussen U. Biotin Use Can Interfere with the Management of Thyroid Diseases, Including Thyroid Cancer. SAGE Publications; 2021. https://doi.org/10.1089/ct.2021;33.520-522
  5. Dong BJ. How medications affect thyroid function. BMJ; 2000. https://doi.org/10.1136/ewjm.172.2.102
  6. Narasaki Y, Sohn P, Rhee CM. The Interplay Between Thyroid Dysfunction and Kidney Disease. Elsevier BV; 2021. https://doi.org/10.1016/j.semnephrol.2021.03.008
  7. Xu Y, Derakhshan A, Hysaj O, Wildisen L, Ittermann T, Pingitore A, et al. The optimal healthy ranges of thyroid function defined by the risk of cardiovascular disease and mortality: systematic review and individual participant data meta-analysis. Elsevier BV; 2023. https://doi.org/10.1016/s2213-8587(23)00227-9

Account Access

Welcome back

Continue your health journey with a secure login.