
Secure • Private • Science-backed
A woman with bloating after her workout

Bloated After a Workout? Here’s What’s Actually Happening

You finish a good session, glance in the mirror, and your stomach looks rounder than when you walked in. The waistband feels tighter. You worked hard, you maybe even skipped the post-gym snack, and somehow you look puffier.

Here’s the reassuring part. Feeling bloated after working out is common, and it almost never means you gained fat. What you’re seeing is some mix of water, swallowed air, and your body’s normal repair response to exercise. Most of it clears within a day or two on its own.

The useful question isn’t whether post-workout bloating is normal. It usually is. The better question is which of these six things is driving it for you, and which fixes actually move the needle.

What You Should Know

  • Looking bloated after a workout is usually fluid and air, not fat gain.
  • Hard exercise causes small amounts of muscle swelling and water retention that fade in 24 to 48 hours.
  • How and what you eat and drink around training has a big effect on gut bloating.
  • Puffiness that’s constant, one-sided with sharp pain, or paired with sluggish recovery is worth a closer look.

Is It Fat or Just Bloat?

Before blaming the workout, it helps to separate two different things your mirror lumps together: a puffy gut and puffy muscles. They feel similar but come from different places, and they clear on different timelines.

Bloat is fluid and air, not fat

Fat gain takes a sustained calorie surplus over days and weeks. A rounder belly that shows up within an hour of training and settles by the next morning is fluid shifting around, not new fat. Short-term swings on the scale follow the same rule. Anything that appears fast and reverses fast is water.

Is it your gut or your muscles?

Gut bloating sits in your abdomen and often comes with gas, pressure, or burping. Muscle puffiness shows up in the area you just trained, like fuller-looking arms after a pressing session or tighter legs after squats. You can have both at once, which is why the post-workout reflection can feel dramatic even when nothing is wrong.

The 6 Reasons You Look Bloated After Working Out

Most post-workout bloating traces back to one of these six causes. Several can stack on the same day, so don’t be surprised if more than one applies to you.

1. Your muscles are swollen from the work itself

When you train, especially with weights or anything new, you create microscopic damage in the muscle fibers. Your body responds with a brief inflammatory repair process that pulls blood and fluid into the area. In one controlled study, eccentric arm exercise produced measurable swelling, soreness, and a spike in muscle-damage markers for several days afterward.

That’s the “pump” you see right after lifting, plus a slower, lingering fullness over the next day or two. It’s a sign of recovery, not damage you need to worry about.

2. Is glycogen pulling water into your muscles?

Yes, and it’s one of the most overlooked reasons people look fuller after training. Your muscles store carbohydrate as glycogen, and glycogen doesn’t sit there dry. Research in human muscle shows that each gram of glycogen is stored with at least 3 grams of water.

As your body restocks glycogen after a workout, it parks water alongside it. Translation: refueling your muscles also rehydrates them, which can read as puffiness on the surface.

3. You swallowed more air than you think

Breathing hard through your mouth, gulping water mid-set, and even talking between reps all send extra air into your digestive tract. That trapped air expands the stomach and creates real bloating. Reviews of athletes find that swallowed air and exercise itself are common triggers of upper-gut symptoms, including a self-limited side stitch known as exercise-related transient abdominal pain.

The harder and longer the session, the more air tends to accumulate. Straws and carbonated drinks beforehand make it worse.

4. Did your gut get put on hold?

During hard effort, your body reroutes blood away from digestion and toward your working muscles and skin. Gastrointestinal complaints are common as a result, affecting roughly 30 to 50 percent of athletes, and that reduced gut blood flow is one of the main drivers. The effect is stronger when you go in underhydrated.

With digestion slowed, whatever is in your stomach sits longer and ferments, which produces gas and a heavy, distended feeling. This is why a big or high-fiber meal right before training so often backfires.

5. You drank too little, or too much

Hydration cuts both ways. Go in dehydrated and your body holds onto water and slows digestion, both of which can leave you puffy. Overdo it in the other direction and you create a different problem. Drinking large volumes of plain water during long sessions can dilute your sodium and cause your body to retain fluid, a condition called exercise-associated hyponatremia that shows up in endurance events.

The sweet spot is steady, moderate intake with electrolytes, not a race to chug as much water as possible.

6. Are your hormones holding onto water?

Hard or prolonged exercise raises hormones that tell your kidneys to hold water, including the antidiuretic hormone that limits how much fluid you flush out afterward. That temporary fluid retention is part of normal recovery. Hormones also explain why this isn’t the same for everyone. Estrogen shapes both fluid balance and the body’s hormonal response to exercise, which is one reason many women notice more post-workout puffiness at certain points in their cycle or during perimenopause.

How to Fix Bloating After Working Out

You can’t switch off your body’s repair response, and you wouldn’t want to. But most of the gut-related bloating is very manageable once you know the levers. Here’s where to start.

Time your pre-workout meal

Give yourself two to three hours between a full meal and a hard session so digestion isn’t competing with your muscles. If you need fuel closer to training, keep it small and simple: easy carbs over high-fat, high-fiber, or heavy protein, which sit longer in a slowed gut. Skip carbonated drinks and straws beforehand to cut down on swallowed air.

Should you change how you drink?

Sip steadily rather than gulping, and add electrolytes for longer or sweatier sessions instead of relying on plain water alone. Sodium, potassium, and magnesium help your body manage fluid where it belongs. If you tend to feel puffy and crampy, a mineral gap is worth ruling out before you blame the workout.

Does it clear on its own?

In most cases, yes. The muscle swelling and glycogen-bound water that make you look fuller typically settle within 24 to 48 hours as your body finishes restocking and rebalancing. Gentle movement, like a walk the next day, helps fluid drain. Time and consistency do most of the work.

When Post-Workout Bloating Is Worth a Closer Look

Routine puffiness is one thing. A pattern that doesn’t fit the usual timeline is another, and that’s where paying attention pays off.

When is post-workout bloating normal?

It’s normal when it’s mild, shows up after harder or newer workouts, and fades within a day or two. It’s also normal for it to come and go as your training and hydration change week to week. None of that needs fixing beyond the basics above.

Signs worth getting checked

Talk with your clinician if swelling is sharp, sudden, and one-sided, especially after a twist or pop, which can point to an injury rather than ordinary recovery. The same goes for puffiness that keeps getting worse over several days instead of better, bloating that has nothing to do with exercise, or distension that comes with pain, vomiting, or blood. These are out of the ordinary and deserve a real evaluation.

The case for measuring inflammation

Here’s the precision angle most articles skip. If you’re consistently puffy and slow to bounce back, session after session, the issue may not be the workout at all. Lingering swelling and poor recovery can reflect higher background inflammation, which is measurable rather than something to guess at. Looking at markers like CRP alongside other root causes turns a vague “why am I always puffy” into a clear answer. It’s also a useful moment to understand your cellular energy and NAD levels, since recovery capacity depends on them, and to consider supplements that target chronic inflammation only once you know it’s actually elevated.

“A puffy reflection after a hard workout is usually water finding its way back out of your cells over the next day or two. The person I pay attention to is the one who stays puffy and slow to recover week after week. That pattern is rarely about the workout. It’s a signal to measure inflammation and see what the body is actually doing.” — Dr. Jin-Xiong She, founder of Jinfiniti Precision Medicine

Stress hormones feed into this too. If your training is intense and your recovery is poor, it can be worth learning how to test your cortisol levels so you’re acting on data instead of assumptions.

🧬 Related Reading

Frequently Asked Questions

Is it normal to look bloated after every workout?

For many people, yes. Some post-workout fullness comes from blood and fluid moving into worked muscles, plus normal water retention during recovery. If it’s mild and fades within a day or two, it’s nothing to worry about.

How long does post-workout bloating last?

Most muscle swelling and glycogen-related water settle within 24 to 48 hours. Gut bloating from swallowed air or a pre-workout meal often clears within a few hours. Puffiness that drags on for days, or keeps worsening, is worth a closer look.

Can drinking more water reduce workout bloating?

Steady, moderate hydration helps, especially if you tend to train underhydrated. But chugging large amounts of plain water can backfire by diluting your sodium and causing fluid retention. Pair water with electrolytes for longer sessions and sip rather than gulp.

Does looking bloated after a workout mean I gained weight?

No. Fat gain requires a sustained calorie surplus over days and weeks. A rounder belly that appears within an hour of exercise and reverses by the next morning is water and air, not fat.

Should I take a diuretic for post-workout water retention?

Routine post-workout puffiness clears on its own and doesn’t call for a water pill. Diuretics can disrupt the electrolyte balance you’re trying to protect, so talk with your clinician before using one, particularly if you train hard or sweat heavily.

References

  • O’Fallon KS, Kaushik D, Michniak-Kohn B, Dunne CP, Zambraski EJ, Clarkson PM. Effects of quercetin supplementation on markers of muscle damage and inflammation after eccentric exercise. Int J Sport Nutr Exerc Metab. 2012;22(6):430-437. doi:10.1123/ijsnem.22.6.430
  • Fernández-Elías VE, Ortega JF, Nelson RK, Mora-Rodriguez R. Relationship between muscle water and glycogen recovery after prolonged exercise in the heat in humans. Eur J Appl Physiol. 2015;115(9):1919-1926. doi:10.1007/s00421-015-3175-z
  • de Oliveira EP, Burini RC, Jeukendrup A. Gastrointestinal complaints during exercise: prevalence, etiology, and nutritional recommendations. Sports Med. 2014;44(Suppl 1):S79-S85. doi:10.1007/s40279-014-0153-2
  • Waterman JJ, Kapur R. Upper gastrointestinal issues in athletes. Curr Sports Med Rep. 2012;11(2):99-104. doi:10.1249/JSR.0b013e318249c311
  • Rosner MH. Exercise-associated hyponatremia. Phys Sportsmed. 2008;36(1):55-61. doi:10.3810/psm.2008.12.12
  • Kraemer RR, Francois M, Castracane VD. Estrogen mediation of hormone responses to exercise. Metabolism. 2012;61(10):1337-1346. doi:10.1016/j.metabol.2012.03.009

A woman with brain fog after eating holds her head

Brain Fog After Eating: Why Meals Can Leave You Mentally Drained

What You Should Know

  • Brain fog after eating is distinct from ordinary post-meal tiredness — it involves slowed thinking, difficulty concentrating, and reduced processing speed, not just drowsiness.
  • Blood sugar spikes and crashes are a common trigger, but don’t explain why fog persists in people who already eat low-glycemic, balanced meals.
  • Mitochondria require NAD+ to convert glucose into usable brain energy — when NAD+ is depleted, that conversion stalls regardless of what you ate.
  • Persistent post-meal fog is worth measuring, not just eating around.

You ate a reasonable meal — maybe some pasta, a sandwich, a normal lunch. Thirty minutes later, you’re at your desk and your thinking has turned to mud. Words are slower, concentration is gone, and a task that should take 10 minutes is taking 45.

Post-meal brain fog — sometimes called postprandial cognitive impairment — is a real and measurable phenomenon, and the causes are more layered than most explanations acknowledge. Blood sugar gets most of the attention. For many people, though, the bottleneck is happening deeper, at the level of cellular energy conversion itself.

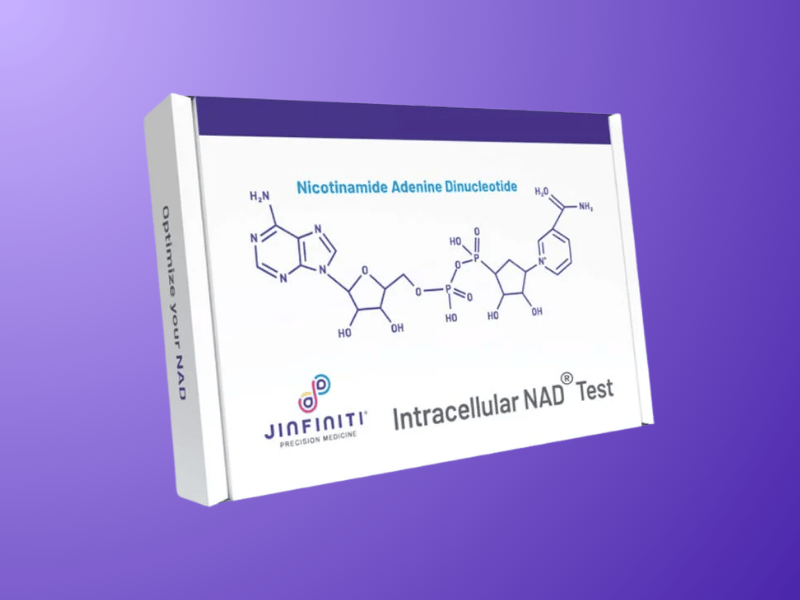
CLIA-Certified NAD Blood Test

Find out if your NAD+ is in the healthy range.

Jinfiniti Intracellular NAD Test on purple background

What Is Post-Meal Brain Fog, Exactly?

Post-meal fatigue and post-meal brain fog are not the same thing, and conflating them points toward the wrong fixes.

Post-meal fatigue is largely physical: heaviness, drowsiness, the pull toward a couch. That’s normal to a degree, driven by blood flow shifting toward digestion and certain amino acids (like tryptophan from protein) crossing into the brain.

Post-meal brain fog is cognitive. A 2007 study tracking postprandial glycemia and cognitive function in healthy middle-aged adults found measurable declines in processing speed, attention, and working memory after meals — with sharper glucose drops producing worse cognitive outcomes. And a 2025 study in Medicina found that gastrointestinal symptom severity was positively correlated with brain fog scores, with gut health serving as a significant predictor of cognitive symptoms after meals.

If you’re losing your train of thought mid-sentence or feel like you’re thinking through wet cement for an hour or two after eating, that pattern is the one worth understanding.

How Long Does Post-Meal Brain Fog Last?

Typically 1–3 hours, depending on the trigger and your baseline metabolic health. Blood sugar-driven fog tends to peak 30–60 minutes after eating and clears as glucose restabilizes. Inflammation-driven fog — from food sensitivities — can persist several hours longer.

If it’s happening consistently after most meals, that frequency is itself a data point. It means something in the energy conversion process isn’t keeping pace with demand.

Why Does Blood Sugar Only Tell Part of the Story?

Blood sugar is the most frequently cited cause of post-meal brain fog, and the mechanism is real.

When you eat refined carbohydrates — white bread, pasta, processed foods, added sugar — glucose enters the bloodstream rapidly. The pancreas releases insulin to clear it. If that response overshoots, blood glucose drops sharply, and the brain — which consumes roughly 20% of the body’s total energy and runs almost exclusively on glucose — finds itself temporarily underfueled. That’s what produces the fog.

The problem is that this explanation doesn’t account for people who still experience post-meal fog after cleaning up their diet. The issue in those cases isn’t just upstream (what they’re eating) — it’s downstream: what cells can do with the glucose once it arrives.

Insulin Resistance as an Underlying Cause

When insulin resistance is present, cells become less responsive to insulin’s signals. Glucose circulates in the bloodstream but can’t enter cells effectively — including neurons. The fuel is available but can’t be used.

A 2023 review published in Frontiers in Endocrinology showed that insulin resistance combined with chronic low-grade inflammation disrupts brain function in ways consistent with brain fog symptoms. This matters because according to the CDC, roughly 80% of people with prediabetes don’t know they have it. Post-meal cognitive symptoms can be one of the earliest signs.

Why Doesn’t Low-GI Eating Always Fix It?

The standard advice — lower-glycemic meals, protein and fat to slow glucose absorption, less refined sugar — is sound and does reduce fog frequency for people whose primary issue is blood sugar reactivity. For those whose fog persists despite those changes, the bottleneck is usually cellular, not dietary.

What Role Do Your Mitochondria Play?

Getting glucose into the bloodstream is only the first step. The brain doesn’t run on glucose directly — it runs on ATP, the molecule cells use to power virtually every function. The conversion from glucose to ATP happens inside mitochondria, through a chain of reactions that requires a specific coenzyme at multiple steps: NAD+.

NAD+ and the Mitochondrial Energy Chain

NAD+ (nicotinamide adenine dinucleotide) is an essential electron carrier in mitochondrial energy production. During oxidative phosphorylation — the process by which mitochondria generate the bulk of cellular ATP — NAD+ accepts and transfers electrons down the respiratory chain. When NAD+ is insufficient, that chain slows, ATP output drops, and the brain is among the first organs to register the deficit.

The implication: even after a reasonable meal, if NAD+ levels are too low to support efficient energy conversion, cognitive performance suffers in the postprandial window. The glucose is present. The machinery to process it is underperforming.

What Is NAD and Why Does It Matter for Your Energy? covers the full mechanism in more detail.

Who NAD+ Depletion Hits Hardest

NAD+ declines naturally with age, with levels typically becoming clinically relevant in the 30s and 40s. Metabolic stress, chronic inflammation, poor sleep, and high caloric load all accelerate the decline — conditions that also, predictably, make post-meal brain fog worse.

A 2022 review in Nutrients found that NAD+ depletion is a consistent factor in cognitive decline across multiple conditions, including diabetes and age-related impairment. A separate preclinical study found that restoring NAD+ levels via NMN in diabetic models preserved mitochondrial oxidative phosphorylation function, prevented hippocampal neuron loss, and maintained cognitive performance. These are animal models — human data on NAD+ and post-meal cognition specifically remains limited — but the mechanism is well-established.

“When people tell me they feel mentally sluggish after eating and dietary changes haven’t resolved it, the first question I ask is what their intracellular NAD+ levels look like,” says Dr. Jin-Xiong She, founder of Jinfiniti Precision Medicine. “Glucose metabolism and NAD+ availability are deeply linked. You can’t separate post-meal cognitive energy from what’s happening in the mitochondria.”

What Else Worsens Post-Meal Brain Fog?

The cellular energy bottleneck rarely operates alone. Several common factors compound it, and identifying which ones are active matters for choosing the right response.

CauseTypical PatternWho It Affects Most
Blood sugar crashFog 30–60 min after high-carb meals; clears within an hourAnyone eating refined carbohydrates regularly
Insulin resistanceFog even after moderate meals; worsens over timeAdults 35+, sedentary, metabolically stressed
NAD+ depletionFog despite clean eating; worsens with age or chronic fatigueAdults 40+, anyone with known metabolic decline
Food sensitivityFog 1–4 hours post-meal; tied to specific trigger foodsPeople with gut symptoms or autoimmune history
Cortisol dysregulationFog worse on high-stress days, independent of food choiceChronic stress, poor sleep, shift workers

Food Sensitivities and the Gut-Brain Axis

For people with gluten sensitivity, certain FODMAPs, or lactose intolerance, eating a trigger food initiates an immune response that sends inflammatory signals through the gut-brain axis to the brain. The cognitive effect can outlast blood sugar-related fog by several hours.

An estimated 6% of the population has non-celiac gluten sensitivity, and celiac disease prevalence has risen five-fold over the past 50 years — though many cases go undiagnosed. Identifying sensitivities requires systematic elimination, not intuition.

Chronic inflammatory burden also amplifies the cellular energy problem. The Best Anti-Inflammatory Supplements for Calming Inflammation covers how inflammatory load affects energy and cognition.

How Does Stress Make Post-Meal Fog Worse?

Cortisol, the body’s primary stress hormone, directly regulates blood sugar. When cortisol levels are chronically elevated or following an abnormal diurnal rhythm, glucose management after meals becomes less stable — spikes are more pronounced, and the subsequent drop is steeper.

If post-meal fog reliably worsens on high-stress days regardless of what you eat, cortisol dysregulation may be a primary contributor rather than a secondary one. How to Test Cortisol Levels: Methods, Timing, and Next Steps explains what testing looks like and how to interpret it.

Meal Size and Blood Flow Redistribution

Large meals trigger a significant increase in blood flow to the gastrointestinal tract to support digestion. This transient redistribution can mildly reduce cerebral perfusion at exactly the moment mitochondria are being asked to ramp up ATP production. The effect is minor on its own but amplifies all other causes.

What Actually Helps With Post-Meal Brain Fog?

The right intervention depends on which cause is active. For most people, at least two or three of these factors are overlapping.

Food and Lifestyle Changes to Try First

These apply broadly and carry low risk. Start here before testing or supplementing.

  • Lower the glycemic load of your meals. Replacing refined carbohydrates with whole grains, legumes, and fiber-rich vegetables reduces glucose spikes and smooths the insulin response. This is the most effective starting point for people whose fog correlates with high-carb meals.
  • Add protein and fat to every meal. Both slow gastric emptying and moderate glucose absorption. If your meals are primarily carbohydrate-based, this is an easy adjustment with a measurable effect.
  • Eat smaller portions. This reduces the blood flow redistribution effect and lessens the simultaneous demand on mitochondrial energy systems.
  • Walk for 10 minutes after eating. Postprandial movement significantly improves glucose clearance — a finding that has replicated consistently across studies and requires no equipment.
  • Identify food triggers systematically. If fog follows certain foods reliably, eliminate one at a time and reintroduce after two to three weeks. Avoid eliminating broad food groups simultaneously.

Talk with your clinician before making significant dietary changes, especially if you’re managing a metabolic condition or taking medications that affect blood sugar.

What Should You Do If Diet Changes Don’t Fix It?

If fog persists after a few weeks of dietary adjustment, the problem is most likely cellular rather than dietary — and the appropriate response is measurement, not more elimination.

Intracellular NAD+ levels are measurable through an at-home finger-prick test, the Intracellular NAD panel. Optimal levels fall between 40–100 μM; below that range, mitochondrial energy conversion is likely compromised. This is distinct from what standard blood panels measure — conventional tests don’t assess NAD+ or cellular energy status, which is why post-meal fog so often persists despite “normal” results.

Our article on being tired all the time despite normal blood tests covers why conventional testing misses cellular-level dysfunction, and what to look for instead.

NAD+ supplementation isn’t a solution for everyone with post-meal fog. For people whose fog is primarily driven by food sensitivities or cortisol dysregulation, it won’t be the primary lever. But for those with cellular energy bottlenecks — especially adults over 40 with persistent fog despite a clean diet — measuring NAD+ is the most direct way to know whether mitochondrial function is a limiting factor.

Frequently Asked Questions

Why Do I Get Brain Fog After Eating Carbs?

Refined carbohydrates cause rapid glucose spikes followed by an insulin-driven drop that temporarily cuts the brain’s fuel supply. This is the blood sugar mechanism — the most common explanation and often a real contributing factor. It’s compounded when insulin resistance is present, or when NAD+ levels are too low to efficiently convert the glucose that does make it into cells.

How Long Does Brain Fog After Eating Last?

Typically 1–3 hours. Blood sugar-related fog often resolves within an hour as glucose stabilizes. Inflammation-driven fog from food sensitivities can persist for several hours. Fog lasting consistently beyond 2–3 hours suggests something other than a simple glucose response.

Can Brain Fog After Eating Be a Sign of Something Serious?

Persistent post-meal fog can be an early signal of insulin resistance or prediabetes, conditions most people aren’t aware of until they’re further along. It can also indicate significant NAD+ depletion, thyroid dysfunction, or celiac disease. Consistent symptoms after meals — especially if they don’t improve with dietary changes — are worth evaluating with biomarker testing.

Does Intermittent Fasting Help With Post-Meal Brain Fog?

For some people, yes. Fasting periods allow insulin to reset and may improve insulin sensitivity over time, reducing the severity of post-meal crashes. People who report sharper thinking in a fasted state than after eating are often experiencing a glucose-dependency issue rather than a true cellular energy ceiling — a meaningful distinction for choosing the right intervention.

What Foods Cause the Most Post-Meal Brain Fog?

Refined carbohydrates and added sugar are the most consistent triggers, with cognitive effects peaking 30–60 minutes after eating. Gluten (in people with sensitivity), dairy, and high-FODMAP foods are the next most common culprits. The specific pattern — which foods, how soon afterward, and how long it lasts — is useful diagnostic information worth tracking.

A woman prepares a heart-healthy meal for reducing ApoB levels.

How to Reduce ApoB Levels: Diet, Lifestyle & Supplements

Your ApoB came back elevated. Maybe your doctor flagged it. Maybe you ordered a panel yourself and the number surprised you — especially if your LDL looked unremarkable. Either way, you’re in the right place.

The question you probably have now is the one this article will answer: what actually reduces ApoB, and what order should you tackle it in? The solution is less of a checklist than it is dependent on why your ApoB is high. Two people can have the same ApoB number but have completely different causes — and what works best for one will do little for the other.

What You Should Know

  • ApoB counts every dangerous particle, including LDL, VLDL, and remnant cholesterol — one ApoB per particle, no exceptions.
  • You can have a “normal” LDL and still have high ApoB, meaning standard testing may underestimate your cardiovascular risk.
  • Diet, exercise, and targeted supplementation can meaningfully lower ApoB — but the most effective approach depends on what’s driving your levels.
  • Testing ApoB before and after intervention is the only way to know if what you’re doing is working.

Metabolic Support for Elevated ApoB

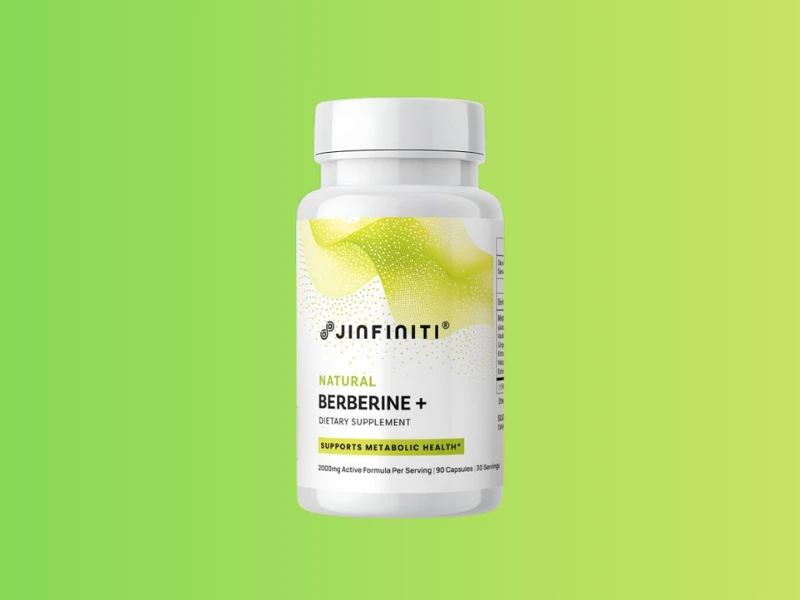
Berberine is clinically shown to lower ApoB, LDL, and triglycerides.

Natural Berberine+ product mockup

What Is ApoB and Why Does It Matter More Than LDL?

Every atherogenic lipoprotein particle — LDL, VLDL, IDL, and remnant cholesterol — carries exactly one molecule of apolipoprotein B on its surface. This means ApoB functions as a direct particle count: the higher your ApoB, the more particles are available to penetrate arterial walls and accelerate plaque buildup.

LDL-C, by contrast, estimates the total cholesterol mass inside LDL particles. That’s a different number, and in a meaningful subset of people, a misleading one. Someone with many small, dense LDL particles can have a normal LDL-C but a high ApoB — and carry substantially more cardiovascular disease risk than their standard results suggest.

A 2025 systematic review in the Journal of Clinical Lipidology, which compiled 15 discordance studies involving 593,354 participants, found that ApoB outperformed LDL-C as a predictor of atherosclerotic cardiovascular disease in every comparison — 9 out of 9 studies.[1]
A 2024 consensus statement published in Circulation reinforced this, noting that in patients where ApoB and LDL-C diverge, only ApoB reliably predicts adverse cardiovascular events.[2]

Despite this evidence, ApoB still isn’t part of standard routine bloodwork for most people. Which means a lot of risk goes undetected.

What’s a Healthy ApoB Level?

ApoB is measured in mg/dL. Based on clinical trial data and expert consensus:

  • Below 80 mg/dL — general population target, associated with lower cardiovascular risk
  • Below 70 mg/dL — recommended for high-risk individuals
  • Below 60 mg/dL — target for very high-risk patients, such as those with existing cardiovascular disease or familial hypercholesterolemia

The National Lipid Association’s Expert Consensus on ApoB supports these thresholds and recommends ApoB measurement not only at baseline but also in patients already on lipid-lowering therapy, where it can identify residual risk that LDL-C misses.[3]

If you haven’t had your ApoB tested, it’s included in Jinfiniti’s AgingSOS panels alongside a broader set of cardiovascular and metabolic biomarkers — which is a more useful context for interpreting the number anyway.

You can learn more about what ApoB testing measures and why it matters before deciding which panel makes sense for you.

What Causes High ApoB Levels?

Before reaching for interventions, it helps to understand what’s actually driving your number. Elevated ApoB has two distinct metabolic profiles, and they respond best to different approaches.

Triglyceride-Driven Elevation (VLDL-Heavy)

When insulin resistance is present, the liver overproduces VLDL particles — which are loaded with triglycerides and each carry one ApoB molecule. More VLDL means more ApoB, even before LDL is considered. This pattern typically shows up as elevated triglycerides alongside high ApoB.

The encouraging news: this type of elevation tends to respond strongly to lifestyle changes. Sugar restriction, reduced alcohol intake, regular exercise, and even modest weight loss can lower VLDL production — and bring ApoB down with it.

LDL Particle-Driven Elevation

Some people have normal or low triglycerides but still carry a high number of LDL particles, reflected in elevated ApoB. This pattern is more influenced by genetics, saturated fat intake, and the composition of dietary fat. It can persist even in people who eat reasonably well and exercise regularly.

Both drivers can coexist. Knowing which is dominant — or whether it’s both — is an argument for testing rather than guessing.

Diet Changes That Lower ApoB

Dietary interventions are the foundation of ApoB management. The most effective changes aren’t about eating less — they’re about shifting the composition of what you eat.

Reduce Saturated Fat and Refined Carbohydrates

Saturated fat raises LDL particle number. Refined carbohydrates and added sugars increase VLDL production by driving insulin resistance. Both push ApoB in the wrong direction.[4]

Research indicates that replacing just 5% of calories from saturated fat with polyunsaturated fat can reduce ApoB by approximately 10%. One underrated swap: replacing unfiltered coffee (French press, espresso) with filtered coffee. Unfiltered coffee contains cafestol and kahweol, compounds that measurably raise both LDL-C and ApoB.[5]

Add Soluble Fiber

Soluble fiber forms a gel in the digestive tract that binds to bile acids and dietary cholesterol, reducing their absorption and prompting the liver to pull more LDL particles from circulation. Oats, barley, beans, lentils, and psyllium husk are the most well-studied sources. Supplemental psyllium at doses of 10–25g/day has been shown to produce meaningful reductions in LDL-C, with likely downstream effects on ApoB.[6]

Increase Omega-3 Fatty Acids

High-dose EPA/DHA — typically 2–4 grams daily — reduces VLDL production in the liver, which is particularly useful in triglyceride-driven ApoB elevation. Fatty fish (salmon, mackerel, sardines) are the food sources with the strongest evidence. For people who don’t eat fish regularly, a quality fish oil supplement provides a consistent dose.[7]

Plant Sterols and Stanols

Plant sterols block cholesterol absorption in the small intestine. A 2014 research review found that up to 3 grams of plant sterols daily can reduce LDL cholesterol levels by roughly 12%. Fortified foods and supplements are the practical sources, since the amounts found in unfortified plant foods are too small to meaningfully affect levels.[8]

Lifestyle Changes With Measurable Impact

Here are some lifestyle changes that have the most impact on lowering your ApoB.

Aerobic Exercise and Resistance Training

Aerobic exercise improves insulin sensitivity, which lowers the VLDL overproduction that drives triglyceride-rich ApoB elevation. Resistance training improves body composition and metabolic function through a different pathway. Both contribute, and the research supports combining them rather than prioritizing one.

High-intensity interval training shows the strongest effect per session in small trials, but consistency over time matters more than intensity. Moderate aerobic activity for at least 12 weeks produces the most consistently replicated ApoB reductions in clinical data.[9]

Weight Loss, Particularly Visceral Fat

Visceral fat — the kind that accumulates around abdominal organs — is metabolically active in ways that subcutaneous fat isn’t. It promotes insulin resistance, increases VLDL production, and drives systemic inflammation that compounds cardiovascular risk. Losing visceral fat, even in modest amounts, has outsized effects on triglycerides and ApoB compared to the same amount of fat lost from elsewhere.[10]

Sleep and Stress

Sleep deprivation worsens insulin sensitivity and disrupts lipid metabolism. Chronic stress elevates cortisol, which over time contributes to insulin resistance and dyslipidemia. Neither of these is a primary lever for ApoB reduction, but both compound the effects of other risk factors — and addressing them makes dietary and exercise interventions work better.[11]

Supplements With Evidence for Lowering ApoB

Supplements don’t replace diet and lifestyle changes. When the foundation is solid, certain supplements can add meaningful reductions on top of it.

Berberine

Berberine activates AMPK — the body’s master metabolic switch — which suppresses the liver’s production of ApoB-containing lipoproteins. It functions through a mechanism similar to metformin, though without the prescription requirement.

A 2023 meta-analysis pooled 18 randomized controlled trials involving 1,788 participants and found that berberine produced significant reductions in ApoB (−0.25 g/L), LDL cholesterol, total cholesterol, and triglycerides. No serious adverse events were reported across the included studies.[12]

The mechanism matters here. Berberine lowers ApoB by reducing the number of particles the liver produces — which is the same upstream target as pharmaceutical lipid-lowering agents. That’s different from simply blocking cholesterol absorption.

Jinfiniti’s Natural Berberine+ combines 1,200mg of high-potency berberine (95%) with a MetabolicAid blend — astragalus, panax notoginseng, ginger, cinnamon, and artichoke leaf — along with black pepper extract for significantly improved absorption. If you’re looking to include berberine as part of a cardiovascular support protocol, see our guide to choosing a berberine supplement for a breakdown of what to look for in a quality formula.

As Dr. Jin-Xiong She, founder of Jinfiniti and researcher behind the company’s supplement formulations, has noted: “Berberine’s ability to activate AMPK means it’s working at a metabolic level — not just masking numbers, but addressing the underlying processes that drive particle overproduction.”

Omega-3 Supplements

If dietary omega-3 intake is inconsistent, supplementing with EPA/DHA at 2–4 grams daily is a practical way to achieve the doses associated with VLDL and ApoB reduction. Quality and purity vary significantly between products — look for third-party testing and triglyceride form for better absorption.

Niacin and Plant Sterol Supplements

Niacin (vitamin B3) can reduce ApoB by 15–25% at therapeutic doses, but it requires medical supervision due to side effects and interactions. Plant sterol supplements offer a more accessible option with a more modest effect size. Red yeast rice deserves an honest note: it contains monacolin K, which functions like a natural statin, but the quality and monacolin content of commercially available products is inconsistently regulated. It may work — the regulatory complexity around it is worth understanding before using it.[13]

When to Consider Medication

Lifestyle changes and supplements can meaningfully lower ApoB, but for some people — particularly those with familial hypercholesterolemia, existing cardiovascular disease, or persistently high levels despite intervention — medication is often necessary and appropriate.

Statins reduce ApoB by 19–42% depending on dose and agent. Ezetimibe blocks intestinal cholesterol absorption and adds further reduction when combined with a statin. PCSK9 inhibitors, typically reserved for high-risk patients who don’t respond adequately to first-line treatment, can achieve 40–56% ApoB reductions.[14]

These aren’t signs of failure. ApoB has a meaningful genetic component, and for many people, medication is the most effective tool available. Your clinician is the right person to evaluate when that threshold has been reached.

🧬 RELATED READING

  • Turmeric’s anti-inflammatory effects may extend to lipid health. Here’s what the research says about turmeric and cholesterol.
  • Niacin is one of the most potent natural tools for improving lipid profiles but carries risks. Read the evidence on niacin for cholesterol before using it.
  • Creatine has an underappreciated relationship with cardiovascular markers. See what the data shows on creatine and cholesterol.

The Case for Measuring ApoB Before and After Intervening

All of the above — the dietary changes, the exercise, the supplements — works best when you can actually see whether it’s working. Without a baseline, you’re making decisions without data. Without follow-up testing, you have no way to know if your ApoB responded, plateaued, or needs a different approach.

ApoB is available through most commercial laboratories and is included in Jinfiniti’s AgingSOS® Advanced Panel, which also measures 27 additional biomarkers — including inflammatory markers, heart health indicators, and the longevity protein Klotho.

For those managing cardiovascular health risk as part of a broader longevity protocol, having ApoB in context with other markers gives you a much clearer picture of where to prioritize. The approach that’s most likely to produce durable results is the one that’s least common: measure first, intervene precisely, then measure again to see what moved.

Frequently Asked Questions

How long does it take to lower ApoB?

Meaningful dietary changes typically produce measurable ApoB reductions within 6–12 weeks. Berberine trials in the clinical literature have run for as short as 4 weeks with measurable effects. Medication produces faster reductions, often within 4–8 weeks. The timeline depends heavily on what’s driving elevation in the first place — people with triglyceride-driven ApoB often see faster dietary responses than those with LDL particle-driven elevation.

Can you lower ApoB levels without medication?

Yes, in many cases. Diet, exercise, and targeted supplementation can produce clinically meaningful ApoB reductions — particularly in people whose elevation is primarily driven by insulin resistance, high triglycerides, or dietary factors. For some individuals, especially those with genetic predisposition or very high baseline levels, medication is also needed to reach target ranges. It depends on where you’re starting and what your risk level is.

Is ApoB the same as LDL?

No. LDL-C measures the total cholesterol mass inside LDL particles. ApoB counts the number of all atherogenic particles, including LDL, VLDL, IDL, and remnant cholesterol. They often correlate, but not always — particularly in people with insulin resistance, high triglycerides, or low-HDL patterns. When they diverge, ApoB is the more accurate predictor of cardiovascular risk.

What foods raise ApoB the most?

Saturated fats (red meat, butter, full-fat dairy, tropical oils) raise LDL particle number and ApoB. Refined carbohydrates, added sugars, and alcohol raise VLDL production and contribute to ApoB through the triglyceride pathway. Unfiltered coffee — French press, espresso — contains compounds that measurably raise ApoB and is often overlooked. Trans fats, where still present in processed foods, are also significant contributors.

How often should I test my ApoB?

If you’re actively working to lower your ApoB through diet, lifestyle, or supplementation, retesting every 3–4 months gives you enough time to see a real response. Once levels are stable and within your target range, annual testing is generally sufficient. If you start a new intervention — a supplement, a medication, or a significant dietary change — retesting after 8–12 weeks helps confirm whether it’s working.

  • Sehayek D, Cole J, Björnson E, Wilkins JT, Mortensen MB, Dufresne L, et al. ApoB, LDL-C, and non-HDL-C as markers of cardiovascular risk. Elsevier BV; 2025. https://doi.org/10.1016/j.jacl.2025.05.024
  • De Oliveira-Gomes D, Joshi PH, Peterson ED, Rohatgi A, Khera A, Navar AM. Apolipoprotein B: Bridging the Gap Between Evidence and Clinical Practice. Ovid Technologies (Wolters Kluwer Health); 2024. https://doi.org/10.1161/circulationaha.124.068885
  • Soffer DE, Marston NA, Maki KC, Jacobson TA, Bittner VA, Peña JM, et al. Role of apolipoprotein B in the clinical management of cardiovascular risk in adults: An Expert Clinical Consensus from the National Lipid Association. Elsevier BV; 2024. https://doi.org/10.1016/j.jacl.2024.08.013
  • Kim S, Shin MJ, Krauss RM. Dietary Management of Atherogenic Dyslipidemia. Springer Science and Business Media LLC; 2025. https://doi.org/10.1007/s11883-025-01335-6
  • Siri-Tarino PW, Chiu S, Bergeron N, Krauss RM. Saturated Fats Versus Polyunsaturated Fats Versus Carbohydrates for Cardiovascular Disease Prevention and Treatment. Annual Reviews; 2015. https://doi.org/10.1146/annurev-nutr-071714-034449
  • Anderson JW, Allgood LD, Lawrence A, Altringer LA, Jerdack GR, Hengehold DA, et al. Cholesterol-lowering effects of psyllium intake adjunctive to diet therapy in men and women with hypercholesterolemia: meta-analysis of 8 controlled trials. Elsevier BV; 2000. https://doi.org/10.1093/ajcn/71.2.472
  • Oscarsson J, Hurt-Camejo E. Omega-3 fatty acids eicosapentaenoic acid and docosahexaenoic acid and their mechanisms of action on apolipoprotein B-containing lipoproteins in humans: a review. Springer Science and Business Media LLC; 2017. https://doi.org/10.1186/s12944-017-0541-3
  • Afshin A, Micha R, Khatibzadeh S, Mozaffarian D. Consumption of nuts and legumes and risk of incident ischemic heart disease, stroke, and diabetes: a systematic review and meta-analysis. Elsevier BV; 2014. https://doi.org/10.3945/ajcn.113.076901
  • Sellami M, Almuraikhy S, Anwardeen N, Nizamuddin PB, Othman H, Alathba N, et al. Effects of 8 weeks of moderate physical training on body composition, lipid profile, inflammatory markers, and physical activity in middle aged females. Frontiers Media SA; 2026. https://doi.org/10.3389/fendo.2025.1734772
  • Riches FM, Watts GF, Hua J, Stewart GR, Naoumova RP, Barrett PHR. Reduction in Visceral Adipose Tissue Is Associated with Improvement in Apolipoprotein B-100 Metabolism in Obese Men. The Endocrine Society; 1999. https://doi.org/10.1210/jcem.84.8.5925
  • Mesarwi O, Polak J, Jun J, Polotsky VY. Sleep Disorders and the Development of Insulin Resistance and Obesity. Elsevier BV; 2013. https://doi.org/10.1016/j.ecl.2013.05.001
  • Blais JE, Huang X, Zhao JV. Overall and Sex-Specific Effect of Berberine for the Treatment of Dyslipidemia in Adults: A Systematic Review and Meta-Analysis of Randomized Placebo-Controlled Trials. Springer Science and Business Media LLC; 2023. https://doi.org/10.1007/s40265-023-01841-4
  • Korneva VA, Kuznetsova TY, Julius U. Modern Approaches to Lower Lipoprotein(a) Concentrations and Consequences for Cardiovascular Diseases. MDPI AG; 2021. https://doi.org/10.3390/biomedicines9091271
  • Jacobson TA. Opening a New Lipid “Apo-thecary”: Incorporating Apolipoproteins as Potential Risk Factors and Treatment Targets to Reduce Cardiovascular Risk. Elsevier BV; 2011. https://doi.org/10.4065/mcp.2011.0128
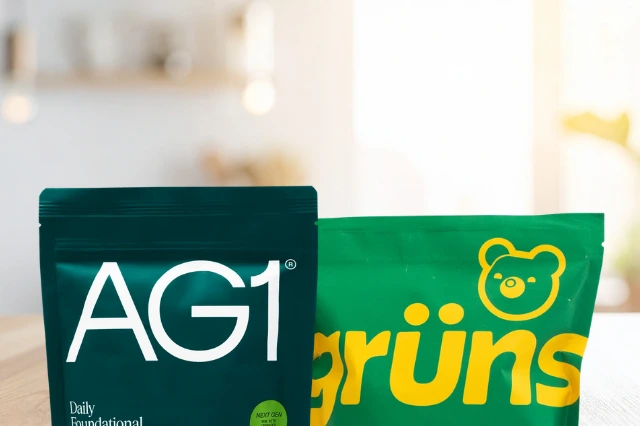
Grüns vs AG1 supplement bags on a kitchen table

Grüns vs AG1: Gummies or Greens Powder, Which Is Worth It?

If you are trying to “cover your bases” with one daily supplement, Grüns and AG1 are two of the loudest options on the shelf. One is a grab-and-go gummy pack. The other is a scoopable greens supplement powder built like a “kitchen-sink multivitamin.”

They can both be useful. They are not interchangeable.

What You Should Know

  • Grüns is a daily pack of gummies designed to fill nutrient gaps with 20+ vitamins and minerals plus plant-based ingredients.
  • AG1 is a daily greens powder with 75+ ingredients that combines vitamins, minerals, greens, herbs, probiotics, and more.
  • Both brands cite clinical research, but the studies are company-sponsored and focus on biomarkers and short-term outcomes.
  • Neither replaces whole foods, especially for fiber and the “food matrix” benefits you do not get from supplements.

Medical note: This article is for education, not medical advice. If you are pregnant, nursing, under 18, on prescription meds, or managing a medical condition, talk with your clinician before starting a new supplement.

Grüns vs AG1: Quick Comparison

Here’s the big picture before we zoom in.

CategoryGrüns (Gummies)AG1 (Greens Powder)
Format1 single-serve pack of gummies daily1 scoop daily, mixed with water or smoothie
“Big idea”Multivitamin-style coverage in a snack packBroad “all-in-one” blend (vitamins, superfoods, probiotics, herbs)
Calories, fiber, sugar (as stated)Fiber highlighted at 6g prebiotic fiber on brand materials50 calories, 2g fiber, <1g naturally occurring sugar, 7.2B probiotics
ProbioticsNot a core emphasis on the main ingredient summary7.2B probiotics per serving
Clinical claims (brand-reported)12-week double-blind, placebo-controlled study, with blood nutrient changes reported (folate, vitamin C)12-week triple-blind randomized placebo-controlled trial in 105 adults (biomarkers and microbiome)
Subscription price (typical)From $59.99/mo for low-sugar 28-pack subscription (and higher for sugar-free tiers)$79/mo subscription for 30 servings
Guarantee30-day money back guarantee90-day money back guarantee
Best fitYou want a no-mess habit and you hate powdersYou want a “one scoop” routine and you like powders, smoothies, or morning shakers

What is Grüns?

Grüns is designed to look and feel like a daily “nutrition backstop.” You get a single-serve pack, chew, and move on.

It is positioned as a way to fill nutrient gaps and support things like digestion, energy, immunity, recovery, beauty, and focus.

What You Get Per Day

Grüns uses a daily “pack” format and sells in 28-pack increments (one person) with subscription options.

It also offers low-sugar and sugar-free variants.

What’s Inside Grüns

The brand lists 20+ vitamins and minerals (including vitamins A, C, D3, E, K2, multiple B vitamins, zinc, iron, selenium, iodine, and more).

It also lists a long set of plant ingredients such as kale, spinach, broccoli, spirulina, chlorella, astragalus, wheatgrass, berries, inulin, and shiitake mushroom powder.

Grüns also highlights 6g of prebiotic fiber for digestion support.

Quality and Testing Notes

Grüns says it conducts lot testing for label claims, heavy metals, and microbial contaminants, and also cites Eurofins testing across label claims and a set of pesticides and contaminants.

Grüns also states it is gluten-free, dairy-free, nut-free, vegan, non-GMO, and uses pectin instead of gelatin.

CLIA-Certified Biomarker Panel

See what your body actually needs.

Jinfiniti AgingSOS green gradient background

What is AG1?

AG1 (Athletic Greens) is a daily powder with a wide ingredient spread. It is built to be mixed into water and taken like a daily drink.

AG1 calls itself a “Daily Health Drink” with 75+ ingredients spanning vitamins, minerals, pre and probiotics, superfoods, greens, adaptogens, mushrooms, antioxidants, and digestive support.

What You Get Per Scoop

AG1’s product detail page lists these per-scoop highlights: 50 calories, 6g carbs, 2g fiber, <1g naturally occurring sugar, 2g protein, and 7.2B probiotics.

It also quantifies blend weights like “>7g nutrient dense superfoods” and “>2g potent herbal extracts and antioxidants.”

AG1 also notes the pouch should be refrigerated after opening.

Quality and Certifications Notes

AG1 states it is NSF Certified for Sport, and positions that as a safeguard for athletes and banned substance concerns.

AG1 also markets a 90-day money back guarantee and subscription pricing.

Gummies vs Powder: Why The Format Changes The “Worth It” Math

This is the part most comparisons skip. The delivery format shapes how the product fits your life.

A powder is flexible. You can stack it into smoothies, take it while traveling, or sip it slowly.

A gummy pack is frictionless. No shaker bottle. No taste inconsistencies. No kitchen cleanup.

Fiber Is The Sneaky Differentiator

Many greens powders fall short on fiber because processing strips away a lot of the original plant structure. UCLA Health puts it bluntly: “When those fruits and vegetables are dried and pulverized into a powder, you lose most of that fiber.”

In this specific matchup, Grüns leans into fiber (6g prebiotic fiber), while AG1 lists 2g fiber per scoop.

If your main goal is regularity or appetite support, that gap matters.

If digestion is the main reason you are buying greens, our guide to vitamin C benefits for digestion and gut health is another easy win, because it pairs well with a fiber-first approach.

“All-In-One” Can Mean “Hard To Evaluate”

Both formulas bundle a lot of ingredients. That can be convenient.

It also makes it harder to know what is actually helping you.

Dietary supplements are not required by federal law to be tested for safety and effectiveness before marketing, so the evidence quality varies ingredient by ingredient.

Ingredients Breakdown

Both products are “broad-spectrum,” but they emphasize different levers.

Here is a practical way to compare them without drowning in 60 to 75 ingredient lists.

Ingredient Categories

Ingredient categoryGrünsAG1
Vitamins and minerals20+ vitamins and minerals listed (includes D3, K2, multiple Bs, zinc, iron, etc.)Vitamins and minerals are a major pillar (exact list is extensive)
Greens and plant powdersMultiple greens and plant ingredients listed (kale, spinach, broccoli, spirulina, chlorella, wheatgrass, etc.)“Superfoods & mushrooms” and “greens & superfoods” are core pillars
Mushrooms and adaptogensShiitake mushroom powder and astragalus listed, plus “adaptogens” positioning“Stress adaptogens” and “superfoods & mushrooms” are explicit pillars
Prebiotic fiber6g prebiotic fiber highlightedPre and probiotics included, fiber is 2g per scoop
ProbioticsNot a primary callout in the ingredient summary7.2B probiotics per serving
Digestive enzymesNot highlighted on the ingredient summaryDigestive enzymes are a pillar on AG1 pages

Nutrition Snapshot

MetricGrünsAG1
CaloriesBrand notes 20 calories for sugar-free version50 calories
Fiber6g prebiotic fiber highlighted2g fiber
SugarLow-sugar vs sugar-free options are offered<1g naturally occurring sugar, “no sugar added” positioning
ProbioticsNot a headline metric in their summary7.2B

What About Clinical Evidence?

This is where you should be a little picky.

Both brands cite studies. Both brands also fund their own research.

That is not disqualifying. It does mean you should interpret results like an informed adult, not like a fan.

Grüns: What The Brand Reports

Grüns reports a 12-week, double-blind, placebo-controlled clinical study, and says participants saw blood-level increases in folate (+20.5%) and vitamin C (+40%).

A trial partner summary also describes a 12-week study in 120 participants using a daily serving of 8 gummies.

AG1: What The Brand Reports

AG1 has published a triple-blind, randomized, placebo-controlled parallel trial in 105 healthy adults over 12 weeks, focused on nutrient biomarkers and microbiome shifts.

AG1 also describes a smaller 2-week crossover placebo-controlled trial in 20 active adults on microbiome and nutrient gap outcomes.

Evidence Comparison

QuestionGrünsAG1
Study design (brand-reported)Double-blind, placebo-controlledTriple-blind randomized placebo-controlled parallel trial
Duration12 weeks12 weeks (plus a 2-week crossover study)
Sample sizeTrial partner summary: 120 participants105 adults for the main RCT
OutcomesBlood nutrient changes (folate, vitamin C)Nutrient biomarkers and microbiome shifts
Sponsor influenceCompany-sponsored materialsCompany-sponsored materials

A useful rule: biomarker improvements are more trustworthy than “I felt amazing” testimonials. They still do not prove long-term outcomes.

Side Effects and Safety Considerations

You can use these products safely. You can also make yourself miserable if you ignore basics.

Common, Boring Side Effects That Still Matter

  • GI changes (gas, bloating, stool changes) are common with fibers, probiotics, enzymes, and concentrated plant extracts.
  • If you already take a multivitamin, stacking another “foundational” blend can push certain nutrients higher than you think.

Who Should Be More Cautious

AG1 states it is not intended for individuals under 18 or pregnant or nursing women.

If you are on blood thinners, thyroid medication, or have a sensitive gut, talk to your clinician before jumping into complex blends.

Read More: Compare AG1 vs IM8 daily powders in our full breakdown.

Which One Should You Choose?

This is the “worth it” moment. Pick the product that solves the real problem you have.

Choose Grüns If…

  • You will not consistently drink a greens powder.
  • You want fiber support in the formula and you like the daily pack habit.
  • You want a lower monthly subscription price, especially in the low-sugar tier.

Choose AG1 If…

  • You want probiotics, digestive enzymes, and a broad powder formula in one scoop.
  • You care about sport-focused third-party certification.
  • You prefer a 90-day guarantee window.

Pros and Cons Compared

ProductProsCons
GrünsEasiest habit to keep, travel-friendly packs, strong fiber emphasisLess transparent “dose-by-dose” evaluation for every plant ingredient, shorter guarantee window
AG1Strong category coverage in one scoop, probiotics and enzymes included, NSF Certified for SportHigher monthly price, powder routine is not for everyone

The Most Honest Way To Decide If Either Works For You

You are not buying “ingredients.” You are buying an outcome.

That outcome should show up in your data.

If cellular energy is the theme, the AgingSOS Ultimate Panel gives you a baseline you can actually track.

Here’s how we frame it at Jinfiniti:

“When a supplement has dozens of ingredients, you do not guess your way to ‘worth it.’ You measure what changed, then you adjust.”
Dr. Jin-Xiong She, founder of Jinfiniti Precision Medicine

If your goal is energy, nutrient sufficiency, and longevity support, a test-first approach keeps you out of the endless supplement carousel.

A good starting point is our guide on longevity biomarker testing, because it helps you decide what to measure before you spend another month’s budget on a new tub of powder.

If your routine includes NAD precursors or you are thinking about “cellular energy” supplements, you can also read how to test your NAD levels and why that matters more than guessing based on how you feel.

If niacin is part of your stack, a vitamin B3 test can help you spot low stores or unnecessary megadosing.

FAQs

Can Grüns or AG1 replace vegetables?

No. Whole foods deliver fiber and a broader nutrition “package” that supplements cannot fully copy.

Are these supplements FDA-approved?

Dietary supplements are not required to be tested for safety and effectiveness before being marketed.

Which is better for gut health?

Grüns leans on prebiotic fiber. AG1 leans on pre and probiotics plus digestive enzymes.

Which is better value?

On subscription, Grüns low-sugar can come in lower per month, while AG1 has a higher monthly cost and a longer guarantee window.

What if I already take a multivitamin?

Be careful stacking. “Foundational” blends can overlap on fat-soluble vitamins and minerals, so it is smart to review totals with your clinician.

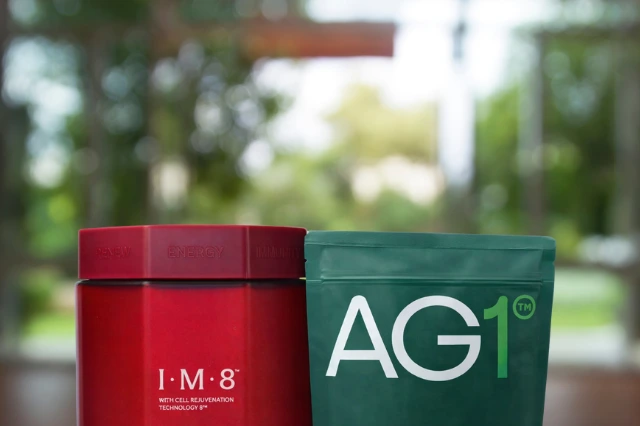
IM8 vs AG1 product comparison featured image

IM8 vs AG1: Ingredients, Testing, Price, and Which Daily Powder Makes Sense

If you have ever stared at a tub of green powder thinking, “Is this nutrition… or just expensive lawn clippings?” you are definitely not alone. IM8 and AG1 both promise a simpler way to cover foundational nutrients in one daily scoop.

They are in the same aisle, but they are not the same kind of product. IM8 leans “all in one plus extras” (hydration, joint support, heart support). AG1 leans “daily foundation” (vitamins, minerals, superfoods, adaptogens, gut support).

Below is a practical comparison, written for people who want fewer opinions and more signal.

What You Should Know

  • Both IM8 and AG1 are daily drink mixes that can help cover common nutrient gaps, but neither replaces a diet built on whole foods.
  • If you care about banned substance testing for sport, both brands list NSF Certified for Sport status.
  • IM8 is more “label forward” on many nutrients, while AG1 often summarizes ingredient buckets as complexes.
  • Your best “which one” answer usually comes from your routine and your labs, not from marketing.

Medical note: This article is for education, not medical advice. If you are pregnant, nursing, under 18, on prescription meds, or managing a medical condition, talk with your clinician before starting a new supplement.

IM8 vs AG1: At-a-Glance Comparison

CategoryIM8 Daily Ultimate EssentialsAG1 (Athletic Greens)
What it isAll-in-one drink mix with vitamins/minerals plus hydration, joint, heart, gut complexesFoundational daily drink with vitamins/minerals plus superfoods, adaptogens, gut support
Ingredient count92 ingredients (brand stated)75+ ingredients (brand stated)
Calories per serving40~50 (varies by formula/serving)
Probiotics10 billion CFU (label listed)7.2 billion CFU (brand stated)
CertificationNSF Certified for Sport (listed)NSF Certified for Sport (listed)
Taste profileAcai and mixed berries stylePineapple-vanilla style (Original), plus other flavor options
StorageShelf stable sachetsOften recommended to refrigerate after opening (live cultures)
Price rangePremium tierPremium tier

What Is IM8?

IM8’s flagship product is Daily Ultimate Essentials, an all-in-one powder marketed as a way to replace a long list of separate supplements. It includes a broad vitamin and mineral panel, then layers in several “support complexes” such as:

  • Hydration electrolytes
  • Joint and muscle support (including MSM)
  • Heart support (including CoQ10)
  • Digestive enzymes
  • Probiotics plus postbiotics

IM8 also highlights clinical research in its marketing for Daily Ultimate Essentials. If you like products that try to cover a lot of categories in one scoop, that is the core IM8 pitch.

What Is AG1?

AG1 is positioned as a daily “foundational nutrition” drink. It blends:

  • Vitamins and minerals
  • Prebiotics and probiotics
  • “Greens and superfoods”
  • Herbal extracts and adaptogens
  • Digestive enzymes

AG1 also emphasizes its manufacturing and testing standards, and it publishes a research narrative around its “Next Gen” formula.

What These Powders Can and Cannot Do

A daily all-in-one powder can be helpful when your real life looks like this:

  • Breakfast is optional.
  • Vegetables happen in bursts, not daily.
  • Travel and training disrupt routines.
  • You take “a few things” and want to simplify.

A powder is not a substitute for:

  • Protein adequacy
  • Fiber adequacy (most powders provide some, but not a full day)
  • Omega-3 intake
  • Sleep, sunlight, and stress management (sadly, no scoop solves those)

Think of IM8 and AG1 as a nutritional safety net, not a nutrition plan.

CLIA-Certified Biomarker Panel

See what your body actually needs.

Jinfiniti AgingSOS green gradient background

Ingredient Transparency: How Easy Is It to Evaluate the Formula?

IM8

IM8 provides a detailed Supplement Facts panel and ingredients library for many vitamins and minerals, plus named complexes with amounts. That makes it easier to answer practical questions like:

  • Are the B vitamins high-dose or modest?
  • Is there meaningful magnesium, or a “label sprinkle” amount?
  • Are key add-ons (like MSM or CoQ10) present in recognizable doses?

On the current label, IM8 includes items such as:

  • Vitamin C listed at 900 mg
  • MSM listed at 1,000 mg
  • CoQ10 listed at 100 mg
  • A probiotic complex listed at 10 billion CFU

That is useful if you want to sanity-check dosing.

AG1

AG1 lists many ingredients, but for certain categories it often communicates totals as “buckets” (for example, a total grams amount for superfoods or herbal extracts). That approach can still be reasonable, yet it makes it harder to evaluate whether specific botanicals are present at doses used in published studies.

If you are the kind of person who reads labels like a detective reads a ransom note, IM8 will likely feel easier to audit.

Vitamins and Minerals: Similar Foundation, Different Emphasis

Both products aim to cover the common “nutrient gap” basics, especially if your diet is inconsistent. In most all-in-one powders, the headline value is not one miracle ingredient. The value is a steady baseline.

Where differences show up:

  • Dose levels: Some formulas lean high-dose on certain vitamins. That can matter if you are already taking a multivitamin.
  • Forms: More bioavailable forms can improve tolerance and uptake for some nutrients.
  • Overlap with your stack: If you already take magnesium, vitamin D, omega-3, or a multivitamin, you can end up doubling up.

Quick caution: Both IM8 and AG1 include vitamin K forms in some versions. If you take warfarin or other anticoagulants, you should only change vitamin K intake with clinician guidance.

Gut Support: Probiotics, Prebiotics, and Enzymes

Both IM8 and AG1 include probiotics and digestion-related ingredients. That can be helpful, or it can be the reason you quit on day three.

What tends to happen in the real world:

  • If you are low-fiber and suddenly add a prebiotic-rich powder, you may feel bloated for a week or two.
  • If you are sensitive to inulin, chicory root, sugar alcohols, or certain mushroom extracts, symptoms can show up fast.

IM8’s gut angle

IM8 lists a probiotic complex at 10 billion CFU, plus postbiotics and digestive enzymes. If your main goal is digestive support, that is the part to focus on.

AG1’s gut angle

AG1 emphasizes clinically studied probiotic strains and also suggests refrigeration after opening due to live cultures. If you have used probiotic products before and tolerate them well, AG1 can fit smoothly.

Tip: Start with a half serving for several days if you are sensitive, then increase.

🧬 MORE SUPPLEMENT GUIDES

Energy, Performance, and Recovery: What’s Realistic

Both brands market “energy.” In supplement reality, energy usually improves when one of these is true:

  • You were low on a key nutrient (iron, B12, folate, vitamin D, magnesium).
  • Your gut tolerance improves and you absorb food better.
  • Your routine becomes more consistent, so sleep and hydration improve.

Neither powder is a stimulant product. If you want a caffeine-like effect, these are not designed for that.

Where IM8 may stand out

IM8 includes hydration electrolytes and adds ingredients like MSM and CoQ10. People who train, sweat heavily, or run low-carb diets sometimes notice hydration support more quickly than they notice “micronutrients.”

Where AG1 may stand out

AG1’s edge is the “daily foundation” habit plus its broad mix of superfoods and adaptogens. Some people report steadier digestion and fewer cravings when they commit to it daily.

Quality and Safety: Testing Matters More Than Ingredient Count

The supplement aisle has a trust problem. Quality varies and “natural” does not automatically mean “clean.” Two quality signals matter most:

  1. Third-party certification (not just “we test in-house”).
  2. Transparent manufacturing standards (GMP, traceability, contaminant testing).

NSF Certified for Sport

Both IM8 and AG1 list NSF Certified for Sport. This certification is designed to reduce the risk of banned substances and requires testing for contaminants and label verification.

If you compete in tested sport, NSF Certified for Sport is one of the few labels that actually changes your risk profile.

Manufacturing and traceability

AG1 states it is manufactured in a TGA-registered facility in New Zealand and describes full batch manufacturing records and traceability as part of its quality program.

IM8 positions itself as third-party tested and also lists NSF Certified for Sport status. If you want to go deeper than badges, look for batch testing details and contaminant standards (heavy metals, pesticides, microbes).

Heavy metals and contaminants

Greens powders can concentrate plant material, and with it, whatever was in the soil. That is why contaminant testing (heavy metals, pesticides, microbes) matters. If a brand offers batch-level testing or clear contaminant standards, it is worth paying attention.

What About Clinical Evidence?

AG1 vs IM8

This is the part that gets messy, fast, because these are multi-ingredient products. When a powder contains dozens of vitamins, minerals, botanicals, enzymes, and microbes, it becomes hard to prove which piece did what.

A good way to think about evidence for “all-in-one” powders is that it usually comes in three layers:

  1. Ingredient-level evidence (vitamin D supports blood levels, magnesium supports adequacy, certain strains support gut outcomes, etc.)
  2. Product-level trials (a study on the actual formula people are buying)
  3. Real-world experience (tolerance, routine adherence, “do I actually keep doing this?”)

IM8 markets results from a 12-week randomized, controlled clinical trial conducted by the San Francisco Research Institute, and the headline numbers they share (energy, gut health, sleep, focus) are presented as participant-reported outcomes. IM8 also has a registered trial listing but the results have yet to be published..

That is a positive signal, but it is worth reading with the right “decoder ring”: until the full methods and results are publicly available (ideally peer-reviewed), treat it as company-sponsored early evidence, not the final word.

AG1 positions its “Next Gen” formula as having been evaluated in multiple randomized, placebo-controlled trials, focused on things like nutrient biomarkers and gut-related outcomes.

There is also at least one peer-reviewed placebo-controlled trial exploring AG1’s effects on the gut microbiome and clinical safety markers. Popular longevity influencer Bryan Johnson called the study into question in a recent Facebook post.

AG1 also published a “Foundational Nutrition” paper. That kind of review can be useful context, but it is not the same thing as a trial proving the product improves outcomes. Pay attention to author affiliations and disclosures, because nutrition reviews can be influenced by funding and conflicts of interest.

Taste, Mixability, and Convenience

Taste is not a minor detail. Taste is compliance.

  • AG1 tends to be described as pineapple-vanilla “greens,” not grassy, with multiple flavor options depending on region.
  • IM8 leans acai and mixed berry.

Convenience differences:

  • IM8 sachets can be easy for travel and consistent dosing.
  • AG1 often includes travel packs on subscription tiers and may require refrigeration after opening.

If you will not measure scoops or you travel often, sachets can win on friction alone.

Price and Value: What Are You Actually Paying For?

Both are premium products. That is the honest truth.

Typical pricing (what you will usually see)

Pricing changes, bundles appear, and promos come and go. Still, here is the general shape:

  • AG1 commonly lists $79 for a subscription pouch (30 servings) and $99 for a one-time purchase.
  • IM8 Daily Ultimate Essentials commonly lists from $89 on subscription pricing, with multi-month options that change the effective per-month cost.

If you want a cleaner comparison, convert everything to cost per serving using your exact plan.

What you are really buying

When you evaluate value, compare them to what you would otherwise buy:

  • Multivitamin
  • Probiotic
  • Greens blend
  • Electrolytes
  • Digestive enzymes
  • “Extras” (adaptogens, mushrooms, CoQ10, joint support)

If you already own half of that stack, an all-in-one may not save money. It may save decisions.

A useful lens: cost per day is not the only number. Ask, “Does this replace things I already take?” If the answer is yes, premium pricing can still make sense. Ask, “Does this replace things I already take?” If the answer is yes, premium pricing can still make sense.

AG1 vs IM8: Pros and Cons (Who Each Is Best For)

Here is the quick, practical version. No poetry, just tradeoffs.

ProductProsConsBest for
IM8 Daily Ultimate EssentialsMore “label-forward” dosing for many nutrients and several complexes; includes hydration electrolytes plus add-ons like MSM and CoQ10; travel-friendly sachets; NSF Certified for Sport positioningBigger “kitchen sink” formula can overlap with your existing stack; higher-dose vitamins may not suit everyone (especially if you already take a multivitamin); fewer taste optionsPeople who want one product to cover foundation plus hydration/recovery-style add-ons, and who prefer clearer label detail
AG1 (Athletic Greens)Strong “daily foundation” habit; widely used; flavor options (by region); manufacturing/quality narrative; NSF Certified for Sport positioningLess transparency on exact dosing for some botanicals (often grouped as blends); some users prefer refrigerating after opening; taste is distinctive and not universalPeople who want a consistent, simple daily baseline and like the AG1 taste/format

Quick Picks

  • Choose IM8 if you want hydration + extras baked in (and you like the idea of sachets and a more “auditable” label).
  • Choose AG1 if you want a foundational daily habit with a long track record and you are fine with more ingredients being grouped into blends.

Who Should Skip Both?

Skipping both can be the smartest move if:

  • You have a strong whole-food routine and only need one or two targeted nutrients
  • You are managing a medical condition where supplement interactions matter
  • You get digestive symptoms from prebiotics, probiotics, or adaptogens

In those cases, the better path is usually:

  1. Get basic labs, then
  2. Add targeted supplements to correct what is actually off

For example, if “energy” is your real goal, it helps to confirm whether you are dealing with a nutrient issue, a thyroid issue, iron status, blood sugar swings, or low intracellular NAD. (Our guide on testing your NAD+ levels is a good starting point for the NAD conversation.)

That is where at-home panels like our AgingSOS Ultimate Panel (48 biomarkers) and the Intracellular NAD test can turn guesswork into a plan.

If your data suggests NAD support is a fit, a targeted formula like Jinfiniti Vitality NAD+ Booster can be a cleaner next step than stacking dozens of ingredients “just in case.”

As Dr. Jin-Xiong She, founder of Jinfiniti Precision Medicine, puts it: “Supplements can support the plan, but biomarkers tell you what the plan should be.”

If your goal is energy, resilience, and healthy aging, consider pairing any supplement habit with real measurement.

A Smarter Way to Decide: Use a 5-Step Checklist

  1. Define the job. Nutrient gaps? Gut support? Travel routine? Training recovery?
  2. Check overlap. List what you already take. Look for duplicates.
  3. Prioritize certification. If you are an athlete, look for NSF Certified for Sport.
  4. Start small. Half servings reduce digestive surprises.
  5. Measure outcomes. If you care about results, use labs and track symptoms, sleep, and training.

FAQ

Is IM8 better than AG1?

“Better” depends on what you need. IM8 is easier to evaluate on the label and adds hydration and joint/heart extras. AG1 is a simpler foundational habit with strong brand infrastructure and a long track record.

Can I take IM8 or AG1 with a multivitamin?

You can, but you may double up on certain nutrients. If you already take a multivitamin, consider using a half serving or pausing the multi while you test tolerance and results.

Do these powders help with bloating?

Sometimes. Some people feel better digestion with probiotics and enzymes. Others feel worse at first due to prebiotics and fiber. Start low and increase gradually.

Are IM8 and AG1 safe?

Most healthy adults tolerate them, but safety depends on your meds, conditions, and sensitivity. If you are pregnant, nursing, under 18, immunocompromised, or on prescription meds, check with a clinician.

Should athletes use greens powders?

If you do, choose products with strong third-party testing and certification, especially if you compete in tested sport.

The Bottom Line

IM8 and AG1 are both premium “daily foundation” powders with third-party certification for sport. Your best choice hinges on two things:

  • Transparency and extras (IM8) versus habit simplicity and broad foundation (AG1)
  • Your personal tolerance, goals, and the rest of your routine

If you want a shortcut that cuts through the noise, do this: pick one, commit for 30 days, track how you feel, and confirm with labs.

Two cups of coffee by the window, forest in background

Should You Take Creatine and Caffeine Together?

Creatine gets muscles bigger. Caffeine helps you perform. Combine them in a supplement stack and double your gains, right?

Not so fast. While supplement companies would like you to think otherwise, the two most popular ergogenic aids of all time can actually antagonize one another at the muscular level.

Creatine and caffeine aren’t the BFFs most people think they are. The timing matters. The form matters. And what you think you know just might not translate to real world results.

Let’s get down to the science on what mixing these two supplements is really all about.

What You Should Know

  • Creatine shortens muscle relaxation time while caffeine lengthens it, creating opposing effects
  • Taking caffeine acutely after creatine loading appears safer than using both daily during the loading phase
  • Studies show mixed results, with some finding no interaction and others showing caffeine interferes with creatine’s benefits
  • Coffee and caffeine pills may behave differently in your body due to other compounds in coffee

How Creatine Works in Your Body

To understand why mixing creatine with caffeine gets complicated, you need to know what each one does in your muscles.

Creatine Speeds Up Energy Production

Creatine helps regenerate ATP (adenosine triphosphate), the molecule your cells use for energy. Think of ATP as a rechargeable battery for your muscles.

When you supplement with creatine, you increase the creatine phosphate stores in your muscles. This allows for faster ATP regeneration during high-intensity efforts like sprinting or lifting weights.

What does this mean? Better exercise performance in activities that require quick bursts of power. Most people see improvements in strength, power output, and muscle mass gains when they supplement with creatine consistently.

The benefits of creatine extend beyond muscle, supporting brain health and potentially increasing lifespan through cellular energy optimization.

The Muscle Relaxation Factor

Studies have found creatine shortens the time it takes for muscles to relax after contracting by about 5% (Hespel et al., 2002)[1]. This faster relaxation time means your muscles can contract again more quickly.

This is just one of the ways creatine is so effective for repeated bouts of high-intensity work. Your muscles are able to fire, relax, and fire again quicker than they normally would be.

This benefit applies to both athletes and older adults, where faster muscle function equals better performance and reduced injury risk.

Dr. She’s Creatine Formula

Pure creatine with ATP for total body performance.

Creatine+ by Jinfiniti

How Caffeine Affects Performance

Caffeine has earned its reputation as a performance booster, but it works differently than creatine.

Caffeine Boosts Endurance and Alertness

Caffeine stimulates your central nervous system, making you feel more alert and focused. The performance benefits are well-documented for endurance activities.

Studies consistently show caffeine improves endurance performance. But the results for strength and sprint performance? Much more mixed.

Some athletes see benefits. Others don’t notice much difference in their power output or lifting capacity. It’s more of an individual response compared to other performance supplements.

But Caffeine Slows Muscle Relaxation

Now there’s a problem. While creatine speeds up muscle relaxation, caffeine does the opposite.

The same research that measured creatine’s effects found that caffeine increases muscle relaxation time by about 10%. Your muscles take longer to reset between contractions[1].

This happens because caffeine affects calcium handling in muscle cells. The delayed calcium reuptake means your muscles stay in a semi-contracted state slightly longer.

That’s the exact opposite of what creatine does. And it sets up a physiological conflict.

What Happens When You Mix Creatine and Caffeine?

An image of creatine powder scoops and ground coffee

When you combine supplements that pull your muscles in opposite directions, something has to give. The interaction between caffeine and creatine creates a physiological conflict.

They Create Opposing Effects at the Muscle Level

The landmark study by Hespel and colleagues tested exactly this scenario. They gave subjects creatine alone, caffeine alone, both together, or placebo in a randomized crossover design.

The findings were striking. Creatine supplementation shortened muscle relaxation time by 5%. Caffeine extended it by 10%. But when subjects took both together, caffeine’s effect won out[1].

Caffeine counteracts the beneficial effect on relaxation time. Your muscles ended up behaving more like they were on caffeine alone, not like they were on creatine.

This study, published in the Journal of Applied Physiology, remains one of the clearest demonstrations of why these two supplements might not play well together.

Other Possible Mechanisms

The muscle relaxation issue isn’t the only concern. Some studies have noted gastrointestinal side effects when people take creatine and caffeine together.

In one trial, 4 out of 54 subjects reported mild GI discomfort with the creatine plus caffeine combination. No one in the other groups had issues[2].

There’s also some evidence that caffeine might affect the creatine transporter, the protein that moves creatine into muscle cells (Persky et al., 2003)[3]. If caffeine reduces creatine uptake, that would explain why the combination doesn’t work as well as creatine alone.

The mechanisms aren’t fully mapped out yet. But multiple pathways suggest these supplements interfere with each other.

Can You Take Creatine and Caffeine Together?

The research on concurrent use shows mixed results. Not every study found problems, but enough did to warrant caution.

Some Studies Found No Interaction

A 2022 systematic review examined all available research on the effects of creatine and caffeine used together. Three of the included studies found no interaction between the supplements[4].

One six-week training study compared groups taking creatine alone, caffeine alone, both together, or placebo. The creatine-only group showed improvements in knee extensor muscle thickness. The other groups, including the combination group, didn’t see the same gains[5].

But the combination didn’t actively harm performance either. It just didn’t provide added benefits.

Others Found Caffeine Interfered with Creatine

The systematic review also found two studies where caffeine clearly interfered with creatine’s effects. Subjects taking both supplements together saw less benefit than those taking creatine alone.

The 2016 study by Trexler and colleagues tested creatine loading with and without caffeine. They found no performance advantages from the combination compared to placebo[2].

When caffeine blocks creatine’s benefits, you’re essentially wasting the creatine supplementation. You’re spending money and effort on something that isn’t working.

One Study Suggested Benefits Together

In the systematic review, one study did report beneficial effects from the combination. Both supplements together worked better than either alone[4].

This appears to be the exception rather than the rule. Most evidence points toward either no interaction or negative interaction.

The conflicting results suggest individual responses vary. But the preponderance of evidence leans toward caution.

🧬 MORE CREATINE INSIGHTS

Timing is Everything

Here’s where the research gets more interesting. When you take these supplements matters as much as whether you take them.

Acute Caffeine After Creatine Loading Appears Safe

The systematic review authors noticed a pattern. Studies where subjects completed creatine loading first, then used caffeine acutely before performance testing, showed no interference.

“Creatine loading does not seem to interfere in the acute effect of caffeine,” the researchers concluded. If your muscles are already saturated with creatine, a single dose of caffeine before competition doesn’t undo those benefits.

This timing strategy makes sense. You get the long-term benefits of elevated muscle creatine stores. Then you add the acute mental and potential endurance boost from caffeine when you need it.

Chronic Caffeine During Creatine Loading May Backfire

The problems start when you take both supplements daily during the loading phase. That’s when studies found interference.

Daily caffeine consumption while trying to saturate your muscles with creatine appears to reduce creatine’s effectiveness. The exact mechanism isn’t clear, but the pattern in the research is consistent.

If you’re doing a traditional creatine monohydrate loading protocol (20 grams daily for 5-7 days), save the caffeine for after. Let your muscles fill up with creatine first.

Can You Put Creatine in Your Coffee?

A cup of coffee on a balcony

Many people wonder if they can just stir creatine powder into their morning coffee.

Coffee isn’t just caffeine. It contains hundreds of other compounds, including antioxidants and various polyphenols.

One study specifically compared creatine plus coffee versus creatine plus caffeine pills. Interestingly, neither combination produced better results than placebo. But the coffee and caffeine pill groups showed slightly different patterns in some measures[2].

The other compounds in coffee might buffer some of caffeine’s effects. Or they might have their own interactions with creatine. More research is needed to say for sure.

What we do know is that coffee appears no better or worse than caffeine pills when combined with creatine. Both combinations failed to enhance performance beyond what you’d expect from either supplement alone.

If you’re concerned about absorption or effectiveness, choosing the right form of creatine matters more than whether you mix it with coffee.

Who Should Be Cautious?

Most of the research focuses on athletic performance. But there are other considerations, especially for certain populations.

Special Populations May Need Extra Care

A large study in Parkinson’s disease patients found something concerning. Among subjects taking creatine, higher caffeine intake correlated with faster disease progression[6].

This 1,741-person trial wasn’t looking at athletic performance. It was measuring clinical outcomes in a neurological condition. The interaction between creatine and caffeine showed up in an unexpected place.

If you have any health conditions, especially neurological ones, talk to your doctor before combining these supplements. The GI side effects some people experience are usually mild. But they’re another reason to approach the combination carefully.

Bottom Line: Should You Mix Them?

After reviewing all the evidence, the recommendation is clear.

The Evidence Doesn’t Support Combining Them

Most research shows no added benefit from combining creatine with caffeine. Some studies show outright interference. Only one study suggested synergy.

The risk-benefit ratio doesn’t favor combination. You might get lucky and respond well. Or you might waste money on creatine that isn’t working.

As Dr. Jin-Xiong She, founder of Jinfiniti Precision Medicine, emphasizes: “The goal isn’t to take more supplements. The goal is to understand what your body actually needs and respond with precision.”

If You Do Use Both, Here’s How

Some people will choose to use both supplements regardless. If that’s you, here’s how to minimize potential interference and keep it safe to take:

  • Complete a full creatine loading phase (5 grams, 4 times daily for 5-7 days) without caffeine
  • Switch to a maintenance dose of creatine (3-5 grams daily)
  • Add caffeine only on training days, 30-60 minutes before your workout
  • Consider using coffee instead of caffeine pills (anecdotally, some people tolerate this better)
  • Separate them by at least 3-4 hours if you take both on the same day

Monitor how you feel and perform. If you don’t notice benefits from creatine after 4-6 weeks, taking caffeine with creatine might be interfering.

Better Strategy: Test Your Cellular Energy Status

Taking creatine and caffeine together is a shot in the dark at improving cellular energy production. You’re just guessing what your body may or may not need.

NAD+ testing provides you with hard data on your intracellular energy status. NAD+ (nicotinamide adenine dinucleotide) is the master control mechanism for energy metabolism within every cell.

Armed with knowledge of your NAD+ levels, you can make smart decisions about supplementation. You might find out that neither creatine nor caffeine is relevant to your true energy deficiency.

This is the difference between precision supplementation and shotgun approaches. One is individualized to your biochemistry. The other is individualized to marketing. 

Referenced Sources

  1. Hespel P, ’t Eijnde BO, Van Leemputte M. Opposite actions of caffeine and creatine on muscle relaxation time in humans. American Physiological Society; 2002. https://doi.org/10.1152/japplphysiol.00255.2001
  2. Trexler ET, Smith-Ryan AE, Roelofs EJ, Hirsch KR, Persky AM, Mock MG. Effects of coffee and caffeine anhydrous intake during creatine loading. Ovid Technologies (Wolters Kluwer Health); 2016. https://doi.org/10.1519/jsc.0000000000001223
  3. Persky AM, Brazeau GA, Hochhaus G. Pharmacokinetics of the dietary supplement creatine. Springer Science and Business Media LLC; 2003. https://doi.org/10.2165/00003088-200342060-00005
  4. Elosegui S, López-Seoane J, Martínez-Ferrán M, Pareja-Galeano H. Interaction between caffeine and creatine when used as concurrent ergogenic supplements: a systematic review. Human Kinetics; 2022. https://doi.org/10.1123/ijsnem.2021-0262
  5. Pakulak A, Candow DG, Totosy de Zepetnek J, Forbes SC, Basta D. Effects of creatine and caffeine supplementation during resistance training on body composition, strength, endurance, rating of perceived exertion and fatigue in trained young adults. Informa UK Limited; 2021. https://doi.org/10.1080/19390211.2021.1904085
  6. Simon DK, Swearingen CJ, Hauser RA, Trugman JM, Aminoff MJ, Singer C, et al. Caffeine and progression of Parkinson disease. Ovid Technologies (Wolters Kluwer Health); 2008. https://doi.org/10.1097/wnf.0b013e31815a3f03
Woman wearing pink heart-shaped sunglasses takes bite of cream-filled pastry against vibrant purple background in playful portrait.

The 10 Longevity Diet Myths That Could Be Shortening Your Life

You’ve read at least a dozen headlines about the key to living to be 100. You may have jumped on the keto bandwagon, eliminated seed oils from your diet, or purchased overpriced organic groceries after reading claims that certain foods can help you live longer.

The issue is that a lot of what passes for longevity nutrition is based on flimsy science, misinterpreted research, or is just plain pseudoscience. And some of these trendy diet myths are actually shortening your life rather than extending it.

New research is debunking some of the biggest beliefs about what helps people live longer. You might be surprised by the findings.

Highlights

  • Blue Zones, long promoted as longevity hotspots, are largely based on poor record-keeping and pension fraud rather than dietary wisdom
  • Long-term ketogenic diets may accelerate cellular aging in heart and kidney tissues despite short-term benefits
  • Antioxidant supplements in high doses increase mortality risk rather than extending lifespan
  • The alkaline diet’s central claim—that food changes blood pH—is physiologically impossible

 The Blue Zone Fairy Tale: When Bad Data Meets Good Marketing

For years, “Blue Zones” have dominated conversations about longevity. You’ve seen the books, the Netflix documentaries, the diet plans based on what people in Sardinia and Okinawa supposedly eat.

Dr. Saul Justin Newman at University College London uncovered an uncomfortable truth. His research, which won an Ig Nobel Prize in 2024, revealed that these longevity hotspots are predicted by high poverty, lack of birth certificates, and pension fraud[1]—not healthy diet patterns.

The analysis found something striking: many centenarians existed in government records but were actually deceased. Even more telling, Okinawans eat the least vegetables and sweet potatoes in Japan and have the highest body mass index.

This doesn’t mean Mediterranean-style eating patterns lack value. They have been linked with cardiovascular health and longevity.

But the romanticized idea that certain geographic regions hold secret dietary keys to extreme lifespan? That’s fiction wrapped in marketing.

Protein Confusion: Too Much, Too Little, or Just Right?

The “protein paradox” has confused health-conscious people for years. High protein activates mTOR pathways linked to accelerated aging in lab animals, yet adequate protein prevents muscle loss in older adults.

A 30-year study of over 48,000 people found that those who prioritized protein experienced healthier aging[2]. They had 46% less incidence of major chronic diseases and better cognitive function.

Here’s what matters: the mTOR-activating effects of dietary protein are temporary. They return to baseline between meals rather than creating chronic activation.

Age changes everything. Among people aged 50-65, lower protein intake was linked to reduced cancer mortality. Among those 66 and older, higher protein consumption reduced all-cause mortality by 28%[3].

The source trumps the amount. Plant-based proteins showed the strongest benefits for extending lifespan, while excessive red and processed meat consumption consistently correlates with shortened life expectancy.

Dr. Jin-Xiong She, founder of Jinfiniti Precision Medicine, notes: “The longevity myths around protein often miss the bigger picture. Cellular health depends on maintaining adequate NAD+ levels and supporting mitochondrial function. Protein is just one piece of a complex metabolic puzzle.”

At-Home Longevity Blood Test

Measure what matters for healthy aging and longevity.

Jinfiniti AgingSOS green gradient background

Intermittent Fasting: Conflicting Evidence on Mortality

Intermittent fasting has been wildly popularized as a simple way to gain longevity. The truth, however, is both more disputed and perhaps more ominous.

It’s been established that fasting for a few days in a row yields impressive metabolic improvements, including better insulin sensitivity, reduced inflammation, and weight loss[4]. A preliminary 2019 study of cardiac patients indicated a possible survival benefit for those fasting for at least five years, but not for recent adopters of the practice[5].

Troublingly, a 2024 study of over 20,000 US adults indicated people eating for less than 8 hours per day had 91% greater risk of cardiovascular death[6]. Restricting eating to 8-10 hours per day was associated with a 66% greater risk among those with existing cardiovascular disease.

The study was limited by only using 2 days of dietary recall and not assessing the quality of nutrients consumed. Critics also pointed out that people adhering to extreme time-restricted eating may have other health problems that are the cause of the mortality risk.

A 2024 study in Nature on nearly 1,000 mice showed that the mice who were resilient to stress-induced weight loss were the ones who reaped the benefits of calorie restriction, while those that could not maintain the necessary protective factors saw no improvement in lifespan[7].

Finally, a study of people fasting for religious purposes for one day per month had associations with greater longevity[8]. This may indicate that intermittent but infrequent fasting is safer than the aggressive daily fasting people have adopted en masse.

If you choose to fast, the less aggressive methods, such as 12 hour overnight fasts, seem to be safer than the trendy 16:8 approach.

The Keto Diet Reality Check

The ketogenic diet gets promoted for everything from fat loss to brain health to longevity. Recent evidence suggests caution is warranted.

While a cyclic ketogenic diet reduced mid-life mortality in mice, it didn’t affect maximum lifespan. A 2024 meta-analysis found that long-term keto diets link to higher risks of heart disease, kidney issues, cancer, and Alzheimer’s disease[9].

Informational quote titled "Longevity Diet Myth" stating long-term keto diets increase health risks.

Research from the University of Texas Health Science Center revealed that continuous long-term ketogenic diets may induce cellular senescence (damaged cells that refuse to die) in normal tissues[10]. This particularly affects heart and kidney function.

An intermittent ketogenic diet with planned breaks didn’t show these pro-inflammatory effects. If you’re going to use keto, cycle it rather than maintain it continuously.

The study authors urged taking “keto-breaks” as a preventative measure. 13 million Americans follow ketogenic diets without awareness of potential long-term consequences.

The Antioxidant Trap: When More Isn’t Better

For decades, antioxidant supplements were promoted as anti-aging essentials. The reality has proven disappointing and sometimes dangerous.

A major Cochrane Review analyzing 78 trials concluded that antioxidant supplements not only failed to prolong life but were linked to higher mortality in some groups[11]. High doses of beta-carotene, vitamin A, and vitamin E were particularly problematic.

The Alpha-Tocopherol, Beta-Carotene Cancer Prevention Study found that beta-carotene supplements increased lung cancer risk among smokers[12]. This reflects the “antioxidant paradox”—while oxidative stress contributes to disease, low to moderate levels of reactive oxygen species actually improve biological outcomes through hormesis.

Excess antioxidants can interfere with cellular cleanup processes like autophagy that are essential for the aging process[13]. Free radicals serve as important signaling molecules for physiological adaptations, including the beneficial effects of physical activity.

Flooding your system with synthetic antioxidants disrupts these finely tuned processes.

Fish vs. Fish Oil: A Critical Distinction

Fish consumption has strong evidence linking it to longevity. People with the highest blood levels of omega-3 fatty acids had 34% lower risk of death from any cause and lived an average of 2.2 years longer[14].

Low omega-3 levels were as harmful to lifespan as smoking, reducing life expectancy by 4.74 years.

When it comes to supplements, the picture gets murky. A 2024 BMJ Medicine study found that fish oil supplementation was linked to 5% increased risk of stroke and 13% increased risk of atrial fibrillation in people without cardiovascular disease[15].

The discrepancy may lie in the difference between whole food sources (which include other beneficial compounds) versus isolated supplements in high doses. Getting omega-3s from actual fish appears superior to popping pills.

The Seed Oil Scare: The Truth Is More Complex

Social media has demonized seed oils as inflammatory toxins. The scientific evidence is conflicting.

A massive 2025 JAMA study following over 220,000 people for 33 years found that those consuming high amounts of plant-based oils had lower risk of dying from any cause. People replacing butter with plant oils had 17% lower mortality risk[16].

But there’s a catch. Professor Tom Sanders from King’s College London points out this is an observational study that can only show associations, not causation. Professor George Davey Smith from the University of Bristol notes that people with the highest butter consumption had more than double the rate of cigarette smoking—lifestyle differences that statistical models can’t fully account for.

The biochemistry raises concerns too. Polyunsaturated fats are susceptible to lipid peroxidation, particularly during high-temperature cooking[17]. These oxidation products can form DNA and protein adducts that alter cellular function[18].

The real issue may be context. Ultra-processed foods containing oxidized seed oils are problematic. Fresh, cold-pressed seed oils used in whole food cooking may be fine. We need randomized controlled trials to know for sure.

Three More Myths Worth Mentioning

The Organic Food Premium

While organic food consumption links to reduced cardiometabolic risk factors including obesity and diabetes, the evidence for superior nutritional content is mixed[19]. The primary documented benefit is lower pesticide exposure.

Organic foods aren’t inherently more nutritious in terms of vitamins and minerals. People who buy organic also tend to have healthier overall lifestyle choices, higher incomes, more exercise, and better baseline diets.

For longevity, eating more whole plant foods—organic or not—matters far more than the label.

The Gluten-Free Trend

Despite 30% of Americans avoiding gluten, only about 1% have celiac disease requiring strict avoidance. For the remaining 99%, going gluten-free offers minimal health benefits and may cause nutrient deficiencies in fiber, iron, calcium, and B vitamins.

Research shows people eating more whole grains (2-3 servings daily) had lower risk of heart disease, stroke, and type 2 diabetes[20]. Gluten-free products are often higher in saturated fat, sugar, and salt while being lower in fiber.

The perceived benefits likely stem from eliminating processed foods and refined carbohydrates rather than gluten itself.

The Alkaline Diet Fantasy

The alkaline diet claims that eating “acidic” foods like meat and grains makes your blood acidic, leading to disease. This is scientifically false.

The body tightly regulates blood pH between 7.35-7.45, and diet cannot change blood pH[21]. If blood pH were to shift significantly, it would be a medical emergency requiring immediate treatment.

The kidneys and lungs work continuously to maintain pH balance regardless of diet. While you can change the pH of urine and saliva with food, blood pH remains constant. The myth is likely based on the fact that acid-forming foods have a high potential renal acid load (PRAL), causing the kidneys to excrete more acid in the urine.

The alkaline diet accidentally promotes health by encouraging more fruits and vegetables and fewer processed foods—but this has nothing to do with changing body pH.

What Science Actually Says About Longevity Nutrition

After reviewing all these longevity myths, what does evidence actually support?

Moderate caloric restriction without malnutrition shows the most robust evidence for lifespan extension across species. In humans, even starting at age 60, sustained dietary improvements can add 8-10 years to life expectancy[22]. The key is preventing obesity while maintaining adequate nutrition.

Whole food, predominantly plant-based diets rich in fruits, vegetables, whole grains, legumes, and nuts consistently correlate with reduced all-cause mortality. A high-quality plant-based dietary pattern was linked to slowed biological aging across multiple epigenetic clocks[23].

Limiting ultra-processed foods is critical. People consuming significant amounts of ultra-processed foods were 10% more likely to die during long-term follow-up, especially from heart disease and diabetes.

Adequate protein, especially from plant sources, becomes increasingly important with age to prevent sarcopenia and frailty. The source matters more than the amount.

Time-restricted eating aligned with circadian rhythms may offer benefits when done properly, though more research is needed.

At the cellular level, maintaining optimal NAD+ levels becomes increasingly important for healthspan. NAD+ (a critical coenzyme involved in over 500 cellular reactions) naturally declines by about 50% between ages 40 and 60. This decline impacts energy production, DNA repair, and cellular resilience—all factors that influence how well you age.

Jinfiniti’s approach combines precision testing with targeted supplementation. Our Intracellular NAD+ Test allows you to measure your baseline levels and track improvements over time. When paired with our Vitality NAD+ Booster—a clinically validated formula that works through multiple metabolic pathways—85% of users reached optimal NAD+ levels within four weeks.

Our Test, Act, Optimize approach removes the guesswork from supplementation. You’re not following generic advice or chasing the latest trend—you’re using data to make informed decisions about your cellular health.

The Bottom Line

The longevity diet landscape is cluttered with myths that could shorten your life if followed blindly. Blue Zones are largely fiction. Extreme low-protein or long-term ketogenic diets carry risks. Antioxidant megadoses can be harmful. Gluten-free and alkaline diets are unnecessary pseudoscience for most people.

Instead, the boring truth: eat a lot of whole plant foods. Live healthier through mid-life with healthy weight. Consume enough protein (especially as you age). Avoid ultra-processed foods. Optimize cellular function with evidence-based interventions. The longevity diet isn’t about exotic superfoods or strict rules, it’s about your daily lifestyle choices. Making sure your body is nourished with real food in sensible portions.

Referenced Sources

  1. Echeverry Raad J, Sturmberg JP. Red zones: the true color behind the myth of blue zones geographic longevity. Universidad Nacional de Colombia; 2025. https://doi.org/10.15446/rsap.v27n3.119673
  2. Ardisson Korat AV, Shea MK, Jacques PF, Sebastiani P, Wang M, Eliassen AH, et al. Dietary protein intake in midlife in relation to healthy aging – results from the prospective Nurses’ Health Study cohort. Elsevier BV; 2024. https://doi.org/10.1016/j.ajcnut.2023.11.010
  3. Kitada M, Ogura Y, Monno I, Koya D. The impact of dietary protein intake on longevity and metabolic health. Elsevier BV; 2019. https://doi.org/10.1016/j.ebiom.2019.04.005
  4. Mattson MP, Longo VD, Harvie M. Impact of intermittent fasting on health and disease processes. Elsevier BV; 2017. https://doi.org/10.1016/j.arr.2016.10.005
  5. Horne B, Bartholomew CL, Anderson JL, May H, Knowlton K, Bair T, et al. Abstract 11123: Intermittent Fasting Lifestyle and Human Longevity in Cardiac Catheterization Populations. Circulation 2019;
  6. Chen M, Zhong VW. Abstract P192: Association Between Time-Restricted Eating and All-Cause and Cause-Specific Mortality. Ovid Technologies (Wolters Kluwer Health); 2024. https://doi.org/10.1161/circ.149.suppl_1.p192
  7. 7. Di Francesco A, Deighan AG, Litichevskiy L, Chen Z, Luciano A, Robinson L, et al. Dietary restriction impacts health and lifespan of genetically diverse mice. Springer Science and Business Media LLC; 2024. https://doi.org/10.1038/s41586-024-08026-3
  8. 8. Horne BD, Knowlton KU, May HT, Le VT, Bair TL, Anderson JL. ROUTINE PERIODIC FASTING IS ASSOCIATED WITH A LOWER RISK OF INPATIENT HOSPITALIZATION FOR THE PRIMARY DIAGNOSIS OF HEART FAILURE FOLLOWING COVID-19 DIAGNOSIS. Elsevier BV; 2023. https://doi.org/10.1016/s0735-1097(23)02332-x
  9. 9. Crosby L, Davis B, Joshi S, Jardine M, Paul J, Neola M, et al. Ketogenic Diets and Chronic Disease: Weighing the Benefits Against the Risks. Frontiers Media SA; 2021. https://doi.org/10.3389/fnut.2021.702802
  10. 10. Wei SJ, Schell JR, Chocron ES, Varmazyad M, Xu G, Chen WH, et al. Ketogenic diet induces p53-dependent cellular senescence in multiple organs. American Association for the Advancement of Science (AAAS); 2024. https://doi.org/10.1126/sciadv.ado1463
  11. 11. Bjelakovic G, Nikolova D, Gluud LL, Simonetti RG, Gluud C. Antioxidant supplements for prevention of mortality in healthy participants and patients with various diseases. John Wiley & Sons, Ltd; 2008. https://doi.org/10.1002/14651858.cd007176
  12. 12. Halliwell B. The antioxidant paradox: less paradoxical now?. Wiley; 2013. https://doi.org/10.1111/j.1365-2125.2012.04272.x
  13. 13. Viña J, Borras C, Abdelaziz KM, Garcia-Valles R, Gomez-Cabrera MC. The Free Radical Theory of Aging Revisited: The Cell Signaling Disruption Theory of Aging. Mary Ann Liebert Inc; 2013. https://doi.org/10.1089/ars.2012.5111
  14. 14. Harris WS, Tintle NL, Etherton MR, Vasan RS. Erythrocyte long-chain omega-3 fatty acid levels are inversely associated with mortality and with incident cardiovascular disease: The Framingham Heart Study. Elsevier BV; 2018. https://doi.org/10.1016/j.jacl.2018.02.010
  15. 15. Chen G, Qian Z (Min), Zhang J, Zhang S, Zhang Z, Vaughn MG, et al. Regular use of fish oil supplements and course of cardiovascular diseases: prospective cohort study. BMJ; 2024. https://doi.org/10.1136/bmjmed-2022-000451
  16. 16. Zhang Y, Chadaideh KS, Li Y, Li Y, Gu X, Liu Y, et al. Butter and Plant-Based Oils Intake and Mortality. American Medical Association (AMA); 2025. https://doi.org/10.1001/jamainternmed.2025.0205
  17. 17. Grootveld M, Percival BC, Leenders J, Wilson PB. Potential Adverse Public Health Effects Afforded by the Ingestion of Dietary Lipid Oxidation Product Toxins: Significance of Fried Food Sources. MDPI AG; 2020. https://doi.org/10.3390/nu12040974
  18. 18. Nam TG. Lipid Peroxidation and Its Toxicological Implications. Springer Science and Business Media LLC; 2011. https://doi.org/10.5487/tr.2011.27.1.001
  19. 19. Mie A, Andersen HR, Gunnarsson S, Kahl J, Kesse-Guyot E, Rembiałkowska E, et al. Human health implications of organic food and organic agriculture: a comprehensive review. Springer Science and Business Media LLC; 2017. https://doi.org/10.1186/s12940-017-0315-4
  20. 20. Sawicki CM, Jacques PF, Lichtenstein AH, Rogers GT, Ma J, Saltzman E, et al. Whole- and Refined-Grain Consumption and Longitudinal Changes in Cardiometabolic Risk Factors in the Framingham Offspring Cohort. Elsevier BV; 2021. https://doi.org/10.1093/jn/nxab177
  21. 21. Hopkins E, Sharma S. Physiology, Acid Base Balance. 2019.
  22. 22. Fadnes LT, Celis-Morales C, Økland JM, Parra-Soto S, Livingstone KM, Ho FK, et al. Life expectancy can increase by up to 10 years following sustained shifts towards healthier diets in the United Kingdom. Springer Science and Business Media LLC; 2023. https://doi.org/10.1038/s43016-023-00868-w
  23. 23. Rattan SIS, Kaur G. Nutrition, Food and Diet in Health and Longevity: We Eat What We Are. MDPI AG; 2022. https://doi.org/10.3390/nu14245376
Clear jar of supplements beside capsules and powder on a pink background.

Creatine vs L-Carnitine: Which Supplement Fits Your Goals?

When you walk into any nutrition store, the supplement aisle can feel overwhelming. Two popular options that often catch attention are creatine and L-carnitine. Both promise to boost your performance, but they work in completely different ways.

Understanding which supplement aligns with your fitness goals can save you money and help you achieve better results. Let’s break down everything you need to know about these two powerhouse supplements.

Key Takeaways

  • Creatine powers short bursts of high-intensity activity, while L-carnitine supports fat burning during longer exercise
  • Creatine has superior safety with no major side effects, but L-carnitine may increase cardiovascular risk through TMAO production
  • Choose creatine for strength, power, and muscle growth – choose L-carnitine for endurance and fat loss goals
  • Creatine offers cognitive benefits beyond physical performance, making it more versatile for overall health

What are Creatine and L-Carnitine?

An image of creatine powder in a scoop with supplements in front

Both creatine and L-carnitine are naturally occurring compounds found in your body. But they serve entirely different purposes.

Creatine acts like a cellular battery charger. It helps regenerate ATP (your body’s energy currency) during intense, short bursts of activity. You’ll find creatine naturally in red meat and fish, though supplementation can boost your levels substantially.

L-carnitine works as a cellular transport system. It shuttles long-chain fatty acids into your mitochondria, where they get burned for energy. Your body produces some L-carnitine naturally, but levels can vary based on diet and genetics.

The key difference lies in their energy targets. Creatine focuses on immediate power output, while L-carnitine supports fat burning during longer activities.

Creatine vs Carnitine: How They Work

Clear jar filled with supplements against a pink backdrop

Understanding how these supplements function helps explain why they produce different results.

Creatine’s Power System

Creatine operates through the phosphocreatine energy system. When you perform high-intensity exercise, your skeletal muscle rapidly depletes ATP stores. Creatine steps in by donating phosphate groups to regenerate ATP almost instantly1.

This process happens during the first 10-15 seconds of intense activity. Think weightlifting, sprinting, or jumping. Creatine also stimulates muscle protein synthesis through the Akt/mTOR pathway, supporting muscle growth beyond just energy production2.

L-Carnitine’s Fat Transport Role

L-carnitine helps with a completely different process. This amino acid derivative transports long-chain fatty acids across the inner mitochondrial membrane for beta-oxidation. This mechanism becomes important during prolonged exercise when your body shifts toward fat as a primary fuel source3.

L-carnitine also helps regulate the acetyl-CoA/CoA ratio, which controls various metabolic pathways. This dual role makes it valuable for both energy production and cellular cleanup.

Benefits of Creatine for Muscle and Performance

Man exercising indoors

Research consistently shows creatine delivers impressive results across multiple areas of physical performance.

Physical Performance and Body Mass Gains

Studies demonstrate that creatine supplementation increases lean body mass by 0.9-2.2 kg over 4-6 weeks when combined with resistance training. The supplement excels for activities lasting 10 seconds to 2 minutes and increases body mass through improved muscle protein synthesis4.

Key performance benefits include:

  • Better power output during repeated high-intensity exercise
  • Improved recovery between training sessions
  • Increased muscle strength and mass
  • Better performance in explosive movements

Cognitive and Brain Health Benefits

One of creatine’s most underappreciated benefits involves brain function. Research shows creatine can improve memory and cognitive performance, particularly in older adults5.

Your brain uses about 20% of your daily energy despite being only 3% of your body weight. When NAD levels drop with age, your brain becomes especially vulnerable to energy deficits. Creatine as a nootropic provides cognitive support by maintaining cellular energy reserves.

For the best brain health benefits, our Creatine + ATP supplement combines 4g of creatine monohydrate with 400mg of disodium ATP, supporting both physical and mental performance.

Benefits of L-Carnitine and Supplement Considerations

L-carnitine offers different advantages, though the research shows mixed results for this dietary supplement.

Fat Oxidation and Endurance Benefits

L-carnitine shines during prolonged exercise, where fat oxidation becomes important. Studies show better fat burning during endurance activities and improved exercise tolerance in some populations6.

Benefits of l-carnitine supplementation include:

  • Better fat oxidation during prolonged exercise
  • Reduced exercise-induced muscle damage markers
  • Improved recovery from high-intensity training
  • Better exercise tolerance in specific populations

L-carnitine supplementation proves particularly valuable for vegetarians who consume less meat and fish, the primary dietary sources of this compound. Dairy products contain minimal amounts compared to red meat.

The TMAO Concern

But taking carnitine comes with an important caveat. Gut bacteria can convert L-carnitine into trimethylamine (TMA), which your liver then transforms into TMAO (trimethylamine N-oxide).

Elevated TMAO levels are linked to increased cardiovascular risk, including atherosclerosis and heart attacks. Studies show TMAO increases major cardiovascular event risk by 23-33%, particularly in people with existing heart conditions7.

Creatine and Carnitine: Safety and Side Effects

Blue pill organizer labeled noon, eve, and bed with several pills placed in front of it.

Safety profiles differ substantially between these two nutritional supplements.

Creatine’s Excellent Safety Record

Creatine has an outstanding safety profile when used at recommended doses of 3-5g daily. Long-term studies show no adverse effects on kidney function in healthy individuals8.

Common myths include water retention causing bloating (actually supports muscle growth) and hair loss concerns (no scientific evidence). Many creatine myths have been thoroughly debunked by research.

L-Carnitine Safety Considerations

L-carnitine is generally safe at doses up to 6000mg daily. But the TMAO production creates potential cardiovascular risks that require careful consideration, especially for long-term use.

Individual responses vary substantially based on gut microbiome composition. Some people produce more TMAO than others from the same L-carnitine dose.

Choosing Between Creatine and L-Carnitine Based on Your Goals

An image of a woman taking supplement

Your specific goals should guide your supplement choice when deciding between these options.

Choose Creatine For:Choose L-Carnitine For:
Strength and power sportsEndurance and fat oxidation
Muscle mass gainWeight management goals
High-intensity exerciseVegetarian diets
Cognitive function supportAge-related energy decline
Recovery between workoutsMetabolic stress recovery

Creatine Protocol

Getting started with creatine typically involves a loading phase of 20g daily for 5-7 days, followed by 3-5g daily maintenance. You can take creatine with meals or post-workout for better absorption.

This amino acid works particularly well for activities requiring short bursts of maximal effort, supporting both muscle performance and cognitive function.

L-Carnitine Protocol

The recommended protocol involves 2-3g daily, preferably with meals. Consider cycling on and off to minimize TMAO accumulation.

L-carnitine proves most beneficial for endurance athletes and those focused on fat loss during physical activity.

Creatine vs L-Carnitine: Dosage and Timing Considerations

Supplement powder with scoops, capsules, a measuring tape, and gym equipment on a dark surface.

Understanding proper dosage becomes critical for maximizing benefits while minimizing risks.

Creatine Supplementation Protocol

For muscle performance and athletic performance improvement, creatine monohydrate remains the gold standard. The typical dosage involves:

  • Loading phase: 20g daily for 5-7 days (split into 4 doses)
  • Maintenance: 3-5g daily or 0.1g per kg of body weight
  • Timing: Post-workout or with carbohydrates for better uptake

Creatine supplements work best when taken consistently. The compound accumulates in skeletal muscle over time, so missing occasional doses won’t impact results substantially.

L-Carnitine Supplementation Guidelines

L-carnitine supplementation requires different considerations due to absorption challenges and the TMAO concern:

  • Standard dosage: 2-3g daily with meals
  • Higher doses (up to 6g) may be used short-term under supervision
  • Take with dietary fat to improve bioavailability
  • Consider cycling periods to minimize cardiovascular risks

Can You Take Creatine and L-Carnitine Together?

Some research suggests combining creatine and carnitine may boost muscle protein synthesis beyond either supplement alone for improved exercise performance9.

But this combination requires careful consideration of:

  • Cumulative cardiovascular effects from TMAO production
  • Individual response variations based on gut microbiome
  • Monitoring of cardiovascular risk factors during physical activity

Choosing the best creatine form becomes important when combining supplements to avoid unnecessary additives.

Timing Considerations for Combined Use

Creatine absorption improves when taken with carbohydrates or after a workout. L-carnitine bioavailability increases with lipid-based formulations and when taken with meals containing fat.

For age-related considerations, creatine for older adults may require adjusted dosing and timing strategies to support energy metabolism.

Creatine vs L-Carnitine for Special Populations

A group of athletes

Different groups may benefit more from one supplement over the other.

Vegetarian Athletes

Vegetarians typically have lower creatine stores since meat and fish provide the primary dietary sources. They may see greater benefits from creatine supplementation compared to omnivores.

L-carnitine levels may also be lower in vegetarians, though the cardiovascular risks from supplementation remain the same regardless of dietary pattern.

Women and Hormonal Considerations

Women may have specific considerations regarding both supplements. Creatine appears safe and effective across menstrual cycles, while L-carnitine’s effects may vary with hormonal fluctuations.

Body composition changes from creatine often favor lean muscle gain rather than overall weight increase, which many women prefer for their fitness goals.

Final Recommendations

Choose creatine if your primary goals involve power, strength, muscle mass, or cognitive function. Its safety profile is excellent, effects are well-documented, and benefits extend beyond physical performance.

Choose L-carnitine if you focus on fat oxidation, endurance performance, or metabolic health, but carefully consider cardiovascular risk factors and monitor TMAO levels for long-term use.

The decision depends on your specific goals, health status, and risk tolerance. Both supplements can be valuable tools when used appropriately, but understanding their mechanisms and limitations helps you make the best choice for your fitness journey.

For many people seeking complete support, creatine’s broader benefits and superior safety profile make it the more practical choice among these nutritional supplements. Creatine also provides better value as a dietary supplement that supports multiple aspects of health and performance.

References:

  1. https://pmc.ncbi.nlm.nih.gov/articles/PMC2517207/ ↩︎
  2. https://www.sportsmedoa.com/journals/jsmt/jsmt-aid1068.php ↩︎
  3. https://pmc.ncbi.nlm.nih.gov/articles/PMC6982879/ ↩︎
  4. https://pmc.ncbi.nlm.nih.gov/articles/PMC3750511/ ↩︎
  5. https://pmc.ncbi.nlm.nih.gov/articles/PMC10721691/ ↩︎
  6. https://www.mdpi.com/2072-6643/13/12/4359/pdf ↩︎
  7. https://pmc.ncbi.nlm.nih.gov/articles/PMC5586261/ ↩︎
  8. https://pmc.ncbi.nlm.nih.gov/articles/PMC7871530/ ↩︎
  9. https://pmc.ncbi.nlm.nih.gov/articles/PMC8625796/ ↩︎
An image of matured couple eating healthy foods

Healthiest Diet for a Long Life: 8 Simple Choices for Longevity

What if the secret to a longer, healthier life wasn’t hidden in some exotic superfood or complicated fasting protocol? Recent groundbreaking research reveals that the path to longevity lies in surprisingly simple dietary choices that anyone can follow.

A landmark 30-year Harvard study tracking over 105,000 adults discovered something remarkable. Those who followed specific eating patterns had an 86% greater likelihood of reaching age 70 in good health and were 2.24 times more likely to maintain their vitality at age 75.

The winning approach? The Alternative Healthy Eating Index (AHEI), which outperformed even the famous Mediterranean diet in promoting healthy aging.

Key Takeaways

  • The Alternative Healthy Eating Index (AHEI) beats the Mediterranean diet for healthy aging
  • Plant-forward eating with minimal processing delivers the strongest longevity benefits
  • Blue Zones have been debunked due to poor record-keeping and age fraud
  • Simple, gradual changes work better than extreme dietary restrictions

The Science Behind Dietary Patterns for Longevity

Image of healthy meal prepped

The research foundation for healthy aging through diet has never been stronger. Unlike trendy approaches that come and go, these findings represent one of the most thorough investigations into diet and longevity to date.

Interestingly, the popular Blue Zones concept has been largely debunked by recent research. Dr. Saul Newman of Oxford University, who won an Ig Nobel Prize for his work, found that many Blue Zones regions suffered from poor record-keeping and pension fraud1.

As Newman noted, “42% of the centenarians in Costa Rica turned out to be lying about their age after the study was conducted.”

This makes the Harvard research even more valuable. It relied on rigorous data collection and verified health outcomes over three decades.

8 Evidence-Based Choices for a Healthy Diet to Live Longer

Image of healthy plant-based protein rich foods

The following dietary choices emerge from decades of research into what actually works for extending healthy lifespan. Each recommendation is backed by large-scale studies and real-world evidence.

1. Choose Plant Proteins Over Animal Sources

Plant-based proteins from legumes, nuts, seeds, and whole grains should anchor your meals. Research shows women who consume more plant protein in midlife were 46% more likely to age healthily, while those eating more animal protein were 6% less likely to maintain good health2.

A global study found that countries with higher plant-based protein consumption had longer adult life expectancy rates, with findings associated with lower rates of chronic disease across populations3.

Simple action: Replace one serving of animal protein daily with plant options like lentils, chickpeas, tofu, or quinoa.

2. Embrace Healthy Fats for Brain Health

Omega-3 fatty acids play an important role in healthy aging by reducing inflammation and supporting brain function. Research indicates an optimal intake threshold of approximately 1.1 grams per day, beyond which additional benefits plateau4.

These healthy fats improve mitochondrial function, which ties directly to cellular health supplements that support your body’s energy production systems.

Top sources include:

  • Fatty fish twice weekly
  • Ground flaxseeds or chia seeds
  • Walnuts as regular snacks
  • Extra virgin olive oil

3. Boost Fiber Intake for Gut Health and Longevity

Dietary fiber promotes healthy aging by supporting beneficial gut bacteria that produce protective short-chain fatty acids. Long-term high fiber intake from infancy is associated with improved gut microbiome composition in young adults5.

Most adults should target 25-35 grams of fiber daily from diverse plant sources. This whole-grain and vegetable-rich approach naturally supports the healthy eating patterns that research links to extended lifespan. Focus on getting fiber from each major food group to increase diversity.

Fiber-rich choices:

  • Vegetables and fruits with every meal
  • Whole grains instead of refined options
  • Daily servings of legumes
  • Mixed nuts and seeds

4. Avoid Ultra-Processed Foods

Ultra-processed foods accelerate biological aging beyond what poor nutrition alone would predict. Adults with higher ultra-processed food consumption showed 0.86 years of accelerated biological aging compared to those with lower intake6.

These foods promote inflammation and oxidative stress, contributing to the oxidative stress that damages cells and accelerates aging. Studies consistently show patterns associated with lower life expectancy in populations consuming more ultra-processed options.

Red flags to watch for:

  • More than 5 ingredients on labels
  • Unfamiliar chemical additives
  • Foods that don’t resemble their original form
  • Items with long shelf lives due to preservatives

5. Balance Protein Intake Based on Your Age

Protein needs change as we age, and getting this balance right affects how well we maintain muscle mass and overall health. For adults under 65, moderate protein intake (10-19% of calories) supports longevity goals.

Yet older adults benefit from higher protein intake (1.2-2.0g/kg body weight) to prevent muscle loss and frailty. This aligns with research on longevity supplements that support healthy aging at different life stages. Maintaining adequate protein intake also helps regulate body mass index as we age.

Age GroupProtein TargetFocus
Under 6510-19% of caloriesPlant-based sources
Over 651.2-2.0g/kg body weight25-30g per meal

6. Include Anti-Inflammatory Polyphenols Daily

Polyphenols are powerful antioxidants that combat cellular aging by reducing oxidative stress and preventing cellular senescence. These compounds are abundant in colorful fruits, vegetables, herbs, and spices.

Turmeric deserves special mention here. This golden spice contains curcumin, one of the most potent anti-inflammatory compounds found in nature. For maximum benefit, our Extra Strength Turmeric+ combines curcumin with black pepper extract, Boswellia, ginger and quercetin to increase absorption by up to 2000%.

Daily polyphenol sources:

  • Mixed berries
  • Dark leafy greens
  • Green tea
  • Extra virgin olive oil
  • Herbs like turmeric and oregano

7. Practice Moderate Caloric Awareness

Recent research confirms that genetic resilience matters more than extreme caloric restriction for longevity. The mice that lived longest on restricted diets were those that maintained their weight and immune function despite eating less7.

This suggests moderate caloric awareness (10-20% reduction) may be more beneficial than severe restriction for most people. This approach helps maintain healthy body mass index ranges without the metabolic stress of extreme dieting.

Focus on nutrient density rather than extreme calorie cutting. Listen to your body’s hunger and satiety signals while choosing foods that deliver maximum nutrition per calorie.

8. Consider Timing Your Eating Windows

While extreme time-restricted eating (under 8 hours) may increase cardiovascular disease risk, moderate approaches can provide metabolic benefits when combined with a healthy diet.

Research suggests 10-12 hour eating windows offer the best balance of benefits without negative health impacts. The key lies in consistency and ensuring adequate nutrition within your chosen timeframe.

If you try time-restricted eating:

  • Maintain 10-12 hour eating windows
  • Prioritize food quality over timing restrictions
  • Focus on getting all important nutrients
  • Monitor how you feel and adjust accordingly

The Mediterranean Diet Connection

Image of Mediterranean diet

Both the AHEI and Mediterranean approaches share similar foundations for promoting longevity. The Mediterranean diet remains one of the most studied dietary patterns for longevity, though the AHEI approach edges it out in recent research.

Both dietary patterns emphasize whole foods, healthy fats, and moderate portions while limiting processed foods and excessive red meat consumption. The Mediterranean approach offers a time-tested method that many find easier to follow long-term.

These dietary patterns work together with lifestyle factors that support healthy aging, including stress management and maintaining NAD levels by age for optimal cellular function.

Public Health Impact of Longevity Nutrition

Hands protecting a red heart with a paper-cutout silhouette of a family, symbolizing healthcare, family protection, or insurance.

The implications for public health are notable. If more people adopted these evidence-based dietary patterns, we could see important reductions in chronic disease rates and healthcare costs.

Research consistently shows that populations following these principles have a lower risk of heart disease, type 2 diabetes, and all-cause mortality. This creates a powerful case for promoting these dietary approaches at the community level.

The focus on whole foods and plant-forward eating also supports environmental health, creating benefits that extend beyond individual longevity.

Putting This Into Practice

An image of a woman holding a glass of fruit smoothie

Making lasting changes doesn’t require dramatic overhauls. Start with one change per week rather than overhauling your entire diet overnight. The research shows that dietary patterns matter more than individual nutrients, so aim for gradual, sustainable improvements.

Week-by-week approach:

  • Week 1: Add one plant protein meal daily
  • Week 2: Include healthy fats with each meal
  • Week 3: Boost fiber with whole grains and vegetables
  • Week 4: Eliminate one ultra-processed food

This gradual approach helps create lasting habits that support long-term health goals.

Beyond Diet: The Complete Longevity Picture

APRIL JF Blogs1 34

While diet forms the foundation of healthy aging, it works best as part of a complete approach. Regular physical activity, stress management, quality sleep, and maintaining social connections all contribute to longevity.

Supporting your body’s natural aging processes with anti-aging vitamins and minerals can complement these dietary choices for optimal results.

The evidence is clear: a plant-forward, minimally processed dietary pattern rich in fiber, healthy fats, and polyphenols provides the strongest foundation for healthy aging. These choices, backed by decades of rigorous research, offer a practical pathway to not just living longer, but living better.

By focusing on these eight simple choices, you’re not just adding years to your life – you’re adding life to your years. The research shows that it’s never too early or too late to start making these changes that can transform how you age.

Referenced Sources:

  1. https://www.aljazeera.com/news/2024/9/26/the-secret-of-blue-zones-where-people-reach-100-fake-data-says-academic ↩︎
  2. https://hsph.harvard.edu/news/plant-protein-women-healthy-aging/ ↩︎
  3. https://www.sciencedaily.com/releases/2025/04/250415144002.htm ↩︎
  4. https://www.asbmb.org/asbmb-today/science/080125/omega-3-fats-linked-healthy-aging-metabolism ↩︎
  5. https://www.medicalnewstoday.com/articles/short-term-increase-in-fiber-alters-gut-microbiome ↩︎
  6. https://www.medicalnewstoday.com/articles/ultra-processed-foods-may-accelerate-biological-aging-2 ↩︎
  7. https://www.jax.org/news-and-insights/2024/october/study-probes-how-eating-less-can-extend-lifespan ↩︎
A close up image of a woman taking supplement

Creatine Nitrate vs Monohydrate: What Science Actually Says

Creatine monohydrate has dominated the supplement world for decades. It’s the gold standard that most people reach for when they want to boost their workout performance.

But you might have noticed creatine nitrate appearing on supplement labels lately. This newer form promises better absorption and claims to work just as well as the classic version.

Is it worth switching from the tried-and-true monohydrate? We dug into the research to find out which form actually delivers better results.

Key Takeaways

  • Creatine nitrate showed 38% better absorption and nearly 4x faster muscle creatine uptake in a small study
  • Nitrate form has fewer non-responders (20% vs 30%) but costs 2-3x more than monohydrate
  • Creatine monohydrate has decades of safety research, while nitrate has limited long-term data
  • Both forms improve exercise performance, but monohydrate remains the gold standard for most users

What Makes These Types of Creatine Different?

An open blue container of white powder, spilled onto a green surface with a yellow scoop resting in the powder.

The key difference between monohydrate and nitrate lies in what’s attached to the creatine molecule.

Creatine monohydrate binds creatine to a simple water molecule, creating the most basic and well-researched form available.

Creatine nitrate represents a modern creatine derivative which bonds creatine to nitrate molecules. The new formula provides enhanced water solubility which enables it to dissolve more effectively in stomach acid. The effects of creatine nitrate stem largely from this enhanced bioavailability.

The improved solubility should result in better absorption through the intestinal wall. People who have poor responses to standard creatine monohydrate supplements might experience improved results when using the nitrate form according to this evidence.

Creatine Monohydrate: The Gold Standard

A woman in workout attire scooping protein powder into a shaker bottle from a large black container, suggesting supplement preparation post-workout.

Creatine monohydrate remains the gold standard in sports nutrition for good reason. With over 685 clinical trials involving 12,839 participants, it’s the most extensively studied supplement for muscle performance1.

This well-researched form helps your muscles regenerate ATP (adenosine triphosphate) during high-intensity exercise. When you lift weights or sprint, your muscles quickly burn through their ATP stores. Creatine helps replenish these energy stores by donating phosphate groups to create phosphocreatine.

Creatine monohydrate may also support muscle growth through several mechanisms. It enhances protein synthesis by providing the energy needed for amino acids to build new muscle tissue. Many products use micronized creatine monohydrate for improved mixing and absorption.

The typical dosing protocol involves either:

  • Loading phase: 20 grams daily for 5-7 days, then 3-5 grams daily
  • No loading: 3-5 grams per day from the start

Research shows both approaches work equally well over time. The loading method just gets you to peak muscle creatine levels faster.

Creatine Nitrate vs Monohydrate: Absorption and Bioavailability

A hand is holding a gold spoon filled with white powdered supplement over a glass of water.

A controlled study with 10 healthy men revealed striking differences in how well each form gets absorbed. The results show creatine nitrate’s clear advantage in bioavailability2.

Absorption MetricCreatine MonohydrateCreatine Nitrate
Peak serum levels (60 min)118.6 ± 12.9 µmol/L163.8 ± 12.9 µmol/L
Area under curve466.3 ± 47.9 (µmol/L) × min622.7 ± 62.9 (µmol/L) × min
5-day muscle creatine increase2.1%8.0%

The nitrate group achieved nearly four times greater muscle creatine uptake after just five days. This suggests creatine nitrate may offer faster results for building your body’s creatine stores.

Even more interesting, creatine nitrate showed a lower non-responder rate. About 30% of people don’t respond to creatine monohydrate, but only 20% failed to respond to the nitrate form.

Both creatine monohydrate and creatine nitrate share similar absorption pathways. Yet the nitrate version’s enhanced solubility gives it a significant advantage in reaching muscle tissue.

Which Form of Creatine is Best for Performance?

A fit woman performing a lunge exercise indoors while holding small dumbbells, wearing athletic clothes and standing in front of a large window with greenery outside.

Both forms improve exercise performance, but the research on direct comparisons remains limited. One 28-day study found that 3 grams daily of creatine nitrate produced better bench press improvements compared to the same dose of creatine monohydrate3.

For power output and strength gains, both forms show similar benefits:

  • Increased peak power during short bursts
  • Better performance in repeated high-intensity efforts
  • Enhanced recovery between sets

The nitrate component theoretically provides additional benefits through nitric oxide enhancement. This may enhance exercise capacity by improving blood flow and nutrient delivery to working muscles.

For endurance activities, both forms show modest benefits. Still, creatine’s primary advantage remains in high-intensity, short-duration efforts. The better blood flow from creatine nitrate could theoretically help with sustained activities.

Creatine monohydrate has established cognitive benefits that extend beyond muscle performance. It can improve working memory and reduce mental fatigue, making it valuable for creatine as a nootropic.

Safety: Nitrate and Monohydrate Compared

White creatine powder spilled from a container onto a stone surface.

Both forms show acceptable safety profiles, but with different considerations based on research depth.

Creatine monohydrate safety studies show side effects occur in only 13.7% of studies, similar to placebo groups at 13.2%. The most common issues are minor digestive upset and temporary water retention4.

For those concerned about creatine myths like kidney damage, extensive research shows no causal relationship in healthy individuals.

Creatine nitrate has much less safety data, with only one 28-day safety study in 58 participants. This study found no significant adverse effects on liver or kidney function markers. People with low blood pressure should exercise caution due to nitrate’s potential vasodilatory effects5.

One notable issue: 80% of creatine nitrate users reported an unpleasant odor with the supplement. This palatability problem could affect long-term compliance.

Nitrate or Monohydrate: Dosage Requirements

Close-up of a supplement facts label on a bottle, showing serving size of 3 tablets and 30 servings per container

Understanding proper dosing helps you get the most from creatine supplementation. The approach differs slightly between forms.

Creatine Monohydrate Dosing:

  • Loading: 20 grams daily for 5-7 days
  • Maintenance: 3-5 grams daily
  • Alternative: 3-5 grams per day without loading

Creatine Nitrate Dosing:

  • Studies used 3-6 grams daily
  • May require shorter or no loading due to better absorption
  • Best protocols still being researched

Due to superior absorption, creatine nitrate may work effectively at lower doses. Still, more research is needed to establish the most effective dosing strategies.

If you’re new to creatine supplementation, our creatine starter guide covers everything you need to know about timing and loading phases.

Cost Considerations Between Forms

Two identical white jars with black lids are placed on opposite ends of a white seesaw balanced on a yellow sphere, with the left side tilted downward.

Cost becomes a significant factor when choosing between these forms. Creatine monohydrate costs substantially less due to simpler manufacturing and wider availability from multiple suppliers.

Creatine nitrate typically costs 2-3 times more than monohydrate because of:

  • More complex production processes
  • Limited suppliers with fewer generic options
  • Premium positioning in the market

For most people, the cost difference raises questions about value. While nitrate shows better absorption, whether this justifies the higher price depends on your specific needs and budget.

Many pre-workout supplements now include creatine nitrate due to its enhanced solubility and potential blood flow benefits.

Creatine Monohydrate Supplements: Maximizing Your Choice

A hand holding a plain white supplement bottle against a vibrant orange background.

When selecting any form of creatine, quality matters significantly. Look for products that combine creatine with complementary ingredients for enhanced effectiveness.

Our Creatine + ATP supplement provides 4g of creatine monohydrate plus 400mg of disodium ATP. This combination delivers immediate energy support while building long-term muscle creatine stores.

The ATP component bridges the gap during your first weeks of supplementation. While your muscles gradually increase their creatine phosphate levels, the added ATP provides instant energy for high-intensity training. This dual approach makes it particularly effective for those just starting creatine supplementation.

Bonus Read: Understanding the connection between creatine and ATP helps explain why this combination works so well for muscle performance and recovery.

Blood Flow and Nitric Oxide Benefits

3D medical illustration of red and white blood cells flowing through an artery, representing circulation, cardiovascular health, or blood function.

One unique advantage of creatine nitrate lies in its potential for improving blood flow through nitric oxide pathways. Each creatine molecule bound to nitrate may enhance circulation by promoting vasodilation in blood vessels.

This better blood flow could theoretically provide several benefits:

  • Enhanced nutrient delivery to working muscles
  • Improved oxygen transport during exercise
  • Faster removal of metabolic waste products

The nitrate may offer additional performance benefits beyond what creatine alone provides. Yet, studies specifically demonstrating these cardiovascular benefits with creatine nitrate supplementation remain limited compared to the extensive research on creatine monohydrate6.

Special Considerations for Different Groups

Smiling older women representing safe and beneficial creatine use for women and adults over 40, supporting muscle and cognitive health.

Certain populations may benefit more from one form over another. Women often have questions about creatine supplementation regarding weight gain and hormonal effects.

Adults over 40 may find specific benefits in creatine supplementation for older adults, including cognitive support and muscle preservation.

Both forms appear safe for these groups, though the extensive research base favors creatine monohydrate for long-term use. As dietary supplements, creatine products are suitable for most healthy individuals regardless of age or gender.

Making Your Choice: The Bottom Line

Text "RIGHT CHOICE" written in chalk on a blackboard, with a red heart shape replacing the letter "O" in "CHOICE," symbolizing a healthy or emotionally positive decision.

The decision between creatine nitrate vs monohydrate comes down to your priorities and response to supplementation.

Choose creatine monohydrate if you:

  • Want the most cost-effective option
  • Prefer extensively researched supplements available
  • Seek proven cognitive and muscle performance benefits
  • Are starting with creatine for the first time

Consider creatine nitrate if you:

  • Haven’t responded well to creatine monohydrate
  • Want potentially faster muscle creatine uptake
  • Don’t mind paying premium prices
  • Are willing to try a newer supplement with less research

For most people, creatine monohydrate remains the smart choice. Its combination of proven effectiveness, extensive safety data, and affordable pricing makes it the gold standard.

But if you’re among the 30% who don’t respond to traditional creatine monohydrate, the nitrate form offers a promising alternative. The superior absorption rates and lower non-responder rate make it worth considering despite the higher cost.

When choosing any types of creatine, remember that consistency matters more than the specific form. The best creatine supplement is the one you’ll take regularly as part of your overall fitness and nutrition strategy.

Both forms can boost skeletal muscle performance and support your training goals. The key is finding the right fit for your body, budget, and long-term health objectives.

Referenced Sources:

  1. https://pmc.ncbi.nlm.nih.gov/articles/PMC2206055/ ↩︎
  2. https://link.springer.com/10.1007/s00726-024-03401-w ↩︎
  3. https://onlinelibrary.wiley.com/doi/10.1002/fsn3.1237 ↩︎
  4. https://www.mdpi.com/2072-6643/9/12/1359/pdf ↩︎
  5. https://pmc.ncbi.nlm.nih.gov/articles/PMC11629957/ ↩︎
  6. https://www.frontiersin.org/articles/10.3389/fspor.2022.1033842/full ↩︎

Account Access

Welcome back

Continue your health journey with a secure login.