
Secure • Private • Science-backed
Multiple blood test vials against a yellow background.

What is 8-OHdG? Understanding DNA Oxidative Stress

Free radicals damage your DNA constantly during normal metabolism. Your cells work to fix this damage around the clock.

A biomarker called 8-OHdG can tell you how effectively your body manages this repair work.

The biomarker of oxidative stress 8-OHdG has been studied in relation to cancer, heart disease, diabetes and aging. It’s also used by doctors to help assess oxidative stress and disease risk.

What You Should Know

  • 8-OHdG measures oxidized DNA damage from free radicals throughout your body
  • Higher levels connect to increased risk of cancer, cardiovascular disease, and neurodegeneration
  • Urine or blood tests reveal your 8-OHdG status with results typically ranging from 0-5.2 ng/mg creatinine for optimal health
  • Antioxidants, better diet, regular exercise, and stress reduction can lower elevated levels

What is 8-OHdG (8-Hydroxy-2-deoxyguanosine)?

When free radicals damage guanine (a DNA building block), they create a modified molecule called 8-hydroxy-2′-deoxyguanosine (8-OHdG). Your body generates these free radicals naturally through metabolism, and they multiply when you face stress or toxin exposure[1].

Guanine takes more hits from oxidation than the other three DNA bases. Free radicals target a specific location on guanine and transform it into 8-OHdG.

Your cellular repair machinery identifies this DNA damage and “cuts” it away. The removed 8-OHdG circulates through your blood and gets filtered into your urine in its original form.

Testing urine samples for levels of 8-OHdG paints a picture of how much oxidative damage to DNA you may be experiencing[2]. The concentration reflects both the rate of DNA damage and how hard your cells work to fix it.

Comprehensive Health Assessment

Test 8-OHdG with 27 other longevity markers.

Jinfiniti AgingSOS green gradient background

Why 8-OHdG Testing Matters

Elevated 8-OHdG levels have been linked to a number of significant health issues. The biomarker acts as an early warning system, before symptoms manifest.

As one review noted: “The biomarker 8-OHdG has been used widely in many studies not only as a measurement of endogenous oxidative DNA damage but also as a risk factor for many diseases including cancer.”[1]

Cancer Risk Assessment

People with urinary 8-OHdG concentrations above 1.5 nmol/mmol creatinine face 3.68 times higher colorectal cancer risk compared to those with lower levels. Cancer tissue consistently shows elevated 8-OHdG compared to healthy adjacent tissue[3].

The damage becomes dangerous when 8-OHdG escapes repair before cell division. It can mispair with the wrong DNA base during replication, causing mutations that drive cancer development.

Breast cancer and prostate cancer patients both show significantly higher 8-OHdG than healthy controls[4]. The marker increases with cancer progression and metastasis.

Heart and Brain Health

A systematic review of 18 studies found elevated 8-OHdG consistently associated with atherosclerosis, heart failure, and stroke[5]. Blood and urine levels correlate with heart disease severity.

In Parkinson’s disease, cerebrospinal fluid 8-OHdG rises significantly[6]. The biomarker may help with early diagnosis of neurodegenerative conditions before major symptoms develop.

Elderly people with elevated plasma 8-OHdG face increased risk of motoric cognitive risk syndrome. This suggests value as an early detection tool for cognitive and motor decline.

Diabetes and Aging

Type 2 diabetics show significantly increased oxidative DNA damage[7]. Levels climb higher in patients with advanced complications like proliferative retinopathy and nephropathy.

The marker rises even in prediabetes, making it potentially more sensitive than traditional indicators. Studies suggest 8-OHdG helps monitor disease progression and complication risk.

Dr. Jin-Xiong She, founder of Jinfiniti Precision Medicine, explains: “8-OHdG levels can tell us how well someone is aging at the cellular level. Your DNA repair systems slow down as you get older, and 8-OHdG shows the mounting damage that eventually leads to age-related diseases.”

🧬 MORE BIOMARKERS

  • Kidney function markers tell their own story. Understanding cystatin C levels reveals filtration capacity beyond standard tests.
  • Protein status affects cellular repair. Learn what albumin blood test results mean for overall health.
  • Muscle and heart health show up in the numbers. Discover why creatine kinase levels matter for tissue damage assessment.

Understanding Your 8-OHdG Results

Test results vary based on measurement method and units used. Knowing what’s normal helps you interpret your numbers.

Research on healthy populations established typical reference ranges[2]:

  • Women: 43.9 ± 42.1 ng/mg creatinine (urinary)
  • Men: 29.6 ± 24.5 ng/mg creatinine (urinary)
  • Optimal range: 0-5.2 ng/mg creatinine

Healthy people show an eleven-fold variation in levels. Your values also fluctuate throughout the day, ranging from 3.76 ng/mg in early morning to 6.46 ng/mg in early afternoon for men.

The type of test matters for interpretation:

  • Plasma 8-OHdG: Instantaneous balance between damage and repair
  • Urinary 8-OHdG: Total body damage over time

Results above optimal ranges warrant identifying oxidative stress sources. This includes evaluating antioxidant status and inflammatory markers.

What Raises 8-OHdG Levels?

Multiple factors influence your oxidative DNA damage. Some you can control, others require awareness and protection.

Certain lifestyle habits drive DNA damage higher:

  • Smoking: Smokers show significantly higher levels[8]
  • Long working hours: Work-related stress predicts increased 8-OHdG independent of other factors[9]
  • Stress hormones: The biomarker correlates with evening cortisol and inflammation markers[10]

Your surroundings contribute to oxidative stress:

  • Radiation workers and interventional physicians show elevated levels[11]
  • Air pollution in high-traffic areas increases oxidative damage
  • Industrial chemical exposure drives up DNA damage markers

Physical activity affects 8-OHdG differently based on intensity:

  • Resistance training temporarily increases circulating 8-OHdG in all people[12]
  • Long-duration aerobic exercise decreases levels in untrained individuals
  • Regular moderate activity provides the best protection[13]

What you eat plays a protective role:

  • Low meat intake paradoxically increases 8-OHdG[13]
  • Soybeans, rice, and light-colored vegetables correlate with lower levels
  • Vitamin intake significantly decreases damage

Managing chronic stress is one of the most important things you can do for DNA protection.

How to Reduce High 8-OHdG

When testing reveals elevated oxidative DNA damage, several evidence-based approaches can help restore healthy levels.

Research demonstrates measurable benefits from specific antioxidants:

  • Vitamin E (200 IU daily): 33.8% reduction in smokers[14]
  • Vitamin C (500 mg): Significant decrease in oxidative markers
  • Red ginseng (1.8 g daily): 31.7% reduction in 8-OHdG
  • Coenzyme Q10: Mean reduction of 2.9 ± 2.9 pg/ml[15]
  • High-dose folic acid (0.8 mg): Dose-response protective effects

Simple dietary adjustments make a real difference:

  • Increase fruit and vegetable intake consistently
  • Orange juice helped metabolic syndrome patients lower levels and lose weight[16]
  • Fish oil (EPA/DHA) helps smokers with high 8-OHdG[17]

Basic lifestyle changes provide strong protection:

  • Regular moderate exercise: Studies show significant 8-OH-dG reduction
  • Smoking cessation: Damage reverses over time after quitting
  • Stress management: Lower cortisol to protect DNA

Supporting your body’s master antioxidant glutathionethroughdiet or N-acetyl cysteine may help address core antioxidant defenses. This becomes particularly helpful when multiple oxidative stress markers are elevated.

Bottom Line

8-OHdG measures oxidative damage to your DNA and predicts disease risk years before symptoms appear. Testing reveals your cellular stress burden and guides targeted interventions to protect your genetic material and extend your healthspan.

Jinfiniti’s AgingSOS panel includes 8-OHdG alongside 27 other longevity biomarkers, giving you a complete picture of cellular aging. Get tested, identify your risks early, and take action based on real data.

Referenced Sources

  1. VALAVANIDIS A, VLACHOGIANNI T, FIOTAKIS C. 8-hydroxy-2′ -deoxyguanosine (8-OHdG): A Critical Biomarker of Oxidative Stress and Carcinogenesis. Informa UK Limited; 2009. https://doi.org/10.1080/10590500902885684
  2. Wu LL, Chiou CC, Chang PY, Wu JT. Urinary 8-OHdG: a marker of oxidative stress to DNA and a risk factor for cancer, atherosclerosis and diabetics. Elsevier BV; 2004. https://doi.org/10.1016/j.cccn.2003.09.010
  3. Guo C, Li X, Wang R, Yu J, Ye M, Mao L, et al. Association between Oxidative DNA Damage and Risk of Colorectal Cancer: Sensitive Determination of Urinary 8-Hydroxy-2′-deoxyguanosine by UPLC-MS/MS Analysis. Springer Science and Business Media LLC; 2016. https://doi.org/10.1038/srep32581
  4. Kuo HW, Chou SY, Hu TW, Wu FY, Chen DJ. Urinary 8-hydroxy-2′-deoxyguanosine (8-OHdG) and genetic polymorphisms in breast cancer patients. Elsevier BV; 2007. https://doi.org/10.1016/j.mrgentox.2007.04.009
  5. Kroese LJ, Scheffer PG. 8-Hydroxy-2′-Deoxyguanosine and Cardiovascular Disease: a Systematic Review. Springer Science and Business Media LLC; 2014. https://doi.org/10.1007/s11883-014-0452-y
  6. Dai Q, Ma Y, Liu C, Zhao R, Chen Q, Chen W, et al. Association of 8-hydroxy-2′-deoxyguanosine with motoric cognitive risk in elderly Chinese people: RUGAO longevity and aging cross-sectional study. Springer Science and Business Media LLC; 2024. https://doi.org/10.1186/s12877-024-04943-0
  7. Shin CS, Moon BS, Park KS, Kim SY, Park SJ, Chung MH, et al. Serum 8-Hydroxy-Guanine Levels Are Increased in Diabetic Patients. American Diabetes Association; 2001. https://doi.org/10.2337/diacare.24.4.733
  8. Ajileye AB, Akinbo FO. Oxidative DNA damage estimated by urinary 8-Hydroxy-2′ –Deoxyguanosine (8-OHdG) and 8-Oxoguanine DNA Glycosylase (OGG1) in cigarette and non-cigarette smokers in South West Nigeria. SAGE Publications; 2023. https://doi.org/10.3233/jcb-230120
  9. Watanabe S, Li YS, Kawasaki Y, Ootsuyama Y, Kawai K. Health examination results and work environment factors affecting urinary 8-hydroxy-2′-deoxyguanosine levels. Oxford University Press (OUP); 2021. https://doi.org/10.1002/1348-9585.12210
  10. Irie M, Tamae K, Iwamoto‐Tanaka N, Kasai H. Occupational and lifestyle factors and urinary 8‐hydroxydeoxyguanosine. Wiley; 2005. https://doi.org/10.1111/j.1349-7006.2005.00083.x
  11. AbuArrah M. 8-Hydroxy-2-Deoxyguanosine as Oxidative DNA Damage Biomarker of Medical Ionizing Radiation: A Scoping Review. Salvia Medical Sciences Ltd; 2021. https://doi.org/10.31661/jbpe.v0i0.2101-1258
  12. Ye M, Dewi L, Liao YC, Nicholls A, Huang CY, Kuo CH. DNA oxidation after exercise: a systematic review and meta-analysis. Frontiers Media SA; 2023. https://doi.org/10.3389/fphys.2023.1275867
  13. Kasai H, Iwamoto‐Tanaka N, Miyamoto T, Kawanami K, Kawanami S, Kido R, et al. Life Style and Urinary 8‐Hydroxydeoxyguanosine, a Marker of Oxidative DNA Damage: Effects of Exercise, Working Conditions, Meat Intake, Body Mass Index, and Smoking. Wiley; 2001. https://doi.org/10.1111/j.1349-7006.2001.tb01041.x
  14. Lee BM, Lee SK, Kim HS. Inhibition of oxidative DNA damage, 8-OHdG, and carbonyl contents in smokers treated with antioxidants (vitamin E, vitamin C, β-carotene and red ginseng). Elsevier BV; 1998. https://doi.org/10.1016/s0304-3835(98)00227-4
  15. Biglan KM, Dorsey ER, Evans RVV, Ross CA, Hersch S, et al. Plasma 8-hydroxy-2′-deoxyguanosine Levels in Huntington Disease and Healthy Controls Treated with Coenzyme Q10. SAGE Publications; 2012. https://doi.org/10.3233/jhd-2012-120007
  16. Rangel-Huerta OD, Aguilera CM, Martin MV, Soto MJ, Rico MC, Vallejo F, et al. Normal or High Polyphenol Concentration in Orange Juice Affects Antioxidant Activity, Blood Pressure, and Body Weight in Obese or Overweight Adults. Elsevier BV; 2015. https://doi.org/10.3945/jn.115.213660
  17. Ghorbanihaghjo A, Safa J, Alizadeh S, Argani H, Rashtchizadeh N, Taghinia MV, et al. Protective Effect of Fish Oil Supplementation on DNA Damage Induced by Cigarette Smoking. Springer Science and Business Media LLC; 2013. https://doi.org/10.3329/jhpn.v31i3.16826
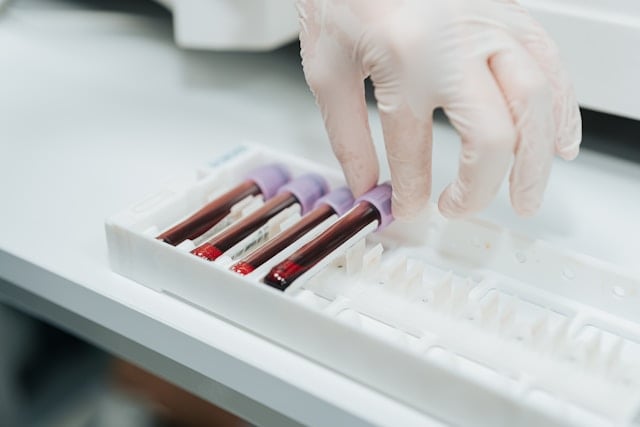
Medical professional in protective gloves handles labeled blood test vials in sterile laboratory.

Cystatin C Test: Normal Range, High Levels and Why It Matters

Roughly 37 million American adults have chronic kidney disease. The troubling part? Around 90% don’t know it.

Traditional kidney function tests miss early signs of decline. Standard creatinine testing can fail to detect problems until you’ve lost half your kidney function. A better marker exists that catches kidney disease years earlier: the cystatin C test.

What You Should Know

  • Cystatin C detects kidney problems earlier and more accurately than standard creatinine tests
  • Normal levels range from 0.6-1.2 mg/L, with elevated levels signaling reduced kidney function
  • Unlike creatinine, cystatin C isn’t affected by muscle mass, diet, age, or gender
  • Research shows cystatin C identifies 41% more people with chronic kidney disease than creatinine alone

What is Cystatin C?

Cystatin C is a small protein that your body produces at a constant rate. Every cell with a nucleus in your body makes it continuously.

The kidneys clear cystatin C from your bloodstream. If your kidney function worsens, cystatin C builds up in your blood. That’s why it’s the ideal marker for estimated glomerular filtration rate (eGFR), the gold standard for kidney health[1].

The beauty of cystatin C? The rate it’s produced in your body doesn’t change based on what you eat, how much muscle mass you have, or whether you’re 25 or 75. That stability makes it far more reliable than traditional markers of kidney function.

Normal Range and What High Levels Mean

A nurse handling blood test vials in a lab environment.

Normal Cystatin C Levels

Reference ranges shift slightly with age:

  • Adults 18-49 years: 0.63-1.03 mg/L
  • Adults 50+ years: 0.67-1.21 mg/L
  • General adult range: 0.6-1.2 mg/L

These ranges represent healthy kidney filtration. Staying within them suggests your kidneys are clearing waste efficiently.

What High Levels Indicate

Elevated cystatin C (above 1.2-1.3 mg/L) primarily signals impaired kidney function. But high levels can also point to:

  • Diabetes complications
  • Chronic inflammation
  • Cardiovascular disease risk
  • Thyroid problems (hyperthyroidism)
  • Obesity

One study found that 76% of patients with kidney dysfunction showed elevated cystatin C, compared to only 20% with elevated creatinine[2]. The test caught problems standard testing missed entirely.

Understanding inflammatory biomarkers alongside cystatin C gives you a fuller picture of your health status.

Comprehensive Health Assessment

Test cystatin C with 27 other longevity markers.

Jinfiniti AgingSOS green gradient background

Why Cystatin C Beats Creatinine for Kidney Testing

Creatinine comes from muscle breakdown. That creates significant problems for accuracy.

Your creatinine levels fluctuate based on muscle mass. Bodybuilders show falsely high readings. Elderly people with muscle loss show falsely normal readings even with declining kidney function.

Diet affects creatinine too. High protein intake artificially elevates levels. Certain medications interfere with the test. Gender and age require constant adjustments to reference ranges.

Most troubling? Creatinine may not rise until 50% of kidney function is lost. That’s a decade of missed opportunities for intervention.

Cystatin C’s Advantages for Kidney Health

One study looked at people who were very physically active. One group had significantly higher muscle mass than the other group. The serum cystatin C level was exactly the same in both groups[3].

Dr. Michael Shlipak at the San Francisco VA Health Care System states it plainly: “Cystatin C is clearly superior to creatinine because it overcomes the major weakness of creatinine’s inaccuracy in people with reduced muscle or limited activity.”

Cystatin C rises earlier when kidneys start failing. In young children who had cardiac surgery, plasma cystatin C peaked at 8 hours compared to creatinine peaking at 48 hours[4]. Earlier detection means earlier treatment.

The combined creatinine-cystatin C equation achieves 84-94% accuracy compared to gold-standard GFR measurements. Creatinine alone? 80-84% at best[5].

Learning about these different types of biomarkers can help you understand why some tests work better than others for specific health conditions.

Research-Backed Evidence

The New England Journal of Medicine featured a study with over 90,000 participants.

13.7% had chronic kidney disease by cystatin C testing versus only 9.7% by testingcreatinine alone[6]. That’s a 41% increase in disease detection.

When cystatin C reclassified people to lower kidney function categories, they faced significantly higher mortality risk. Hazard ratios jumped to 1.55-1.76 for death.
The Heart and Soul Study tracking 990 people with coronary heart disease found those in the highest cystatin C quartile experienced[7]:

  • 3.6-fold increased risk of death
  • 2.0-fold increased cardiovascular event risk
  • 2.6-fold increased heart failure risk

A meta-analysis of over 22,000 participants across 14 studies found even broader patterns[8]. Those with the highest cystatin C levels faced 162% increased cardiovascular disease risk and 122% increased all-cause mortality.

These risks existed independent of standard creatinine measures. Traditional testing was missing critical warning signs.

Dr. Jennifer Lees at the University of Glasgow reviewed the evidence comprehensively: “Cystatin C improves sensitivity and specificity of chronic kidney disease diagnosis, improves detection of harmful acute and chronic changes in kidney function, improves precision of treatment eligibility and safety.”[9]

The 2024 KDIGO guideline now recommend using both creatinine and cystatin C together for the most accurate kidney function assessment.

“At Jinfiniti, we’ve seen how measuring advanced biomarkers like cystatin C transforms patient care,” notes Dr. Jin-Xiong She. “Catching kidney decline early gives people years to modify risk factors before irreversible damage occurs. That’s the power of precision testing.”

Your kidneys affect everything from blood pressure to NAD+ levels and diabetes risk. Keeping tabs on kidney health protects your entire system.

🧬 MORE READING

  • Blood work can reveal protein deficiencies early. Understanding your albumin blood test results helps catch liver and kidney issues before symptoms appear.
  • Muscle soreness or something more serious? Learn what creatine kinase levels tell you about muscle damage and heart health.
  • Inflammation drives kidney damage. Discover which oxidative stress markers reveal hidden cellular damage.

Who Should Get a Cystatin C Test?

The test proves most valuable in specific situations:

  • Borderline kidney function: If your creatinine-based GFR sits at 45-59 mL/min/1.73m² without protein in your urine, cystatin C confirms whether you truly have kidney disease.
  • Unusual body composition: Malnutrition, obesity, amputation, high muscle mass from athletics, or muscle wasting conditions all throw off creatinine. Cystatin C stays accurate.
  • Medication decisions: When drugs you need are hard on kidneys or require precise dosing, cystatin C gives you the accurate GFR needed for safety.
  • Rapidly changing situations: Hospitalized patients, acute kidney injury, or conditions where kidney function fluctuates quickly benefit from cystatin C’s sensitivity.
  • Older adults: Muscle mass naturally declines with age. Creatinine becomes increasingly unreliable after 60, while cystatin C maintains accuracy.

A comprehensive longevity bioarker testing panel should include cystatin C alongside other markers to catch problems before symptoms appear.

Understanding Your Test Results

Your cystatin C level translates directly to estimated GFR. Higher cystatin C means lower GFR and reduced kidney function.

Results get combined with creatinine for the most accurate picture. When both tests agree, confidence in the diagnosis increases. When they disagree, cystatin C usually reveals the truth.

Some conditions raise cystatin C without affecting kidneys. Hyperthyroidism, corticosteroid use, and high inflammation can elevate levels. Your doctor accounts for these when interpreting results.

The test costs more than basic creatinine (around $17-18 versus under $2), but the improved accuracy prevents costly complications down the road. Finding kidney disease a decade earlier can save your life.

Regular testing matters most. One measurement establishes your baseline. Follow-up tests every 6-12 months track whether your kidney function stays stable, improves, or declines.

Research shows that approximately 11% of outpatients and 35% of hospitalized patients show large discordances between cystatin C and creatinine-based measurements[10].

When the two tests disagree significantly, the people whose cystatin C indicates worse function face elevated mortality risk that creatinine testing completely misses.

Dr. Shlipak raises a critical question: “The obvious mystery is why after 15 years we’re still not using it very much. I can’t explain why the medical field is content to continue using creatinine when we have a better alternative.”

Don’t wait for standard testing to miss the warning signs. Ask your doctor for a comprehensive assessment like our AgingSOS at-home panel that includes cystatin C.

Referenced Sources

  1. Benoit SW, Ciccia EA, Devarajan P. Cystatin C as a biomarker of chronic kidney disease: latest developments. Informa UK Limited; 2020. https://doi.org/10.1080/14737159.2020.1768849
  2. Villa P, Jiménez M, Soriano MC, Manzanares J, Casasnovas P. Serum cystatin C concentration as a marker of acute renal dysfunction in critically ill patients. Springer Science and Business Media LLC; 2005. https://doi.org/10.1186/cc3044
  3. Baxmann ACAA, Ahmed MS, Marques NAAC, Menon VB, Pereira AB, Kirsztajn GM, et al. Influence of Muscle Mass and Physical Activity on Serum and Urinary Creatinine and Serum Cystatin C. Ovid Technologies (Wolters Kluwer Health); 2008. https://doi.org/10.2215/cjn.02870707
  4. Makinde RA, Alaje AK, Ajose AO, Adedeji TA, Onakpoya UU. Cardiac Surgery-Associated Acute Kidney Injury (CSA-AKI) in Children with Congenital Heart Diseases in Southwest Nigeria. Ovid Technologies (Wolters Kluwer Health); 2025. https://doi.org/10.4103/aca.aca_104_24
  5. Russel WA, Fu EL, Bosi A, Caldinelli A, Inker LA, Chang AR, et al. Obesity, Underweight, and Accuracy of eGFR Using Cystatin C and Creatinine in a Northern European Population. Ovid Technologies (Wolters Kluwer Health); 2025. https://doi.org/10.1681/asn.0000000760
  6. Shlipak MG, Matsushita K, Ärnlöv J, Inker LA, Katz R, Polkinghorne KR, et al. Cystatin C versus Creatinine in Determining Risk Based on Kidney Function. Massachusetts Medical Society; 2013. https://doi.org/10.1056/nejmoa1214234
  7. Ix JH, Shlipak MG, Chertow GM, Whooley MA. Association of Cystatin C With Mortality, Cardiovascular Events, and Incident Heart Failure Among Persons With Coronary Heart Disease. Ovid Technologies (Wolters Kluwer Health); 2007. https://doi.org/10.1161/circulationaha.106.644286
  8. Lee M, Saver JL, Huang WH, Chow J, Chang KH, Ovbiagele B. Impact of Elevated Cystatin C Level on Cardiovascular Disease Risk in Predominantly High Cardiovascular Risk Populations. Ovid Technologies (Wolters Kluwer Health); 2010. https://doi.org/10.1161/circoutcomes.110.957696
  9. Lees JS, Fabian J, Shlipak MG. Cystatin C should be routinely available for estimating kidney function. Ovid Technologies (Wolters Kluwer Health); 2024. https://doi.org/10.1097/mnh.0000000000000980
  10. Estrella MM, Ballew SH, Sang Y, Grams ME, Coresh J, Surapaneni A, et al. Discordance in Creatinine- and Cystatin C–Based eGFR and Clinical Outcomes. American Medical Association (AMA); 2025. https://doi.org/10.1001/jama.2025.17578
Three blood test vials against a purple background.

What is an Albumin Blood Test? Understanding Normal Ranges and Results

Your doctor has ordered an albumin test but what does it really tell you about your health? Albumin is a biomarker for the functioning of your liver, kidney, and overall nutrition. In many ways, it’s like a triple action report card.

The reason an albumin test is so valuable is that it can identify a problem that is developing before you experience symptoms. A faulty liver, under-performing kidney, chronic inflammation and poor nutrition can all impact albumin levels and most often become visible through a blood test months or years before you become aware of a problem.

That’s why comprehensive testing panels like AgingSOS include albumin alongside 27 other biomarkers to paint a complete picture of your cellular vitality and biological age.

What You Should Know

  • Normal albumin ranges from 3.5 to 5.4 g/dL in healthy adults
  • Low levels typically signal liver disease, kidney problems, or malnutrition
  • High albumin almost always means dehydration, not overproduction
  • Testing requires a simple blood draw with results available in days

What is Albumin?

Albumin is the most abundant protein in your blood. In healthy individuals, albumin makes up about 50% of the total protein content of plasma. Your liver makes about 10 to 15 grams of albumin every day.

Albumin acts as a carrier protein, transporting many different substances throughout your body, including hormones, vitamins, minerals, and medications.

Albumin also prevents fluid from leaking out of blood vessels. It is responsible for 70 to 80% of what is called “oncotic pressure”, the force that opposes the leaking of fluid out of blood vessels and into other parts of the body. If albumin levels are too low, fluid leaks out and causes edema (swelling).

In addition to its transport and fluid regulating roles, albumin plays a role in modulating inflammation and oxidative stress. Albumin neutralizes free radicals and helps to regulate antioxidant levels in cells.

Normal Albumin Blood Test Ranges

Healthy adults maintain albumin levels between 3.5 and 5.4 grams per deciliter (g/dL). Your age and life stage affect what’s considered normal for you.

Normal albumin levels by age:

  • Newborns: 2.8 to 4.4 g/dL (immature liver function)
  • Children and teens: 3.8 to 5.4 g/dL (higher during growth)
  • Adults: 3.5 to 5.4 g/dL (standard range)
  • Adults over 65: 3.4 to 4.8 g/dL (normal aging decline)
  • Pregnant women: 3.0 to 4.2 g/dL (blood volume increases)

How Ranges Vary by Age

The liver’s ability to produce albumin also varies by age. In one study, the synthesis rate decreased 60 to 80% in people with end-stage liver disease as compared to normal function[1].

In healthy people, there is a normal decrease with age in the liver’s ability to metabolize protein. Adults with test results showing levels above 3.4 g/dL after 65 generally show good liver function and adequate nutrition.

Testing during pregnancy tends to show physiological changes rather than disease. Your body increases blood volume by up to 50%, which naturally dilutes the concentration of albumin.

Infographic showing normal ranges for an albumin blood test.

What Low Albumin Levels Tell Your Doctor

Low albumin (also known as hypoalbuminemia) is defined as less than 3.4-3.5 g/dL. This laboratory finding is one of the strongest indicators of a severe underlying medical condition.

Albumin levels only decrease when the liver is unable to synthesize enough, the kidneys excrete too much or the body’s processes are breaking it down too quickly. Levels that dip below 3.0 g/dL are indicative of late-stage disease and need urgent medical intervention.

Main Causes of Low Albumin

Common causes include:

  • Liver disease: Cirrhosis, hepatitis, and liver failure impair synthesis since your liver is albumin’s only production site. Low albumin signals advanced disease in prognostic scoring systems like Child-Pugh and MELD.
  • Kidney disorders: Nephrotic syndrome causes massive albumin loss into urine. Patients lose more than 3 grams of protein daily, with serum albumin often dropping below 2.5 g/dL.
  • Malnutrition: Inadequate protein intake prevents albumin production. A systematic review found subjects at high malnutrition risk had significantly lower albumin concentrations[2].
  • Inflammation and infection: Cytokines like IL-1, IL-6, and TNF-α suppress liver albumin production while blood vessels become leaky, allowing albumin to escape. Understanding inflammatory biomarkers helps identify these conditions early.

Signs Your Levels Might Be Low

Swelling is the classic symptom associated with low albumin. Look for these signs:

  • Edema: Fluid retention in legs, feet, ankles, or face
  • Ascites: Fluid buildup in your abdomen causing swollen belly
  • Breathing difficulty: Pleural effusions in which fluid surrounds the lungs
  • Fatigue and weakness: Poor nutrient transport throughout body (similar to chronic fatigue from other causes)
  • Loss of appetite and nausea: Often seen with protein deficiency
  • Dry, rough skin and thinning hair: Not enough protein to support tissue maintenance

Comprehensive Health Assessment

Test albumin with 27 other longevity markers.

Jinfiniti AgingSOS green gradient background

What High Albumin Levels Really Mean

High albumin or hyperalbuminemia refers to albumin levels above 5.0 to 5.4 g/dL. This result is rare and is almost never due to overproduction. Dehydration concentrates the blood and makes the albumin appear high, while the total protein is normal.

Why Levels Rise

High albumin is most often due to:

  • Dehydration: Fluid loss through vomiting, diarrhea, excessive sweating, or inadequate intake concentrates blood components. This causes virtually all cases of hyperalbuminemia.
  • Very high protein diets: Consuming too much protein will temporarily raise the level of albumin as a result of normal liver metabolism.
  • Certain medications: Insulin, growth hormone, and anabolic steroids can cause a temporary increase in the production of albumin.
  • Technical factors: Using a tourniquet for too long while drawing a blood sample for testing can concentrate the albumin in your blood.

Symptoms to Look For

High albumin is rarely the direct cause of symptoms. When you feel unwell, you are suffering the effects of dehydration:

  • Intense thirst and a parched mouth
  • Dark, strong-smelling urine that is less frequent
  • Feeling lightheaded or dizzy when you stand up
  • Feeling very tired and weak
  • An increased heart rate
  • Dry, less elastic skin
  • Headaches and confusion from the loss of fluids

Rehydration typically resolves high albumin quickly. Drink water gradually and monitor symptoms.

How Albumin Testing Works

Doctors perform the albumin blood test by drawing blood from your arm. You usually don’t need to fast before the test unless you are having it as part of a comprehensive metabolic panel.

A healthcare professional inserts a needle into a vein in your arm. It only takes a few minutes and causes only minimal discomfort.

Laboratories have several methods for measuring the amount of albumin in your blood. The most common are bromocresol green (BCG) and bromocresol purple (BCP). Labs usually return the results within a few days.

“The albumin test is a classic example of how precision medicine works,” says Dr. Jin-Xiong She, founder of Jinfiniti Precision Medicine. “One single biomarker can reflect the status of multiple organ systems in your body. But interpreting the results requires an understanding of the unique context of each patient.”

🧬 MORE READING

  • Building strength after 40 requires different approaches. These anti-aging exercises for longevity support healthy muscle mass without excessive strain.
  • Scientists call Klotho the “longevity protein” because it protects against DNA damage. Discover how this remarkable protein influences healthspan.
  • Inflammation drives albumin down. Discover which supplements reduce cortisol levels and inflammatory stress naturally.

What Your Results Mean for Your Health

Albumin testing is used in diagnosis, screening, and monitoring. Your doctor will order these tests if you have symptoms of liver or kidney disease.

As per Cleveland Clinic, low albumin levels are associated with liver damage, kidney disease, inflammation, shock, and malnutrition. In most cases, a higher level will indicate dehydration.

Repeated tests are used to monitor the severity of an underlying disease and how well you are responding to treatment. In a study of mortality risk, a higher red blood cell distribution width to albumin ratio was linked to a higher risk of death[3].

In most cases, low albumin is not treated with albumin infusions unless certain complications are present. It is managed by addressing the underlying cause, such as malnutrition, liver disease, or inflammation.

Optimal albumin levels indicate healthy liver function, nutrition, and lack of inflammation. It’s one of the many longevity biomarkers you’ll want to track as you age.

Referenced Sources

  1. Amouzandeh M, Sundström A, Wahlin S, Wernerman J, Rooyackers O, Norberg Å. Albumin and fibrinogen synthesis rates in advanced chronic liver disease. American Physiological Society; 2023. https://doi.org/10.1152/ajpgi.00072.2023
  2. Zhang Z, Pereira S, Luo M, Matheson E. Evaluation of Blood Biomarkers Associated with Risk of Malnutrition in Older Adults: A Systematic Review and Meta-Analysis. MDPI AG; 2017. https://doi.org/10.3390/nu9080829
  3. Hao M, Jiang S, Tang J, Li X, Wang S, Li Y, et al. Ratio of Red Blood Cell Distribution Width to Albumin Level and Risk of Mortality. American Medical Association (AMA); 2024. https://doi.org/10.1001/jamanetworkopen.2024.13213
Female runner in black and yellow athletic wear sits on path holding injured leg.

Creatine Kinase Test Levels: Normal, High, and What It Means

Your doctor may have ordered a creatine kinase (CK) test for you, and you’re wondering what this enzyme says about your health. CK can indicate all sorts of things, from a recent workout to severe muscle damage, so it can be hard to know what’s normal without any context.

This guide explains what creatine kinase testing is and what it measures, what levels of CK are normal, and when elevated CK levels are a concern and when they are not.

Highlights

  • Normal CK ranges vary widely by gender, race, age, and physical activity level, making one-size-fits-all reference ranges unreliable
  • Exercise can triple your CK levels for up to a week, so timing matters when testing
  • Levels above 5,000-10,000 U/L may signal rhabdomyolysis, a medical emergency requiring immediate treatment
  • African Americans naturally have CK levels approximately 70% higher than other groups without any health concerns

What is Creatine Kinase?

Creatine kinase is an enzyme found mainly in your heart, brain, and skeletal muscles. It helps produce cellular energy by converting creatine and ATP to phosphocreatine, which serves as a reserve for tissues with high energy needs.

When muscle or other CK-rich tissues get damaged, the enzyme leaks into your bloodstream. It’s this release that makes it a valuable diagnostic marker.

How CK Works in Your Body

You can think of creatine kinase as a battery charger in your cells. It helps regenerate ATP to keep your muscles and brain energized during exertion[1].

There are three types: 

  • CK-MM (skeletal muscle) 
  • CK-MB (heart muscle) 
  • CK-BB (brain muscle) 

The ratio of each type in the blood can help determine which tissue is damaged.

Why Doctors Test CK Levels

If you have muscle weakness, unexplained pain, or signs of a heart attack, your doctor may order a CK blood test. It’s also used to monitor people who take statins and develop muscle problems[2].

CK testing is used to diagnose muscular dystrophy, inflammatory muscle diseases and other neuromuscular disorders. It involves taking a simple blood sample. 

Comprehensive Health Assessment

Track CK with 27 other longevity markers.

Jinfiniti AgingSOS green gradient background

Normal Creatine Kinase Ranges

The range of “normal” for CK levels can vary considerably, which is why reference ranges are not as helpful as one might think.

CK Reference Ranges for Adults

Most labs report a normal range of 22-198 U/L for adults. But that broad range doesn’t account for individual differences.

Your baseline could sit comfortably at 50 U/L or 250 U/L depending on your muscle mass, activity level, and genetics. Context matters more than the number alone.

How Gender Affects Your Numbers

Men typically show higher CK levels than women due to greater muscle mass. Research shows mean levels of 127.3 U/L in males versus 85.5 U/L in females.

Gender-specific ranges include:

  • Males: 39-308 U/L
  • Females: 26-192 U/L

Women’s CK levels drop sharply around the time of first menstruation and remain lower throughout adulthood.

Population Differences

African Americans consistently show substantially higher baseline CK levels than other racial groups. Black men have median levels of 135-146 U/L compared to 51-64 U/L in white men.

Studies indicate serum CK levels are approximately 70% higher in healthy Black individuals. For asymptomatic African American men, CK levels up to 1,200 U/L can fall within normal range[3].

“The most notable factor that contributed to higher CK levels was Black race,” according to research published in Medicine. Differences in levels are due to the differential production or clearance of CK and not due to differences in muscle mass.

Age-Related Changes

CK levels shift throughout your lifespan. Newborns can have levels up to 500 U/L due to birth trauma, while children aged 1-15 typically show 60-305 U/L.

In adults, CK tends to decrease with age as muscle mass declines. Boys see sharp increases at puberty, reaching 14.48 µkat/L by age 18, while girls plateau around 5.74 µkat/L[4].

Athletes Have Higher Baselines

Regular training naturally elevates your baseline CK. Athletes can have normal ranges up to 300-400 U/L, substantially higher than sedentary individuals.

Peak CK level is reached 24-72 hours after exercise and can take up to a week to return to baseline, especially after eccentric exercise such as downhill running. Exercise can increase CK up to three times the normal level[5].

Infographic showing normal creatine kinase (CK) levels.

What Causes Elevated Creatine Kinase?

Dozens of factors can raise your CK levels. Some are harmless and temporary, while others signal serious medical conditions.

Exercise and Physical Activity

Physical activity remains the most common cause of CK elevation. Your workout intensity, type of exercise, and recovery time all influence how high levels climb.

Eccentric exercises cause the biggest spikes. If you lifted weights, ran hills, or tried a new activity, expect CK to rise without any medical concern.

Muscle Injury and Damage

Direct trauma to muscles releases CK into circulation. Falls, accidents, prolonged immobility, or even vigorous massage can temporarily elevate levels.

Intramuscular injections and recent vaccinations also cause mild, transient increases. These resolve on their own within days to weeks.

Medical Conditions That Raise CK

Numerous health issues affect CK levels:

  • Hypothyroidism (60-90% of patients show elevation)[6]
  • Muscular dystrophy (10-100 times normal)
  • Inflammatory muscle diseases
  • Certain infections
  • Some medications, particularly statins

Your doctor will consider symptoms, medical history, and other test results to determine the cause.

🧬 MORE READING

  • Building strength after 40 requires different approaches. These anti-aging exercises for longevity support healthy muscle mass without excessive strain.
  • Scientists call Klotho the “longevity protein” because it protects against DNA damage. Discover how this remarkable protein influences healthspan.
  • Energy production depends on more than exercise. Mitochondrial health supplements provide cellular support when CK levels suggest muscle stress.
  • Recovery matters as much as training. Learn which natural remedies for muscle pain can help without masking serious problems.

When High CK Levels Signal Danger

While many CK elevations are benign, some require immediate medical attention. Understanding when to worry can be lifesaving.

Rhabdomyolysis: A Medical Emergency

Rhabdomyolysis involves rapid muscle breakdown, with CK levels reaching 50,000-200,000 U/L or higher. This condition is diagnosed when CK reaches at least five times normal, though levels above 5,000 U/L raise serious concern[7].

The released muscle content, including myoglobin, can cause acute kidney injury. Symptoms include severe muscle pain, weakness, and dark urine, though many patients don’t show all three.

Causes range from extreme exertion and heat exposure to certain medications, alcohol abuse, and infections. Treatment requires aggressive IV hydration and close kidney function monitoring.

Statin-Related Muscle Problems

Statins can cause muscle effects ranging from mild aches to severe breakdown. The incidence of myopathy with statin monotherapy is 0.1-0.5%, while rhabdomyolysis occurs in less than 0.2% of cases[2].

Here’s something surprising: research published in Annals of Internal Medicine showed “some patients who develop muscle symptoms while receiving statin therapy have demonstrable weakness and histopathologic findings of myopathy despite normal serum creatine kinase levels.”

Normal CK doesn’t rule out statin-induced muscle injury. Muscle biopsies revealed mitochondrial dysfunction even when CK remained normal.

Hypothyroidism and CK Elevation

Underactive thyroid is a commonly missed cause of elevated CK. Approximately 60-90% of hypothyroid patients show elevated CK activity, with levels averaging five-fold greater than normal.

Severe cases can present remarkably high numbers. Case reports document CK of 9,000 U/L completely normalizing after three months of thyroid hormone replacement[8].

“Adequate therapy leads to complete recovery, including myopathy,” according to research from the Ludwig Boltzmann Institute. If your CK is elevated without clear cause, ask your doctor about checking thyroid function.

When Should You Get a CK Test?

Knowing when CK testing makes sense helps you advocate for appropriate care.

Dr. Jin-Xiong She explains: “Creatine kinase testing serves as an important window into muscle health and metabolic function. When interpreted correctly alongside other biomarkers, it helps us understand not just muscle damage, but overall cellular energy status.”

Common Symptoms to Watch For

Several signs warrant CK testing:

  • Unexplained muscle weakness or pain
  • Severe muscle tenderness
  • Dark-colored urine (tea or cola-colored)
  • Extreme fatigue with muscle soreness
  • Difficulty climbing stairs or lifting objects

If you’re taking statins and develop any muscle complaints, request testing even if symptoms seem mild. Early detection prevents progression to more serious problems.

Who Needs Regular Monitoring

Certain people benefit from routine CK checks:

  • Anyone taking statins or fibrates
  • Athletes in intense training programs
  • People with known muscle diseases
  • Those with a family history of muscular dystrophy
  • Individuals with chronic fatigue and muscle symptoms

Regular monitoring can establish your personal baseline, making it easier to spot meaningful changes.

Understanding Your Serum CK Test Results

Raw numbers tell only part of the story. Proper interpretation requires considering multiple factors together.

What Do the Numbers Mean?

CK levels fall into broad categories:

  • Normal to mildly elevated (up to 500 U/L): Often related to recent exercise, minor trauma, or neuropathies. Repeat testing after a week of rest usually clarifies the picture.
  • Moderate elevation (500-5,000 U/L): May indicate inflammatory muscle diseases, thyroid problems, or medication effects. Requires investigation but isn’t typically an emergency.
  • Severe elevation (5,000-10,000+ U/L): Suggests rhabdomyolysis or severe muscle disease. Needs immediate medical evaluation to prevent kidney damage.

Remember that African Americans may have levels up to 1,200 U/L while remaining completely healthy.

When to See a Doctor

Seek immediate care if you have:

  • CK above 10,000 U/L with any symptoms
  • Dark urine with muscle pain
  • Severe muscle weakness affecting daily activities
  • Muscle symptoms after starting new medications

For persistently elevated levels above 1,000 U/L, schedule a non-urgent appointment. Your doctor can order additional tests to identify the underlying cause and determine if treatment is needed.

Testing CK alongside other longevity biomarkers provides a more complete picture of your health status. Our AgingSOS Advanced Panel measures CK along with 27 other markers related to inflammation, oxidative stress, and cellular senescence.

Referenced Sources

  1. Weiss RG, Gerstenblith G, Bottomley PA. ATP flux through creatine kinase in the normal, stressed, and failing human heart. Proceedings of the National Academy of Sciences; 2005. https://doi.org/10.1073/pnas.0408962102
  2. Vinci P, Panizon E, Tosoni LM, Cerrato C, Pellicori F, Mearelli F, et al. Statin-Associated Myopathy: Emphasis on Mechanisms and Targeted Therapy. MDPI AG; 2021. https://doi.org/10.3390/ijms222111687
  3. Brewster LM, Coronel CMD, Sluiter W, Clark JF, van Montfrans GA. Ethnic Differences in Tissue Creatine Kinase Activity: An Observational Study. Public Library of Science (PLoS); 2012. https://doi.org/10.1371/journal.pone.0032471
  4. Lane RJM, Roses AD. Variation of serum creatine kinase levels with age in normal females: implications for genetic counselling in Duchenne muscular dystrophy. Elsevier BV; 1981. https://doi.org/10.1016/0009-8981(81)90442-3
  5. Totsuka M, Nakaji S, Suzuki K, Sugawara K, Sato K. Break point of serum creatine kinase release after endurance exercise. American Physiological Society; 2002. https://doi.org/10.1152/japplphysiol.01270.2001
  6. Prakash A, Lal A, Negi K. Serum Creatine Kinase Activity in Thyroid Disorders. 2007.
  7. Torres P, Helmstetter JA, Kaye A, Kaye A. Rhabdomyolysis: pathogenesis, diagnosis, and treatment. Ochsner Journal 2015;15 1:58–69.
  8. Finsterer J, Stöllberger C, Grossegger C, Kroiss A. Hypothyroid Myopathy with Unusually High Serum Creatine Kinase Values. S. Karger AG; 1999. https://doi.org/10.1159/000023462
An image of matured couple eating healthy foods

Healthiest Diet for a Long Life: 8 Simple Choices for Longevity

What if the secret to a longer, healthier life wasn’t hidden in some exotic superfood or complicated fasting protocol? Recent groundbreaking research reveals that the path to longevity lies in surprisingly simple dietary choices that anyone can follow.

A landmark 30-year Harvard study tracking over 105,000 adults discovered something remarkable. Those who followed specific eating patterns had an 86% greater likelihood of reaching age 70 in good health and were 2.24 times more likely to maintain their vitality at age 75.

The winning approach? The Alternative Healthy Eating Index (AHEI), which outperformed even the famous Mediterranean diet in promoting healthy aging.

Key Takeaways

  • The Alternative Healthy Eating Index (AHEI) beats the Mediterranean diet for healthy aging
  • Plant-forward eating with minimal processing delivers the strongest longevity benefits
  • Blue Zones have been debunked due to poor record-keeping and age fraud
  • Simple, gradual changes work better than extreme dietary restrictions

The Science Behind Dietary Patterns for Longevity

Image of healthy meal prepped

The research foundation for healthy aging through diet has never been stronger. Unlike trendy approaches that come and go, these findings represent one of the most thorough investigations into diet and longevity to date.

Interestingly, the popular Blue Zones concept has been largely debunked by recent research. Dr. Saul Newman of Oxford University, who won an Ig Nobel Prize for his work, found that many Blue Zones regions suffered from poor record-keeping and pension fraud1.

As Newman noted, “42% of the centenarians in Costa Rica turned out to be lying about their age after the study was conducted.”

This makes the Harvard research even more valuable. It relied on rigorous data collection and verified health outcomes over three decades.

8 Evidence-Based Choices for a Healthy Diet to Live Longer

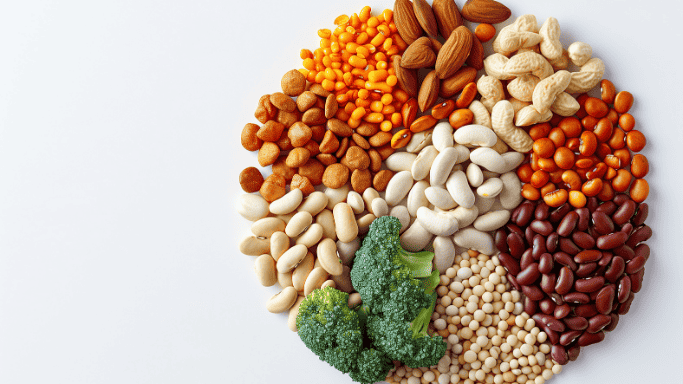
Image of healthy plant-based protein rich foods

The following dietary choices emerge from decades of research into what actually works for extending healthy lifespan. Each recommendation is backed by large-scale studies and real-world evidence.

1. Choose Plant Proteins Over Animal Sources

Plant-based proteins from legumes, nuts, seeds, and whole grains should anchor your meals. Research shows women who consume more plant protein in midlife were 46% more likely to age healthily, while those eating more animal protein were 6% less likely to maintain good health2.

A global study found that countries with higher plant-based protein consumption had longer adult life expectancy rates, with findings associated with lower rates of chronic disease across populations3.

Simple action: Replace one serving of animal protein daily with plant options like lentils, chickpeas, tofu, or quinoa.

2. Embrace Healthy Fats for Brain Health

Omega-3 fatty acids play an important role in healthy aging by reducing inflammation and supporting brain function. Research indicates an optimal intake threshold of approximately 1.1 grams per day, beyond which additional benefits plateau4.

These healthy fats improve mitochondrial function, which ties directly to cellular health supplements that support your body’s energy production systems.

Top sources include:

  • Fatty fish twice weekly
  • Ground flaxseeds or chia seeds
  • Walnuts as regular snacks
  • Extra virgin olive oil

3. Boost Fiber Intake for Gut Health and Longevity

Dietary fiber promotes healthy aging by supporting beneficial gut bacteria that produce protective short-chain fatty acids. Long-term high fiber intake from infancy is associated with improved gut microbiome composition in young adults5.

Most adults should target 25-35 grams of fiber daily from diverse plant sources. This whole-grain and vegetable-rich approach naturally supports the healthy eating patterns that research links to extended lifespan. Focus on getting fiber from each major food group to increase diversity.

Fiber-rich choices:

  • Vegetables and fruits with every meal
  • Whole grains instead of refined options
  • Daily servings of legumes
  • Mixed nuts and seeds

4. Avoid Ultra-Processed Foods

Ultra-processed foods accelerate biological aging beyond what poor nutrition alone would predict. Adults with higher ultra-processed food consumption showed 0.86 years of accelerated biological aging compared to those with lower intake6.

These foods promote inflammation and oxidative stress, contributing to the oxidative stress that damages cells and accelerates aging. Studies consistently show patterns associated with lower life expectancy in populations consuming more ultra-processed options.

Red flags to watch for:

  • More than 5 ingredients on labels
  • Unfamiliar chemical additives
  • Foods that don’t resemble their original form
  • Items with long shelf lives due to preservatives

5. Balance Protein Intake Based on Your Age

Protein needs change as we age, and getting this balance right affects how well we maintain muscle mass and overall health. For adults under 65, moderate protein intake (10-19% of calories) supports longevity goals.

Yet older adults benefit from higher protein intake (1.2-2.0g/kg body weight) to prevent muscle loss and frailty. This aligns with research on longevity supplements that support healthy aging at different life stages. Maintaining adequate protein intake also helps regulate body mass index as we age.

Age GroupProtein TargetFocus
Under 6510-19% of caloriesPlant-based sources
Over 651.2-2.0g/kg body weight25-30g per meal

6. Include Anti-Inflammatory Polyphenols Daily

Polyphenols are powerful antioxidants that combat cellular aging by reducing oxidative stress and preventing cellular senescence. These compounds are abundant in colorful fruits, vegetables, herbs, and spices.

Turmeric deserves special mention here. This golden spice contains curcumin, one of the most potent anti-inflammatory compounds found in nature. For maximum benefit, our Extra Strength Turmeric+ combines curcumin with black pepper extract, Boswellia, ginger and quercetin to increase absorption by up to 2000%.

Daily polyphenol sources:

  • Mixed berries
  • Dark leafy greens
  • Green tea
  • Extra virgin olive oil
  • Herbs like turmeric and oregano

7. Practice Moderate Caloric Awareness

Recent research confirms that genetic resilience matters more than extreme caloric restriction for longevity. The mice that lived longest on restricted diets were those that maintained their weight and immune function despite eating less7.

This suggests moderate caloric awareness (10-20% reduction) may be more beneficial than severe restriction for most people. This approach helps maintain healthy body mass index ranges without the metabolic stress of extreme dieting.

Focus on nutrient density rather than extreme calorie cutting. Listen to your body’s hunger and satiety signals while choosing foods that deliver maximum nutrition per calorie.

8. Consider Timing Your Eating Windows

While extreme time-restricted eating (under 8 hours) may increase cardiovascular disease risk, moderate approaches can provide metabolic benefits when combined with a healthy diet.

Research suggests 10-12 hour eating windows offer the best balance of benefits without negative health impacts. The key lies in consistency and ensuring adequate nutrition within your chosen timeframe.

If you try time-restricted eating:

  • Maintain 10-12 hour eating windows
  • Prioritize food quality over timing restrictions
  • Focus on getting all important nutrients
  • Monitor how you feel and adjust accordingly

The Mediterranean Diet Connection

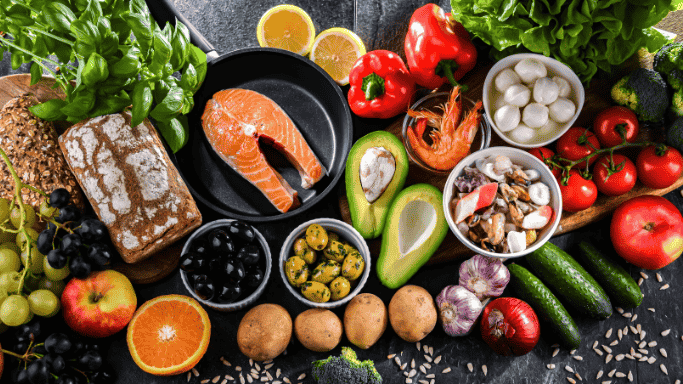
Image of Mediterranean diet

Both the AHEI and Mediterranean approaches share similar foundations for promoting longevity. The Mediterranean diet remains one of the most studied dietary patterns for longevity, though the AHEI approach edges it out in recent research.

Both dietary patterns emphasize whole foods, healthy fats, and moderate portions while limiting processed foods and excessive red meat consumption. The Mediterranean approach offers a time-tested method that many find easier to follow long-term.

These dietary patterns work together with lifestyle factors that support healthy aging, including stress management and maintaining NAD levels by age for optimal cellular function.

Public Health Impact of Longevity Nutrition

Hands protecting a red heart with a paper-cutout silhouette of a family, symbolizing healthcare, family protection, or insurance.

The implications for public health are notable. If more people adopted these evidence-based dietary patterns, we could see important reductions in chronic disease rates and healthcare costs.

Research consistently shows that populations following these principles have a lower risk of heart disease, type 2 diabetes, and all-cause mortality. This creates a powerful case for promoting these dietary approaches at the community level.

The focus on whole foods and plant-forward eating also supports environmental health, creating benefits that extend beyond individual longevity.

Putting This Into Practice

An image of a woman holding a glass of fruit smoothie

Making lasting changes doesn’t require dramatic overhauls. Start with one change per week rather than overhauling your entire diet overnight. The research shows that dietary patterns matter more than individual nutrients, so aim for gradual, sustainable improvements.

Week-by-week approach:

  • Week 1: Add one plant protein meal daily
  • Week 2: Include healthy fats with each meal
  • Week 3: Boost fiber with whole grains and vegetables
  • Week 4: Eliminate one ultra-processed food

This gradual approach helps create lasting habits that support long-term health goals.

Beyond Diet: The Complete Longevity Picture

APRIL JF Blogs1 34

While diet forms the foundation of healthy aging, it works best as part of a complete approach. Regular physical activity, stress management, quality sleep, and maintaining social connections all contribute to longevity.

Supporting your body’s natural aging processes with anti-aging vitamins and minerals can complement these dietary choices for optimal results.

The evidence is clear: a plant-forward, minimally processed dietary pattern rich in fiber, healthy fats, and polyphenols provides the strongest foundation for healthy aging. These choices, backed by decades of rigorous research, offer a practical pathway to not just living longer, but living better.

By focusing on these eight simple choices, you’re not just adding years to your life – you’re adding life to your years. The research shows that it’s never too early or too late to start making these changes that can transform how you age.

Referenced Sources:

  1. https://www.aljazeera.com/news/2024/9/26/the-secret-of-blue-zones-where-people-reach-100-fake-data-says-academic ↩︎
  2. https://hsph.harvard.edu/news/plant-protein-women-healthy-aging/ ↩︎
  3. https://www.sciencedaily.com/releases/2025/04/250415144002.htm ↩︎
  4. https://www.asbmb.org/asbmb-today/science/080125/omega-3-fats-linked-healthy-aging-metabolism ↩︎
  5. https://www.medicalnewstoday.com/articles/short-term-increase-in-fiber-alters-gut-microbiome ↩︎
  6. https://www.medicalnewstoday.com/articles/ultra-processed-foods-may-accelerate-biological-aging-2 ↩︎
  7. https://www.jax.org/news-and-insights/2024/october/study-probes-how-eating-less-can-extend-lifespan ↩︎
A stylized pink anatomical heart with geometric facets sits on a soft pink background surface.

Is Niacin Good for Your Heart? New Studies Show Hidden Risks

For decades, doctors recommended niacin supplements to patients struggling with high cholesterol. This B vitamin seemed like a perfect solution for heart health.

Recent research tells a different story. Scientists now know that excess niacin may increase cardiovascular disease risk. It works through hidden inflammatory pathways.

Key Takeaways

  • 1 in 4 Americans has excess niacin levels that double their heart disease risk
  • Excess niacin creates toxic metabolites that trigger dangerous blood vessel inflammation
  • Food fortification and supplements often cause niacin overload without people realizing it
  • High-dose niacin therapy failed in trials because inflammatory effects canceled cholesterol benefits

The Surprising Discovery About Niacin and Heart Disease

A woman holding her chest with pale lips, appearing to be in discomfort, possibly indicating symptoms of heart disease.

A 2024 study published in Nature Medicine revealed shocking news about vitamin B3. About one in four Americans has excess niacin levels that double their risk of heart attack and stroke.1

This puts their risk of heart disease at levels similar to people with diabetes.

The problem isn’t niacin itself. The issue lies in what happens when your body processes too much of this vitamin.

When Good Vitamins Go Bad

Your body only needs small amounts of niacin to function properly. When you consume more than needed, your system breaks down the excess into compounds called 4PY and 2PY.

These metabolites are where the real danger begins.

People with the highest levels of these breakdown products had a 1.6 to 2 times higher risk of major cardiac events over three years. That’s compared to those with the lowest levels.

How Excess Niacin Triggers Cardiovascular Problems

A young woman in a white t-shirt checks her fitness tracker while sitting outdoors in nature.

The primary way that too much niacin harms your heart involves something called 4PY-mediated vascular inflammation.

Here’s what happens in your blood vessels when 4PY levels get too high:

  • 4PY triggers production of VCAM-1 on blood vessel walls
  • VCAM-1 helps white blood cells stick to your arteries
  • These immune cells then infiltrate arterial tissue
  • This process contributes to plaque formation
  • Chronic vascular inflammation damages blood vessels over time

Research shows that 4PY directly causes inflammatory cells to stick to blood vessel walls in laboratory studies.2

Your Genes Matter Too

Some people face a higher risk based on their genetics. Scientists found variants in the ACMSD gene that affect how your body processes niacin.

More than half the population carries these genetic variants. If you have them, you produce more of the harmful 4PY metabolites when consuming excess niacin.

The Cleveland Clinic Study Results

An image showing bar chart with pen, eyeglasses, and calculator on a desk, shown in blue tone.

Cleveland Clinic researchers led this important discovery about niacin and inflammation. Dr. Stanley Hazen and his team analyzed blood samples from over 3,000 people.3

They tracked participants for three years to see who developed heart problems.

The results were clear. People with the highest 4PY levels had double the risk of heart attack, stroke, or death compared to those with the lowest levels.

The Numbers Don’t Lie

The study found that 25% of Americans have excess niacin levels. These individuals face significantly higher cardiovascular disease risk without knowing it.

This research helps explain why niacin therapy often failed in clinical trials, despite improving cholesterol numbers.

Why High Cholesterol Treatments With Niacin Failed

A person fills out a health examination form with a pen, showing cholesterol test results and data.

For years, doctors prescribed high-dose niacin to lower LDL cholesterol and raise HDL levels. The results looked promising on paper.

But major clinical trials told a different story4:

  • The AIM-HIGH trial showed no cardiovascular benefit4
  • The HPS2-THRIVE study found niacin increased stroke risk by 78%4
  • Patients experienced more diabetes, infections, and stomach problems
  • Despite better cholesterol profiles, people didn’t live longer

These studies puzzled researchers for years. Now we understand why.

The Hidden Inflammation Problem

While niacin was lowering cholesterol, it was simultaneously creating inflammatory metabolites. The 4PY compounds were triggering vascular inflammation that counteracted any cholesterol benefits.

This explains the “niacin paradox” that confused doctors for decades.

Hidden Sources of Vitamin B3 Overload

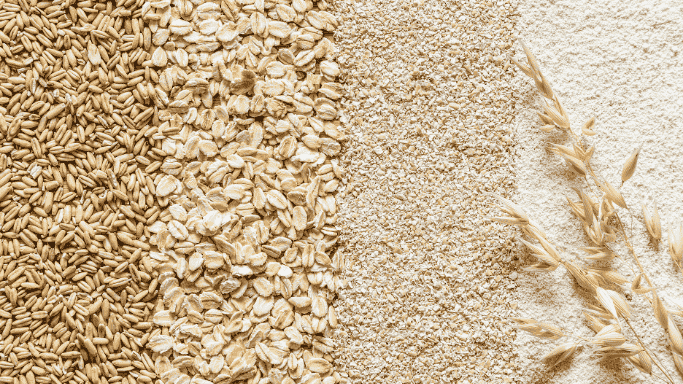
Different forms of oats displayed in neat vertical sections.

Most Americans get excess niacin without realizing it. The problem comes from multiple sources working together.

Food Fortification Since the 1940s

The United States mandates niacin fortification in common foods like flour, cereals, rice, and oats. This policy successfully eliminated pellagra, a niacin deficiency disease.

But now this mandatory fortification may contribute to excess intake in many people.

Supplement Overuse

Many Americans take niacin-containing supplements, believing more vitamins equal better health. Over-the-counter niacin supplements often contain 100 to 1,000mg per dose.

Your daily requirement is only 14-16mg.

Dr. Hazen compares niacin intake to “multiple taps pouring water into a bucket.” Once your body’s needs are met, the excess “spills over” into harmful metabolites.

Inflammation and Cellular Health

A woman with curly hair in a white shirt holds her lower back while sitting at a home office desk.

Chronic inflammation damages your cardiovascular system at the cellular level. When 4PY triggers inflammatory pathways, it accelerates the aging process in your blood vessels.

This type of cellular damage affects your overall healthspan, not just your heart.

Supporting your body’s natural anti-inflammatory processes becomes even more important when facing hidden inflammatory triggers like excess niacin.

Testing Your Inflammatory Status

Understanding your body’s inflammatory burden can help guide better health decisions. Advanced biomarker testing can reveal hidden inflammation before it causes obvious symptoms.

Jinfiniti’s AgingSOS Advanced Panel measures 22 biomarkers, including inflammatory markers that affect cardiovascular health.

What This Means for Your Heart Health

ChatGPT said:

The image shows a doctor explaining heart health, emphasizing the importance of understanding your heart to make informed decisions for better care.

This research changes how we think about B vitamin supplementation. More isn’t always better, especially with widespread food fortification.

Practical Steps You Can Take

Avoid unnecessary niacin supplements unless your doctor specifically recommends them. Most people get adequate niacin from diet alone.

Focus on supporting your body’s natural cellular repair processes instead of adding more vitamins.

Consider testing your inflammatory status to understand your current cardiovascular risk profile.

The Role of NAD+ in Heart Health

Interestingly, while excess niacin may increase heart disease risk, your body still needs adequate levels to produce NAD+, a crucial cellular energy molecule. 

NAD+ levels decline with age, affecting cellular function throughout your body.

The key is balance. You want sufficient niacin for NAD+ production without the excess that creates harmful metabolites.

Supporting Cardiovascular Health Naturally

Instead of relying on high-dose niacin for cholesterol management, consider natural approaches that support heart health without inflammatory side effects.

Anti-inflammatory herbs and compounds like curcumin and quercetin can help reduce cardiovascular inflammation.

Quality omega-3 fatty acids support heart health through multiple pathways without the risks associated with excess niacin.

The Bottom Line on Niacin and Your Heart

This groundbreaking research reveals that even essential nutrients can cause problems in excess amounts.

While niacin remains important for basic cellular function, excess amounts may cause problems. Too much increases cardiovascular disease risk through previously unknown inflammatory pathways.

The discovery of 4PY as a cardiovascular risk factor opens exciting possibilities.

Doctors might soon use personalized medicine approaches based on this research. In the future, doctors might test your 4PY levels and genetic variants to determine your optimal niacin intake.

The message is clear: avoid unnecessary niacin supplements. Focus on supporting your body’s natural inflammatory balance instead.

When it comes to vitamins, more isn’t always better for your heart health.

Referenced Sources:

  1. https://www.nature.com/articles/s41591-023-02793-8 ↩︎
  2. https://www.nhlbi.nih.gov/news/2024/excess-levels-vitamin-b3-linked-increased-heart-disease-risk ↩︎
  3. https://newsroom.clevelandclinic.org/2024/02/19/cleveland-clinic-led-study-discovers-link-between-high-levels-of-niacin-a-common-b-vitamin-and-heart-disease ↩︎
  4. https://pmc.ncbi.nlm.nih.gov/articles/PMC4352676/ ↩︎
Colorful red, blue and white capsule pills are scattered randomly across a light blue background.

Niacin (B3): Side Effects, Reactions, Overdose Risks Explained

You probably know niacin as vitamin B3, a nutrient that helps convert food into energy. But what happens when you take too much?

Recent research reveals a troubling truth about high-dose niacin supplementation. While this B vitamin plays important roles in your body, excess amounts can trigger serious side effects and may actually harm your heart health.

Key Takeaways

  • High-dose niacin can cause liver damage at doses as low as 500 mg daily
  • Excess niacin creates a harmful compound (4PY) that increases heart disease risk
  • The common niacin flush is uncomfortable but harmless and fades within a week
  • Safe daily limits are just 35 mg from supplements, far below therapeutic doses

Common Side Effects of Niacin You Should Know

An image showing a woman with visible facial redness.

Most people who take niacin supplements experience some form of side effects, ranging from mild discomfort to more concerning reactions.

The Infamous Niacin Flush

When you take niacin supplements, your face might turn red and feel warm within 15 to 30 minutes. This reaction happens because niacin activates special cells in your skin that release compounds called prostaglandins.1

These compounds make your blood vessels widen, creating that characteristic “niacin flush“. You might experience:

  • Redness on your face, arms, and chest
  • Itching or tingling sensations
  • A warm, burning feeling
  • Mild discomfort that lasts about an hour

The good news is your body adapts to this reaction within a week of regular use. Starting with smaller doses and gradually increasing them can help minimize this uncomfortable side effect.

Digestive Problems

Your stomach might not appreciate high amounts of niacin either. Common digestive issues include nausea, vomiting, diarrhea, and heartburn.

These problems typically improve as your body adjusts to the supplement. Persistent stomach pain could signal more serious complications that need medical attention.

Serious Risks When You Take Too Much Niacin

An image showing a healthcare professional in blue scrubs holding a pill bottle and writing on a clipboard, with medicine bottles on the table.

While mild side effects are manageable, high-dose niacin can cause life-threatening complications that require immediate medical attention.

Liver Damage Warning

Here’s where things get concerning. Doses as low as 500 mg daily can damage your liver, especially with sustained-release formulations. The amount of niacin that causes toxicity varies between individuals, but prescription niacin therapy requires careful liver monitoring.2

Watch for these warning signs:

  • Yellowing of your skin or eyes
  • Dark urine or light-colored stools
  • Unusual fatigue or weakness
  • Stomach pain in your upper right area

Severe cases can lead to liver failure requiring transplantation. This risk makes medical supervision crucial for anyone considering high-dose niacin therapy.

Blood Sugar Disruption

If you have diabetes or prediabetes, niacin may worsen your condition. High doses may increase your blood glucose levels by 6 to 9 mg/dL and reduce insulin sensitivity.3

Some people even develop diabetes after taking large amounts of niacin. This effect makes careful monitoring vital for anyone with blood sugar concerns.

Muscle Problems with Statins

Combining niacin with statin medications creates a dangerous combination. This pairing may increase the risk of rhabdomyolysis, a potentially fatal condition where muscle tissue breaks down.4

Symptoms include unexplained muscle pain, weakness, dark urine, and fever. This combination requires immediate medical attention.

The Cholesterol Paradox: Why Niacin May Harm Heart Health

An image showing two hands forming a heart shape against a purple background, with the person wearing a bright pink long-sleeve shirt.

People often take niacin to lower cholesterol levels and improve their lipid profiles. Traditional thinking suggested this approach benefits cardiovascular health by raising HDL cholesterol and reducing LDL levels along with triglyceride concentrations.

New research paints a different picture entirely.

The 4PY Problem

A 2024 Cleveland Clinic study published in Nature made a startling discovery about excess niacin. When your body processes too much of this vitamin, it creates a harmful compound called 4PY.5

This metabolite directly triggers inflammation in your blood vessels. About 25% of people have high enough 4PY levels to double their risk of heart attacks and stroke.6

The compound works by increasing a protein called VCAM-1, which helps inflammatory cells stick to blood vessel walls. This process accelerates the development of cardiovascular disease and contributes to oxidative stress throughout your system.

Clinical Trial Results

Large studies like HPS2-THRIVE and AIM-HIGH found that adding niacin to statin therapy provided no cardiovascular benefits. Some participants actually experienced higher mortality rates and more heart attacks than expected.7

These findings explain why many cardiologists no longer recommend niacin for managing high cholesterol. The risks now appear to outweigh potential benefits for most people.

Dangerous Drug Interactions to Avoid

an image showing a person politely refusing an offer of alcohol, using a hand gesture to signal refusal.

Niacin can interfere with many prescription medications, creating potentially dangerous combinations that require careful medical oversight.

Blood Thinners

Taking niacin with anticoagulant medications may increase the risk of bleeding complications significantly.8

Diabetes Medications

Niacin can reduce the effectiveness of diabetes drugs by raising blood sugar levels.

Gout Treatments

This B vitamin can trigger gout attacks and interfere with medications designed to treat this condition.

Alcohol

Drinking alcohol while taking niacin increases both flushing reactions and liver damage risk.

Safe Dosage Guidelines and Niacin Overdose Signs

An image showing an older woman in a light purple shirt holding her head and face with a pained expression, possibly experiencing a headache or discomfort.

High levels of niacin can be dangerous. The recommended daily allowance for adults is only 14 to 16 mg. The upper safe limit from supplements is 35 mg daily.

Therapeutic doses prescribed by doctors range from 1,500 to 3,000 mg daily, but these require careful medical supervision and regular monitoring.

Overdose Warning Signs

Doses between 2,000 to 6,000 mg can cause severe toxicity. Watch for:9

  • Rapid heartbeat or palpitations
  • Severe dizziness with flushing
  • Persistent vomiting
  • Severe stomach pain
  • Vision problems
  • Gout attacks

Seek immediate medical attention if you experience these symptoms.

Better Alternatives for High Cholesterol Management

A stethoscope and red heart sit on medical papers at a doctor's desk with a blurred person behind.

High cholesterol requires professional medical evaluation and monitoring. Work with your healthcare provider to develop a comprehensive treatment plan.

Some people need prescription medications like statins to reach target cholesterol levels safely. Your doctor can determine the best approach based on your individual risk factors and health history.

Never stop prescribed cholesterol medications without medical supervision, even if you’re making lifestyle changes.

Lifestyle Changes That Work

Diet modifications offer the most powerful cholesterol-lowering effects. Focus on foods rich in soluble fiber like oats, beans, and apples.

Replace saturated fats with healthy options like olive oil, nuts, and fatty fish. These changes can reduce LDL cholesterol by 10-15% within weeks.

Regular exercise provides another major benefit. Just 30 minutes of moderate activity most days can raise HDL cholesterol and lower triglycerides.

Weight loss also improves your lipid profile significantly. Losing even 5-10 pounds can make a meaningful difference in your cholesterol numbers.

When to Consider NAD+ Support

NAD+ precursors work through different pathways than high-dose niacin. These compounds support cellular energy production without the inflammatory risks associated with niacin excess.

Testing your NAD levels can help you understand your cellular energy status without relying on potentially harmful vitamin B3 mega-doses.

The best longevity supplements focus on cellular health optimization rather than attempting to manipulate cholesterol through potentially harmful pathways. Cellular health supplements offer targeted support for your body’s energy systems.

Additional Support Options

Some people find success with:

  • Plant sterols and stanols (2 grams daily)
  • Omega-3 fatty acids from fish or supplements
  • Psyllium husk fiber supplements
  • Green tea extract

Special Considerations for Different Groups

An elderly hand holding various colorful pills and capsules.

Certain populations need extra caution when considering niacin supplementation due to increased sensitivity or higher risk of complications.

Pregnancy and Nursing

Pregnant women should avoid high-dose niacin unless specifically prescribed by their healthcare provider. While no birth defects have been directly linked to niacin, the safety profile during pregnancy remains unclear.

Older Adults

Seniors may experience more intense side effects and require lower doses or more frequent monitoring.

People with Existing Conditions

Those with liver disease, peptic ulcers, diabetes, or kidney problems should avoid niacin supplementation entirely or use it only under strict medical supervision.

The Bottom Line on Niacin Safety

While niacin plays important roles in converting food into energy and supporting cellular function, the risks of high-dose supplementation now appear to outweigh the benefits for most people.

The discovery that excess niacin may increase cardiovascular disease risk through the 4PY pathway has fundamentally changed how we view this supplement.

Current practices that fortify foods with niacin may even exceed optimal intake levels for heart health.

If you’re currently taking high-dose niacin or considering it for cholesterol management, discuss safer alternatives with your healthcare provider.

Referenced Sources:

  1. https://www.sciencedirect.com/science/article/abs/pii/S0003986124002856 ↩︎
  2. https://lpi.oregonstate.edu/mic/vitamins/niacin ↩︎
  3. https://jamanetwork.com/journals/jama/fullarticle/193064 ↩︎
  4. https://www.mayoclinic.org/drugs-supplements/simvastatin-and-niacin-oral-route/description/drg-20071610 ↩︎
  5. https://www.nature.com/articles/s41591-023-02793-8 ↩︎
  6. https://www.nih.gov/news-events/nih-research-matters/how-excess-niacin-may-promote-cardiovascular-disease ↩︎
  7. https://www.nejm.org/doi/full/10.1056/NEJMoa1300955 ↩︎
  8. https://www.drugs.com/drug-interactions/niacin.html ↩︎
  9. https://www.webmd.com/diet/supplement-guide-niacin ↩︎

Woman holding a frying pan with colorful text representing essential anti-aging nutrients like vitamins A, C, D, E, B6, B12, and minerals such as calcium, magnesium, and zinc for aging well.

10 Vitamins and Minerals with Anti-Aging Benefits

Your body needs specific nutrients to stay youthful and fight age-related decline. Research shows certain nutrients play key roles in supporting cellular health and slowing aging.

These ten vitamins and minerals have solid science backing their anti-aging properties. From protecting your DNA to supporting brain function, each offers unique benefits for healthy aging.

Best Anti-Aging Vitamins and Minerals

An image showing a variety of vitamin and mineral supplements.
NutrientAnti-Aging BenefitKey Research
Vitamin DTelomere protectionPrevents 3 years of biological aging
Vitamin CCollagen productionReduces photoaging in 12 weeks
ZincImmune function5mg increase linked to longer telomeres
MagnesiumCellular energyInvolved in 600+ cellular reactions
Vitamin EMembrane protectionWorks synergistically with vitamin C
SeleniumAntioxidant enzymes20mcg increase = longer telomeres
B VitaminsBrain health30% reduction in brain shrinkage
Vitamin K2Bone/brain protection36% lower death risk
PotassiumCellular function33% lower death risk with adequate intake
MolybdenumDetoxificationCorrelates with longevity regions

Vitamin C

An image showing a halved orange with droppers and a bottle of vitamin C serum.

Vitamin C builds collagen and protects skin from aging damage. Your body uses this vitamin to create the protein that keeps your skin firm and elastic.

Studies show impressive results for vitamin C supplementation. Research using topical vitamin C found a significant reduction in photoaging scores and improvement in wrinkles after 12 weeks of use.1

The aging process naturally breaks down collagen through enzymes called matrix metalloproteinases. Vitamin C helps block these enzymes while boosting new collagen production.

Key Benefits:

  • Reduces signs of aging like wrinkles and age spots
  • Protects against UV damage
  • Supports immune function
  • Maintains longer telomeres

Large population studies found that people with higher vitamin C intake had longer telomeres. These protective DNA caps shorten as you age, making telomere length a key marker of biological aging.2

Zinc

An image showing white pills spelling "Zn" on a pink background, with an open pill bottle nearby, representing zinc supplements.

Zinc supports immune function and activates longevity pathways throughout your body. This mineral plays a role in over 300 enzyme reactions that keep your cells working properly.

Research from the NHANES study of nearly 4,000 adults found remarkable results. Every 5mg increase in dietary zinc was linked to longer telomeres, with the strongest effects in women and older adults.3

Your immune system particularly benefits from zinc. The mineral supports natural killer cells and helps neutrophils fight off infections.

Key Benefits:

  • Supports DNA repair and protein synthesis
  • Maintains telomere length
  • Boosts immune function in older adults
  • Protects against cellular senescence

Zinc deficiency becomes more common with age due to poor absorption and dietary changes. Most people meet their needs through food, but some benefit from targeted supplementation.

Looking for Quality Immune Support?

Jinfiniti’s Natural Vitamin C + Zinc combines bioavailable zinc chelate with whole food vitamin C from amla extract. This pairing supports your immune system while providing the antioxidant protection both nutrients offer together. You get two aging-protective nutrients in their most absorbable forms.

Magnesium

An image showing a bottle of magnesium with several tablets placed beside it on a surface.

Magnesium powers cellular energy production and protects against age-related decline. This mineral serves as a helper in over 600 reactions that power your cells.

Recent analysis shows magnesium connects with all major hallmarks of aging. These include DNA damage, telomere shortening, and mitochondrial dysfunction.4

Your cells rely on magnesium for energy production. The mineral helps your cellular powerhouses create ATP, the fuel that powers everything from muscle contraction to brain function.

Key Benefits:

  • Supports cellular energy production
  • Helps maintain DNA stability
  • Reduces oxidative stress and inflammation
  • Supports healthy blood pressure and heart function

Many older adults don’t get enough magnesium from food alone. Medications like heartburn drugs reduce absorption, making deficiency more likely. Supporting your cellular health becomes increasingly important as magnesium levels decline with age.

Vitamin D

An image showing vitamin D supplements.

Vitamin D protects your cells from biological aging better than any other vitamin. The landmark VITAL study represents the first large-scale trial to show vitamin D’s protective effects on biological aging.

The VITAL Telomere sub-study followed over 1,000 participants for 4 years. Those taking 2,000 IU of vitamin D3 daily showed significantly slower telomere shortening compared to placebo.5

The results were striking. Vitamin D supplementation prevented the equivalent of nearly 3 years of biological aging.

Key Benefits:

  • Protects telomeres from shortening
  • Supports immune system function
  • Helps reduce chronic inflammation
  • Supports stem cell maintenance

Your skin makes vitamin D from sunlight, but production decreases with age. Most people over 50 need supplements to maintain optimal levels for healthy aging.

Vitamin E

An image showing Vitamin E supplements arranged creatively, spelling out 'VITAMIN E'.

Vitamin E protects your cell membranes from oxidative damage that accumulates over time. As a fat-soluble antioxidant, it works particularly well in protecting cellular structures made of lipids.

This vitamin works best when combined with other antioxidants. Research shows that vitamin C helps regenerate vitamin E, creating a synergistic protection system against free radicals.6

Studies in older adults found that combining 300mg vitamin E with 400mg vitamin C daily for one year reduced markers of oxidative stress. This combination approach provides more effective protection than taking either vitamin alone.

Key Benefits:

  • Protects cell membranes from lipid peroxidation
  • Works synergistically with vitamin C
  • Supports immune function in elderly people
  • Helps slow cellular senescence

Individual responses to vitamin E vary based on your current oxidative stress levels. People with higher baseline oxidative damage tend to see more benefits from supplementation.

Understanding your oxidative stress markers helps guide your supplementation strategy.

Selenium

A green capsule filled with small green spheres, each labeled "Se" for Selenium.

Selenium forms powerful antioxidant enzymes that protect your cells from damage. Your body incorporates this mineral into selenoproteins that defend against oxidative stress and support immune function.

Studies show that people with higher selenium intake have longer telomeres. Every 20 microgram increase in dietary selenium was associated with longer telomeres in adults over 45.7

Your skin particularly benefits from selenium’s protective effects. The mineral helps protect keratinocyte stem cells against senescence, helping maintain your skin’s ability to repair and regenerate.

Key Benefits:

  • Essential component of antioxidant enzymes
  • Protects against UV-induced skin damage
  • Supports immune system function
  • Preserves stem cell function

Clinical trials combining selenium with coenzyme Q10 showed improvements in anti-aging biomarkers after long-term supplementation. Brazil nuts provide one of the richest food sources of selenium.8

B Vitamins

An image showing B Vitamins supplements.

B vitamins maintain cognitive function and cardiovascular health as you age. B6, B12, and folate support DNA methylation processes that help regulate gene expression.

The VITACOG trial showed that B vitamin supplementation reduced brain shrinkage by 30% in older adults at risk for dementia. The effects were even stronger in people with elevated homocysteine levels.9

Your ability to absorb vitamin B12 decreases with age. About 40% of people aged 75-80 have diminished capacity to absorb food-bound B12, contributing to cognitive decline and fatigue.

Key Benefits:

  • Support DNA repair and methylation processes
  • Help reduce homocysteine levels
  • Essential for neurotransmitter production
  • Slow brain atrophy and cognitive decline

B vitamin deficiencies become increasingly common in older adults due to medication interactions and digestive changes. Brain health supplements that include B vitamins help support cognitive function during aging.

Vitamin K2

An image showing several white capsules floating against a blurred gray background. Each capsule is labeled "D3 + K2".

Vitamin K2 protects bone health and brain function through calcium regulation and longevity pathway activation. This form of vitamin K activates proteins involved in calcium regulation and supports longevity pathways.

Animal studies show impressive results for vitamin K2 supplementation. Rats given vitamin K2 showed improved memory, reduced anxiety, and better functional performance compared to control groups.10

The vitamin works by activating Matrix Gla Protein, which prevents calcium from depositing in arteries and soft tissues. This helps maintain cardiovascular health and reduces age-related disease risk.

Key Benefits:

  • Supports bone formation and strength
  • Prevents arterial calcification
  • Improves cognitive function and mood
  • Supports mitochondrial energy metabolism

Population studies suggest that higher vitamin K intake is associated with 36% lower risk of death from any cause in high-risk cardiovascular populations.

Potassium

A blue capsule pill labeled with the chemical element potassium containing smaller blue spheres inside, each also marked with the letter "K."

Potassium maintains cellular function and influences lifespan through multiple pathways. This mineral helps maintain the electrical balance that keeps your cells functioning properly.

The Rancho Bernardo Study followed over 1,300 older adults for 20 years. Those with the lowest potassium intake had a 33% increased risk of death compared to those with moderate intake levels.11

Research shows that potassium affects cellular cleanup mechanisms. Studies in yeast found that potassium restriction extends lifespan by 20% through enhanced cellular acidification and improved autophagy.

Key Benefits:

  • Maintains cellular membrane potential
  • Supports cardiovascular function
  • Enhances cellular cleanup processes
  • Protects against stroke risk

Most people don’t get enough potassium from their diet. Fruits, vegetables, and legumes provide the best food sources of this aging-protective mineral.

Molybdenum

A white pill bottle labeled "Mo Molybdenum" is tipped over with several pink tablets spilled out onto a white surface.

Molybdenum supports cellular detoxification and shows correlations with longevity in population studies. While research is limited, population studies suggest interesting connections between molybdenum and longevity.

Studies in Chinese longevity regions found correlations between soil and water molybdenum levels and the percentage of long-lived residents. These areas show elevated molybdenum in their natural environment.12

Your body uses molybdenum as a cofactor for enzymes involved in purine metabolism and cellular detoxification. The mineral supports antioxidant enzyme function and helps process sulfur-containing compounds.

Key Benefits:

  • Supports detoxification enzyme function
  • Essential for purine metabolism
  • Contributes to bone health
  • Supports antioxidant systems

More research is needed to understand molybdenum’s role in aging, but population data suggests this trace element deserves attention in longevity research.

Start with the Right Approach to Healthy Aging

An image showing person holding a pill organizer with jars of pills on a table.

These vitamins and minerals work best together rather than alone. Research consistently shows that combinations of antioxidants provide superior protection compared to single nutrients.

The key is getting adequate amounts without overdoing it. Moderate supplementation generally works better than megadoses, which sometimes backfire.

Start with the right approach:

  • Test your current nutrient levels first
  • Focus on food sources when possible
  • Target specific deficiencies with supplements
  • Track your response and adjust as needed

This follows the proven “test, act, optimize” approach that delivers real results.

Understanding your individual nutrient needs requires personalized testing rather than guesswork. Jinfiniti’s longevity testing panels help identify which nutrients you need most for optimal aging.

Ready to take a comprehensive approach?

Explore natural senolytic supplements that work alongside these nutrients. Products like Jinfiniti’s SenoAid combine multiple aging-protective compounds for better results.

Remember that nutrition is just one piece of the healthy aging puzzle.

Regular exercise, stress management, and quality sleep all work together with proper nutrition to help you age successfully.

Learning about practices that support mitochondrial health takes your anti-aging strategy even further.

Referenced Sources:

  1. https://jcadonline.com/topical-vitamin-c-and-the-skin-mechanisms-of-action-and-clinical-applications/ ↩︎
  2. https://www.frontiersin.org/journals/aging/articles/10.3389/fragi.2024.1339317/full ↩︎
  3. https://www.frontiersin.org/journals/nutrition/articles/10.3389/fnut.2022.993425/full ↩︎
  4. https://pmc.ncbi.nlm.nih.gov/articles/PMC10892939/ ↩︎
  5. https://news.harvard.edu/gazette/story/2025/05/vitamin-d-supplements-may-slow-biological-aging/ ↩︎
  6. https://pmc.ncbi.nlm.nih.gov/articles/PMC2685276/ ↩︎
  7. https://linkinghub.elsevier.com/retrieve/pii/S0002916522049656 ↩︎
  8. https://www.medicalnewstoday.com/articles/does-selenium-really-slow-aging ↩︎
  9. https://pmc.ncbi.nlm.nih.gov/articles/PMC4045270/ ↩︎
  10. https://pmc.ncbi.nlm.nih.gov/articles/PMC8944720/ ↩︎
  11. https://pmc.ncbi.nlm.nih.gov/articles/PMC8075047/ ↩︎
  12. https://lpi.oregonstate.edu/mic/minerals/molybdenum ↩︎
An image of cellular activity inside the human body.

What’s the Difference Between NAD, NADP and NADPH?

Your cells depend on three similar-sounding molecules that perform completely different jobs. NAD, NADP, and NADPH might look nearly identical, but each plays a unique role in keeping you healthy and energized.

Understanding these cellular powerhouses can help you make better decisions about your health and longevity

Key Takeaways

  • One tiny difference, huge impact: NADP has just one extra phosphate group compared to NAD, but this completely changes their cellular jobs
  • NAD = energy production: NAD and NADH break down food to create cellular energy (ATP)
  • NADP = building and protection: NADP and NADPH construct new molecules and defend cells from damage
  • Both decline with age: Lower levels can affect your energy, metabolism, and cellular repair processes

Understanding These Key Nucleotide Coenzymes

NAD stands for nicotinamide adenine dinucleotide.

This coenzyme exists in two forms: NAD+ (oxidized) and NADH (reduced). Think of NAD as a rechargeable battery that powers your cellular energy production.

  • NADP means nicotinamide adenine dinucleotide phosphate. It’s nearly identical to NAD but carries an extra passenger. NADP also has two forms: NADP+ (oxidized) and NADPH (reduced).
  • NADPH is simply NADP+ after it picks up hydrogen and electrons. This reduced form becomes a cellular construction worker, building the molecules your body needs to stay healthy.

The Important Phosphate Group Difference

The only structural difference between NAD and NADP is one small phosphate group attached to NADP. This tiny addition completely changes what each molecule can do in your cells.

It’s like adding a special tool to a worker’s belt. That phosphate group directs NADP toward entirely different cellular tasks than NAD handles.

NAD and NADH: Your Cellular Energy Pathway

An image of a woman eating healthy foods

NAD and NADH form your cellular energy production team. When you eat food, your cells break it down through cellular respiration to create ATP.

Here’s how the process works:

  • NAD+ acts like a collection vehicle, gathering electrons and hydrogen from food molecules during glycolysis and the citric acid cycle
  • Dehydrogenase enzymes help oxidize substrates, transforming NAD+ into NADH
  • NADH carries captured protons and electrons to your mitochondria
  • Your mitochondria use NADH through oxidation reactions to produce ATP, your cell’s main energy currency

This pathway represents catabolic metabolism. Your cells break down larger molecules to release energy for immediate use.

MoleculePrimary RoleProcess Type
NAD+/NADHEnergy productionCatabolic (breakdown)
NADP⁺/NADPHBuilding & protectionAnabolic (construction)

NADP and NADPH: The Biosynthesis and Protection Team

An image of cellular activity inside the human body

NADP and NADPH handle completely different cellular jobs. They focus on building new molecules and protecting your cells from damage.

The biochemistry of NADH and NADPH working together helps your cells both generate and use energy effectively. NADPH serves as your cellular construction manager:

  • Building functions: Provides reducing power to synthesize fatty acids, cholesterol, and amino acids
  • DNA synthesis: Helps create nucleotide building blocks for genetic material
  • Photosynthesis: In plants, NADPH powers the Calvin cycle to convert carbon dioxide into sugar
  • Protection functions: Regenerates antioxidants like glutathione that defend against cellular damage1

These biotechnology-inspired anabolic processes require energy to build complex molecules from simpler substrate components.

Redox Reactions: How These Enzyme Partners Work

Both systems function through redox reactions, where electrons transfer between molecules. These reactions drive nearly every metabolic process in your body.

NAD+ accepts electrons during glycolysis and the citric acid cycle. The electron transport chain in your mitochondria then uses NADH to generate ATP through oxidative phosphorylation.

NADPH donates electrons during biosynthesis reactions. The pentose phosphate pathway generates most of your cellular NADPH supply.2

How NAD and NADP Work with Different Substrate Systems

Your cells maintain distinct ratios of these molecules for good reason. NADPH levels stay high relative to NADP⁺, while NAD+ levels exceed NADH concentrations.

This separation allows each system to work effectively:

  • Different priorities: NAD focuses on energy extraction, while NADP handles construction and protection
  • Different locations: Various enzymes and pathways use each system specifically
  • Different timing: Energy needs and building needs occur at different cellular moments

Research shows that disrupting these ratios can affect cellular metabolism. Studies also indicate that maintaining proper NAD+/NADH balance becomes more challenging with age.3 4

Testing Your NAD Levels for Better Metabolism

Understanding your personal NAD status can help you enhance your cellular energy production. NAD+ levels decline with age, potentially affecting your energy, sleep, and cognitive function.

Jinfiniti’s Intracellular NAD+ Test measures your cellular NAD levels directly. This finger-prick test provides personalized dosage recommendations for NAD+ supplementation.

The NAD Optimization Starter Package combines testing with targeted supplementation, letting you measure your baseline levels and track improvement over time.

Bottom Line

NAD, NADP, and NADPH work together but serve completely different cellular functions. NAD and NADH power your energy production through catabolic pathways like glycolysis and cellular respiration.

NADP and NADPH handle biosynthesis and cellular protection through anabolic processes. That single phosphate group makes all the difference in directing these molecules toward their specialized roles.

Both systems are key for better health, proper metabolism, and healthy aging. Testing your NAD levels can help you understand whether your cellular energy systems need support.

Referenced Sources:

  1. https://pubmed.ncbi.nlm.nih.gov/20196923/ ↩︎
  2. https://www.ncbi.nlm.nih.gov/pmc/articles/PMC8168431/ ↩︎
  3. https://www.ncbi.nlm.nih.gov/pmc/articles/PMC11233901/ ↩︎
  4. https://www.ncbi.nlm.nih.gov/pmc/articles/PMC7963035/ ↩︎
An image of a man undergoing therapy for addiction

NAD Therapy for Addiction Recovery: Benefits and Risks

Addiction affects millions of people worldwide, leaving individuals and families searching for effective treatment options. NAD therapy has gained attention as a potential complementary approach to traditional addiction recovery methods.

This treatment involves administering nicotinamide adenine dinucleotide (NAD+), a coenzyme that plays a vital role in cellular energy production and brain chemistry. While some people report positive results, the therapy remains experimental and carries both promise and risks.

Key Takeaways

  • NAD therapy may help reduce cravings and withdrawal symptoms, but research is limited and the treatment isn’t FDA-approved
  • Oral NAD precursors like NMN appear safer than IV therapy while still supporting cellular NAD+ levels
  • The therapy should never replace proven addiction treatments but may complement complete recovery plans
  • Medical supervision is important since withdrawal from certain substances can be dangerous without proper protocols

What Is NAD Therapy for Addiction?

An image of a man undergoing therapy for addiction

NAD therapy for addiction involves administering NAD+ through IV infusion or oral supplementation to support recovery from substance abuse. The treatment aims to restore depleted NAD levels in people struggling with alcohol addiction, opioid dependency, and other forms of addiction.

Your body naturally produces NAD+, but chronic substance use can deplete these stores. This depletion affects cellular function and brain chemistry, potentially making withdrawal symptoms more severe and recovery more challenging.

How NAD Levels Impact Brain Function

Substance abuse disrupts the delicate balance of neurotransmitters in your brain, including dopamine pathways that control reward and motivation. When NAD in the body becomes depleted, neurons struggle to produce energy efficiently.

This cellular dysfunction can worsen withdrawal symptoms and make it harder to maintain sobriety. Understanding how NAD+ functions in your body helps explain why some practitioners believe this therapy may improve brain function and support addiction recovery.

Low NAD levels can impact DNA repair mechanisms and cellular regeneration processes that are vital for healing from the damage caused by long-term substance use.

Benefits of NAD Therapy for Addiction Recovery

An image of a woman undergoing therapy for addiction

Proponents of nad therapy claim it offers many benefits for people in addiction recovery. Research suggests several potential advantages, though more studies are needed to confirm these effects.

Reduce Cravings and Withdrawal Symptoms

A 2022 study of 50 patients with substance use disorder showed promising results. Participants who received NAD+ infusions experienced significant reductions in craving scores, anxiety, and depression.1

The study reported that 100% of urine samples from 40 patients tested negative for substances midway through treatment. This suggests nad therapy may help alleviate withdrawal symptoms during the detox process.

Participants reported improved mental clarity and reduced intensity of withdrawal discomfort. These effects could make the early stages of recovery more manageable for some individuals.

Symptom CategoryImprovement Reported
CravingsSignificant reduction
AnxietyNotable decrease
DepressionMeasurable improvement
Mental clarityEnhanced focus

Supporting Cellular Repair

NAD therapy may help replenish cellular energy stores that substance abuse has damaged. The therapy helps restore normal brain function by supporting cellular repair mechanisms and energy production.

When you receive nad therapy, it may help flush toxins from your system while supporting your body’s natural healing processes. This cellular support could alleviate some of the physical challenges experienced during recovery.

The treatment may also help restore normal energy levels, which often remain low during early recovery periods. Better energy can support your motivation to engage in other aspects of your treatment plan.

NAD Therapy and Addiction Treatment Research

An image of a woman lying on a sofa with a health professional beside her

The scientific evidence for NAD therapy in addiction treatment comes from small studies and historical case reports. While early results show promise, larger controlled trials are needed.

Clinical Evidence

Dr. Paul O’Hollaren’s early research documented treatment of 104 addiction cases using intravenous NAD+. His retrospective case series used doses of 500-1000 mg daily for specific treatment periods.2

More recent animal studies have shown that NAD+ pathways are involved in cocaine reward mechanisms in the brain. This research suggests targeting these pathways might provide therapeutic benefits against addiction.3

Most current research has significant limitations:

  • Small sample sizes
  • Lack of proper control groups
  • Limited long-term follow-up data
  • No FDA approval for addiction treatment

Risks and Side Effects of NAD Therapy

A matured woman vomitting

Like any medical treatment, NAD therapy carries potential risks and side effects. Understanding these concerns helps you make informed decisions about your addiction recovery approach.

Common Side Effects During Treatment

NAD IV therapy side effects can occur during and after infusion. Most people experience mild symptoms that resolve within 24 hours.

During infusion, you might experience:

  • Nausea and vomiting
  • Flushing of face and body
  • Dizziness and lightheadedness
  • Headaches
  • Muscle cramps
  • Chest pressure

Injection site reactions can include redness, swelling, or bruising. Serious complications like infection or phlebitis are rare but possible.

Safety Concerns for Addiction Recovery

A concerning investigation documented cases where individuals receiving NAD therapy experienced seizures during withdrawal. This occurred when people were required to stop substances abruptly without proper medical supervision.

This highlights a critical safety issue: nad therapy should never replace established medical protocols for withdrawal management. Sudden cessation of alcohol use or benzodiazepines can be fatal without proper medical tapering.

The therapy is not regulated by the FDA, leading to variable quality and safety standards across different providers. Always seek treatment from qualified healthcare professionals experienced in addiction medicine who offer nad therapy as part of complete care.

🧬 READ MORE HEALTH INSIGHTS

  • Weighing your treatment options? NAD IV therapy benefits sound impressive, but understanding what science actually supports is key to making smart decisions.
  • Wondering if the investment makes sense? Is NAD IV therapy really worth your time? We break down the cost-benefit analysis and help you decide if it fits your health goals.

NAD Levels Testing and Treatment Planning

Before starting any NAD-based treatment, testing your current NAD levels provides valuable baseline information. This follows Jinfiniti’s proven “Test, Act, Optimize” approach to personalized health.

Jinfiniti’s Intracellular NAD+ Test measures your cellular NAD+ levels through a simple at-home blood test. This information helps healthcare providers develop targeted treatment approaches based on your individual needs.

Understanding your specific nad levels allows for more precise interventions. Some people may benefit more from supplementation than others based on their baseline measurements.

The test takes the guesswork out of treatment planning. You can establish your starting point, implement interventions, then retest to measure progress and adjust your approach as needed.

Natural Ways to Increase NAD Levels

Beyond IV therapy, several natural approaches can help boost NAD+ levels safely. These methods may provide gentler support for your recovery journey.

Lifestyle changes that support NAD+ production include:

  • Regular exercise
  • Intermittent fasting,
  • Adequate sleep. 

These habits also support overall recovery by improving physical and mental health.

Foods that naturally boost NAD levels include fish, chicken, mushrooms, and green vegetables. Adding these to your diet provides nutrients your body needs to produce NAD+ naturally.

A Safer Alternative to IV Treatment

APRIL JF Blogs1 2025 08 13T111555.286

Oral NAD precursors like nicotinamide riboside (NR) and nicotinamide mononucleotide (NMN) may offer advantages over direct IV infusion. Choosing the best NAD supplements requires understanding your individual needs and goals.

Recent research shows that NR infusion was better tolerated than direct NAD+ IV therapy. Participants experienced 75% shorter infusion times and fewer inflammatory responses.4

Oral supplementation avoids injection-related risks while still supporting cellular NAD+ levels. NMN supplementation has shown promise in raising intracellular NAD+ by up to 70% in some studies.

Jinfiniti’s Vitality NAD+ Booster combines NAD+ precursors with supporting nutrients in a convenient powder form. This scientifically formulated blend provides cellular support without the risks associated with IV treatments.

The powder includes creatine monohydrate, D-ribose, and niacinamide alongside NAD+ precursors. This combination works across multiple pathways to support energy production and cellular repair.

Treatment MethodBenefitsConsiderations
IV NAD+Direct deliveryHigher side effects
Oral precursorsSafer profileSlower absorption
Combined approachBalanced benefitsRequires monitoring

Understanding NAD Dosage for Recovery

The right NAD dosage varies significantly between individuals. Factors like body weight, addiction severity, and baseline NAD levels all influence optimal dosing.

Starting with lower doses and gradually increasing allows you to assess tolerance and effectiveness. Working with healthcare providers experienced in NAD therapy helps ensure safe and effective dosing.

Regular testing helps track your response and adjust dosing as needed. This personalized approach maximizes benefits while minimizing potential side effects.

Making Informed Decisions About NAD Therapy

An image of a doctor explaining to a patient

NAD therapy remains an experimental treatment option that should complement, not replace, evidence-based addiction treatments. The FDA has approved specific medications for opioid and alcohol use disorders with extensive safety data.

If you’re considering NAD therapy for addiction recovery, work with healthcare providers experienced in both addiction medicine and NAD treatments. They can help you evaluate whether this therapy makes sense as part of your complete treatment plan.

Successful addiction recovery typically requires multiple approaches, including counseling, behavioral therapy, peer support, and sometimes medication-assisted treatment. NAD therapy, if appropriate for your situation, should be one component of a broader recovery strategy.

The therapy helps some people manage withdrawal symptoms and support cellular repair, but it’s not a cure for addiction. Long-term recovery success depends on addressing the psychological, social, and behavioral aspects of addiction alongside any biological interventions.

Testing your NAD levels before starting treatment provides valuable information for personalizing your approach. Consider starting with safer oral precursors rather than IV therapy, especially during the vulnerable early stages of recovery.

By following the “Test, Act, Optimize” methodology, you can make data-driven decisions about your recovery approach. This scientific method helps ensure you’re getting the most benefit from any interventions you choose to pursue.

Referenced Sources:

  1. https://pmc.ncbi.nlm.nih.gov/articles/PMC9474872/ ↩︎
  2. https://pmc.ncbi.nlm.nih.gov/articles/PMC7278809/ ↩︎
  3. https://pmc.ncbi.nlm.nih.gov/articles/PMC6971506/ ↩︎
  4. https://www.medrxiv.org/content/10.1101/2024.06.06.24308565v1.full-text ↩︎

Account Access

Welcome back

Continue your health journey with a secure login.