
Secure • Private • Science-backed
A woman with stylish short blonde-gray hair is smiling broadly while looking to the side on a plain background

5 Promising Benefits of NAD Supplements (and Side Effects)

NAD supplements are often sold with claims of reversing aging, boosting energy, and improving mental clarity. Many of these sound too good to be true.

Your body’s NAD+ levels drop byabout 50% between ages 40 and 60[1]. NAD is a coenzyme that metabolizes food, repairs damaged DNA, and converts nutrients into energy for your cells. Supplements like NMN or NR (nicotinamide mononucleotide or nicotinamide riboside) can boost your levels if you’re deficient.

Benefits are most apparent in people over 40 or with metabolic issues. A baseline test can also help you determine if you need them or not.

What You Should Know

  • NAD supplements show the most benefits in people with existing deficiencies or metabolic dysfunction
  • Studies suggest benefits for blood sugar control, heart health, brain function, physical performance, and DNA repair
  • Side effects are generally mild (nausea, bloating, headache) and resolve quickly in most people
  • Testing your NAD+ levels before and after supplementing removes all guesswork about effectiveness

What Are NAD Supplements?

NAD supplements supply precursors, or building blocks, that your cells can use to make NAD+ (nicotinamide adenine dinucleotide).

NAD+ is the energy source for all the cells in your body. You can think of it as a rechargeable battery used for hundreds of different processes within your cells.

Your cells use NAD+ for two main jobs:

  • Turning food into ATP, the fuel your cells run on
  • Powering sirtuins and PARPs, enzymes that play key roles in DNA repair, stress response, and aging

An enzyme called CD38, which literally nibbles away at NAD+, increases as you age. This, along with a decline in your body’s own production of NAD+, results in a drop in levels as we get older[2].

The two most studied forms of NAD supplements are NMN and NR, which take slightly different paths to boosting your levels.

CLIA-Certified NAD Test Kit

Test your NAD+ levels from home.
Jinfiniti Intracellular NAD Test on purple background

5 Promising Benefits of NAD Supplements

Supplementing with NAD precursors can help replenish your body’s NAD levels when they’re low. Here are the 5 benefits of NAD supplements that have the most clinical support.

Infographic showing 5 benefits of NAD supplements supported by research.

1. Better Blood Sugar Control and Insulin Sensitivity

Your muscle cells need to react to insulin so they can remove sugar from your blood. If this process stops working well, prediabetes or type 2 diabetes can develop.

A 2021 clinical trial published in Science gave 250 mg of NMN daily to postmenopausal women with prediabetes for 10 weeks. Using a standard test for insulin sensitivity, researchers saw clear improvements in how muscle responded to insulin[3].

Muscle samples showed that the cells were better at processing insulin signals. Genes related to muscle function were more active. These changes happened even though there was no weight loss.

NAD+ helps by turning on a protein called SIRT1, which helps cells respond to insulin and burn fat in the mitochondria. When NAD+ levels fall, this process weakens, and fat can build up in muscles and the liver, making it harder for insulin to work.

One thing to note: Studies in healthy young adults show little effect on blood sugar. The benefits seem to be greater when you already have problems with your metabolism[4].

2. Improved Heart Health and Blood Pressure

Stiff arteries and high blood pressure increase the risk of heart disease. When blood vessels become less flexible, the heart has to work harder to move blood through the body.

In a pilot study with 1000 mg of NR daily for 6 weeks, middle-aged adults with high blood pressure saw their systolic readings drop by an average of 8 mmHg[5]. This drop is similar to what some people get from blood pressure medications or major diet changes like sodium restriction.

The reason is that NR activates SIRT1 in the cells lining blood vessels. SIRT1 increases nitric oxide, which helps blood vessels relax. More NAD+ means more SIRT1 activity and better blood flow.

Other research shows NAD+ can lower inflammation markers like IL-6 and TNF-alpha in people with heart failure. These markers are linked to stiffer arteries[6].

3. Brain Function and Memory Support

Your brain uses about 20% of your body’s energy, even though it only makes up 2% of your body weight. Brain cells need a steady supply of energy and are easily affected by damage from oxidation.

NAD+ helps protect brain cells in several ways. SIRT1 and SIRT3, proteins activated by NAD+, help reduce oxidative stress and affect how certain brain proteins are processed, which may lower the risk of forming plaques linked to Alzheimer’s disease.

In animal studies on Alzheimer’s, NR supplements lowered brain inflammation, DNA damage, and tau tangles, while helping restore memory[7]. Early human studies show similar effects, with better cognitive scores and improved brain metabolism on scans[8].

A Phase I trial in people with Parkinson’s gave 3000 mg of NR daily for 4 weeks. Brain scans showed higher NAD+ levels in the brain[9].

NAD+ also regulates your sleep-wake cycle by helping control circadian rhythm. Studies in older adults found that NMN improved sleep quality and reduced daytime sleepiness, especially when taken in the afternoon[10].

4. Increased Energy and Physical Performance

As people get older, they often lose muscle, which can lead to weakness. NAD+ precursors may help the body in ways similar to exercise.

NAD+ turns on SIRT1, which then activates PGC-1alpha. This process helps the body make more mitochondria. It also changes muscle fibers from fast-twitch (which tire quickly) to slow-twitch (which last longer and burn fat better).

One study with amateur runners found that taking up to 1200 mg of NMN daily helped increase VO2 max (aerobic fitness) and the point where breathing becomes hard during exercise[11]. This happened because muscles used oxygen more efficiently, not because the heart pumped more.

For older adults, NMN supplements helped them walk faster and stand up from a chair more easily[10]. These improvements are linked to autonomy and longevity with age.

“We’ve seen that restoring NAD+ can help people feel more energetic,” says Dr. Jin-Xiong She, founder of Jinfiniti Precision Medicine. “How well it works depends on your baseline levels and overall health.”

5. DNA Repair and Cellular Protection

Your DNA is constantly getting damaged by things like sunlight, stress, and normal cell activity. To fix this damage, your cells need NAD+ to power their repair systems[12].

One of these repair helpers, PARP1, acts quickly when DNA strands break. It uses NAD+ to send out signals for other repair tools to come help. If your cells run low on NAD+, PARP1 can’t work properly, and DNA errors start to build up.

Research shows that when cells have less NAD+, they’re more easily harmed by radiation, but restoring NAD+ helps them fix DNA damage faster. This helps protect cells from stressors like environmental stress and medical scans[13].

Another enzyme, SIRT6, also relies on NAD+ to keep chromosome ends (telomeres) stable and to help fix serious DNA breaks. Sirtuins like SIRT6 also help keep the cell’s genetic instructions in order, which helps cells stay healthy as you get older.

Supplement Safety Note

NAD Supplement Side Effects: What to Watch For

Clinical trials have shown that NAD supplements generally have a strong safety record. Most side effects tend to be mild and depend on the dose you take.

The most common side effects reported with NMN and NR supplements are:

  • Nausea
  • Bloating
  • Loose stools or diarrhea
  • Mild headache
  • Stomach discomfort

These symptoms usually show up at higher doses and often fade within a few days as your body gets used to the supplement. Unlike niacin, NMN and NR do not cause the skin flushing reaction that many find uncomfortable.

Clinical studies have tested NR in amounts up to 3000 mg daily for four weeks and NMN up to 1250 mg daily for twelve weeks. Even at these higher doses, participants did not experience serious adverse events. Liver enzyme levels and kidney function remained normal throughout the studies[14].

Before starting NAD supplements, we recommend talking with your healthcare provider if you:

  • Take medications for diabetes or blood sugar management
  • Use blood thinners
  • Have active cancer or a history of cancer
  • Are pregnant or breastfeeding
  • Have liver or kidney disease

NAD supplements can interact with certain medications, so it’s wise to share your full supplement list with your doctor to help prevent any unwanted interactions.

Some individuals with MTHFR genetic variants choose to combine NMN with TMG (trimethylglycine) to support methylation pathways. However, research using 1000 mg of NR daily found no significant change in homocysteine levels among healthy adults.

NMN vs NR: Which NAD Supplement Should You Choose?

Both NMN and NR will help you boost NAD levels, though they follow different pathways to reach that goal.

NR enters your cells using certain transporters. Once inside, it first becomes NMN and then converts to NAD+. NR research points to benefits for heart health, blood pressure regulation, and brain function.

NMN may enter cells directly thanks to a newly discovered transporter in the gut. Clinical studies here suggest especially strong outcomes for muscle health, physical performance, and sleep quality.

FeatureNRNMN
Human Safety DataExtensive (multiple Phase I/II trials)Growing (several recent RCTs)
StabilityGood as chloride saltModerate (heat sensitive, requires stabilization)
Best Clinical EvidenceBlood pressure, inflammation, neuroprotectionInsulin sensitivity, aerobic performance, sleep quality
Cell EntrySpecific transportersSlc12a8 transporter plus conversion pathway
CostHighHigh (variable purity)

NR has been studied in humans for a longer period. NMN offers some unique benefits for metabolism, but it needs to be stored carefully so it doesn’t break down into plain nicotinamide, which can actually block the enzymes you want to support.

When looking for the best NAD supplement, think about your health goals and which benefits are most important to you.

Should You Take NAD Supplements?

Whether you should take NAD+ supplements really depends on your current NAD+ levels. Clinical trials consistently show that the most significant benefits appear in individuals who already have a deficiency.

People with prediabetes, high blood pressure, older adults, or those with impaired metabolic function notice the greatest improvements. Healthy young adults tend to see minor changes.

Testing your NAD+ levels transforms supplementation from guesswork into precision health optimization:

  • Test your baseline NAD+ levelsto see if you actually have a deficiency. The optimal range is 40-100 basedon our clinical research. Many people over 40 fall into suboptimal or deficient ranges.
  • Supplement based on your resultswith targeted dosing if needed. Your NAD dosageshouldbe personalized based on your levels rather than following one-size-fits-all approaches.
  • Retest after 4-8 weeksto see if the intervention is working. This removes all uncertainty about whether your supplement is effective or if you need to adjust your approach.

As Dr. She notes, “Testing transforms supplementation from hope to data. We process 90% of the world’s NAD+ tests because people finally have access to this information. You can see exactly how your body responds.”

If you supplement without testing, you’re left relying on marketing claims, never truly knowing whether your NAD+ levels are increasing. You might end up spending money on supplements that have no effect — or taking doses too low to matter.

Testing gives you clear, objective data. You know where you started. You know if your supplement works. You know when you’ve reached optimal levels.

Understanding what to expect before and after helps you set realistic goals and track meaningful changes as your NAD+ levels improve.

Frequently Asked Questions About NAD Supplements

Can I boost NAD levels naturally without supplements?

Exercise, calorie restriction, and not overindulging in alcohol are some of the ways to preserve NAD+ levels. Consuming B vitamins (found in foods such as chicken, fish, and mushrooms) can also support your body’s natural NAD+ production.

Are NAD supplements better than NAD injections?

Oral supplements are the better choice for most people. NAD injections cost 3-10x more with less research supporting them.

What forms do NAD supplements come in?

NAD precursor supplements are available as:

  • Powder (mix with water or take sublingually)
  • Capsules (convenient for consistent dosing)
  • Lozenges (dissolve under tongue for sublingual absorption)
  • Liposomal formulas (claim better absorption but not well supported)

Powder and capsule forms have the most clinical research behind them. Sublingual NMN may offer some benefits but hasn’t been proven in head-to-head studies.

What happens if you take NAD supplements every day?

Daily NAD supplementation has been found to be safe in trials up to several months in duration. You will likely begin to plateau on benefits at 4-8 weeks as you enter your optimal level. Some people cycle their supplementation or lessen their dosage once their levels have been optimized. Repeat testing will allow you to know when you are in your desired range.

Who should avoid NAD supplements?

Do not take NAD supplements if you have active cancer, are pregnant or breastfeeding, or have severe liver or kidney disease. Consult with your doctor first if you take diabetes medications, blood thinners, or chemotherapy. Those with a personal or family history of cancer should consult their oncologist before supplementing.

Does NAD reverse aging?

NAD+ won’t make you 20 again. However, it may help restore some cellular functions that tend to decline with age. You might notice improvements in your energy levels, sleep quality, cognitive function and metabolic health.

Referenced Sources

  1. McReynolds MR, Chellappa K, Baur JA. Age-related NAD+ decline. Elsevier BV; 2020. https://doi.org/10.1016/j.exger.2020.110888
  2. Alegre GFS, Pastore GM. NAD+ precursors nicotinamide mononucleotide (NMN) and nicotinamide riboside (NR): potential dietary contribution to health. Springer Science and Business Media LLC; 2023. https://doi.org/10.1007/s13668-023-00475-y
  3. Yoshino M, Yoshino J, Kayser BD, Patti GJ, Franczyk MP, Mills KF, et al. Nicotinamide mononucleotide increases muscle insulin sensitivity in prediabetic women. American Association for the Advancement of Science (AAAS); 2021. https://doi.org/10.1126/science.abe9985
  4. Kuerec AH, Wang W, Yi L, Tao R, Lin Z, Vaidya A, et al. Towards personalized nicotinamide mononucleotide (NMN) supplementation: nicotinamide adenine dinucleotide (NAD) concentration. Elsevier BV; 2024. https://doi.org/10.1016/j.mad.2024.111917
  5. Freeberg KA, Craighead DH, Martens CR, You Z, Chonchol M, Seals DR. Nicotinamide riboside supplementation for treating elevated systolic blood pressure and arterial stiffness in midlife and older adults. Frontiers Media SA; 2022. https://doi.org/10.3389/fcvm.2022.881703
  6. Abdellatif M, Sedej S, Kroemer G. NAD+ metabolism in cardiac health, aging, and disease. Ovid Technologies (Wolters Kluwer Health); 2021. https://doi.org/10.1161/circulationaha.121.056589
  7. Hou Y, Lautrup S, Cordonnier S, Wang Y, Croteau DL, Zavala E, et al. NAD+ supplementation normalizes key Alzheimer’s features and DNA damage responses in a new AD mouse model with introduced DNA repair deficiency. Proceedings of the National Academy of Sciences; 2018. https://doi.org/10.1073/pnas.1718819115
  8. Alghamdi M, Braidy N. Supplementation with NAD+ precursors for treating Alzheimer’s disease: a metabolic approach. SAGE Publications; 2024. https://doi.org/10.3233/jad-231277
  9. Berven H, Kverneng S, Sheard E, Søgnen M, Af Geijerstam SA, Haugarvoll K, et al. NR-SAFE: a randomized, double-blind safety trial of high dose nicotinamide riboside in Parkinson’s disease. Springer Science and Business Media LLC; 2023. https://doi.org/10.1038/s41467-023-43514-6
  10. Kim M, Seol J, Sato T, Fukamizu Y, Sakurai T, Okura T. Effect of 12-week intake of nicotinamide mononucleotide on sleep quality, fatigue, and physical performance in older Japanese adults: a randomized, double-blind placebo-controlled study. MDPI AG; 2022. https://doi.org/10.3390/nu14040755
  11. Benjamin C, Crews R. Nicotinamide mononucleotide supplementation: understanding metabolic variability and clinical implications. MDPI AG; 2024. https://doi.org/10.3390/metabo14060341
  12. Croteau DL, Fang EF, Nilsen H, Bohr VA. NAD+ in DNA repair and mitochondrial maintenance. Informa UK Limited; 2017. https://doi.org/10.1080/15384101.2017.1285631
  13. Svetlova M, Solovjeva L, Kropotov A, Nikiforov A. The impact of NAD bioavailability on DNA double-strand break repair capacity in human dermal fibroblasts after ionizing radiation. MDPI AG; 2023. https://doi.org/10.3390/cells12111518
  14. Yamaguchi S, Irie J, Mitsuishi M, Uchino Y, Nakaya H, Takemura R, et al. Safety and efficacy of long-term nicotinamide mononucleotide supplementation on metabolism, sleep, and nicotinamide adenine dinucleotide biosynthesis in healthy, middle-aged Japanese men. Japan Endocrine Society; 2024. https://doi.org/10.1507/endocrj.ej23-0431
A woman receiving her D-dimer test results at a clinic

D-Dimer Test: Normal Levels and What Your Results Mean

D-dimer is a protein fragment that shows up when your body is breaking down fibrin (the scaffolding that forms clots). That means elevated levels can signal everything from a life-threatening pulmonary embolism to routine post-surgical healing.

The test works best as a “rule-out” tool. A negative result means you almost certainly don’t have a dangerous clot forming. A positive result? That’s where things get tricky.

What You Should Know

  • D-dimer measures breakdown products from blood clots, not the clots themselves
  • Normal levels are typically under 0.50 mg/L, but this changes with age
  • Negative results reliably exclude blood clots in low-risk patients
  • Elevated levels have many causes beyond clotting, from pregnancy to cancer

What is D-Dimer?

When you cut yourself, your body springs into action. Blood cells called platelets rush to the site. A protein called fibrinogen converts into fibrin, which forms a mesh to trap blood cells and seal the wound.

D-dimer gets its name because it contains two D fragments of the fibrin protein joined by a cross-link. You can think of it as the leftover debris after your body cleans up a clot.

The measurement tells doctors about ongoing coagulation (blood clotting) and fibrinolysis (clot breakdown). When blood vessels are injured, thrombin (a clotting enzyme) triggers a cascade that creates fibrin nets to stabilize clots. Factor XIII, activated by thrombin, binds these units together.

Your body naturally breaks down these clots through a process called fibrinolysis. That’s when D-dimer fragments enter your bloodstream where they can be measured.

CLIA-Certified Longevity Testing

Measure D-dimer with 27 other key biomarkers.

Jinfiniti AgingSOS green gradient background

When Do Doctors Order a D-Dimer Test?

Your doctor might order D-dimer testing if you show symptoms that could indicate dangerous clotting or other serious conditions. Here are the most common situations:

Suspected Blood Clots

  • Leg swelling, pain, warmth, or skin color changes (deep vein thrombosis)
  • Sudden chest pain, trouble breathing, or rapid heartbeat (pulmonary embolism)
  • Research confirms D-dimer reliably rules out clots when combined with clinical assessment[1]
  • A negative result with low suspicion means no further testing needed

Life-Threatening Clotting Disorder (DIC)

  • Disseminated intravascular coagulation causes abnormal clotting throughout your body[2]
  • Markedly elevated D-dimer appears in diagnostic scoring systems
  • Normal D-dimer essentially rules out this emergency condition

COVID-19 Severity Assessment

  • Elevated D-dimer predicts worse outcomes in hospitalized COVID-19 patients[3]
  • Levels rise from 0.26-0.30 mg/L in mild cases to 2.66 mg/L in critical cases
  • About 76% of patients with high D-dimer developed critical illness

Heart and Blood Vessel Emergencies

  • Suspected aortic dissection (tear in your main artery)
  • A negative test within 24 hours makes aortic dissection highly unlikely[4]
  • Helps doctors decide if you need emergency imaging

Understand Your D-Dimer Test Results

Your D-dimer level appears as a number on your lab report, but interpreting that number requires understanding normal ranges, age adjustments, and what different elevations mean.

Normal D-Dimer Levels

The standard threshold for normal D-dimer sits at 0.50 mg/L when measured in fibrinogen equivalent units (FEU). Laboratory sources report that levels under 250 ng/mL in D-dimer units (DDU) or under 0.50 mcg/mL FEU are normal.

The conversion is straightforward: one FEU equals approximately twice one DDU. For example, 0.5 µg/mL FEU equals 0.25 µg/mL DDU. About 70% of labs use the FEU method.

A reading of 0.50 or higher suggests the presence of clots or increased clot breakdown. But there’s a catch: many conditions raise D-dimer without any clotting disorder.

Age-Adjusted Thresholds

Standard cutoff values don’t work well for everyone. Research shows that using an age-adjusted D-dimer for evaluating acute pulmonary embolism has been validated and recommended by major medical societies[5].

The commonly used formula: your age multiplied by 10 ng/mL for patients over 50. A 70-year-old would have a threshold of 700 ng/mL instead of the standard 500 ng/mL.

A meta-analysis found that age-adjustment maintained sensitivity at 0.97 (comparable to the standard cutoff) while improving specificity. This means fewer false positives and fewer unnecessary imaging tests in older adults[6].

What Different Levels Indicate

Interpretation depends on how far above normal your results fall:

Slightly elevated (500-1000 ng/mL)

  • Mild infections
  • Early pregnancy
  • Small clots
  • Recent surgery
  • Normal recovery processes

Moderately elevated (1000-5000 ng/mL)

  • More serious conditions requiring investigation
  • Active clotting disorders
  • Larger clot formations

Markedly elevated (>5000 ng/mL)

  • DIC
  • Major thrombosis
  • Severe infections
  • Advanced cancer

Research on surgical patients found that D-dimer levels of 2 μg/mL had high sensitivity for DVT, though the highest level achieving 100% sensitivity was 1.4 μg/mL[7].

How the Blood Test Works

The D-dimer test is straightforward: a healthcare provider draws blood from your arm, just like any routine blood test. No fasting or special preparation required.

The sample goes to a lab where technicians use antibody-based methods to measure D-dimer levels. Most labs use ELISA testing, which is highly accurate[8].

You’ll typically get results within hours to a day. Some emergency departments have point-of-care tests that deliver results in 14 minutes, helping doctors make faster decisions about your care.

The test itself is simple. The interpretation is where things get complex.

🧬 MORE BIOMARKER TESTING

Test Accuracy: What the Numbers Really Tell You

Understanding D-dimer accuracy means knowing why negative results are so reliable and why positive results require further investigation.

Why Negative Results Matter Most

D-dimer is really goodat ruling out blood clots, not as much at confirming them. The high negative predictive value means studies following patients after a negative D-dimer for 3 months proved the test’s reliability[9].

In elderly populations, research showed that the negative predictive values of D-dimer combined with clinical scoring were 100% in ruling out pulmonary embolism[10].

The American Academy of Family Physicians confirms that a negative D-dimer result with low pretest probability suffices to rule out VTE. No further workup is needed[11].

The False Positive Problem

While negative results reliably exclude clots, positive results need careful interpretation. The test has high sensitivity but low specificity in diagnosing acute VTE[12].

This means frequent “false positive” results. A positive D-dimer may indicate the presence of abnormally high fibrin degradation products but doesn’t tell you the location or cause.

A comprehensive study identified multiple predictive factors for D-dimer positivity including female sex, increasing age, black race, immobility, hemoptysis, active malignancy, rheumatoid arthritis, lupus, sickle cell disease, pregnancy, and surgery[13].

The Cleveland Clinic emphasizes that elevated results should be combined with other diagnostic parameters rather than used alone.

What Else Raises D-Dimer Besides Clots?

A 3D image of a blood clot

Many factors elevate D-dimer levels without any dangerous blood clots present, making interpretation complex but important.

Age and Natural Changes

Your D-dimer levels increase naturally as you age. Research shows older age is highly associated with positive D-dimer, with an adjusted relative risk of 1.19 per 10 years after age 30[13].

This happens because aging affects your coagulation system. Inflammatory markers like C-reactive protein levels also rise with age, contributing to a prothrombotic state (increased clotting tendency).

Pregnancy Considerations

Pregnancy presents unique challenges for D-dimer interpretation. The conventional threshold of 0.5 mg/L has limited value in pregnant women because D-dimer increases with gestational age[14].

Research found that by weeks 13-20, more than 25% of pregnant women had D-dimer levels at or above 0.5 mg/L. By weeks 36-42, practically all pregnant women exceeded this threshold[15].

Mean D-dimer levels by trimester:

  • Early pregnancy: 0.56 mg/L
  • Mid-pregnancy: 1.08 mg/L
  • Late pregnancy: 1.48 mg/L
  • End of pregnancy: 1.89 mg/L

Studies conclude that a gestational age-specific reference interval is required, and even then values should be interpreted cautiously.

Recent Surgery or Hospital Stays

Surgery and hospitalization dramatically affect D-dimer levels. Research on hospitalized patients found that D-dimer testing has limited clinical utility in unselected inpatients because of poor specificity[16].

Specificity decreased with:

  • Increasing duration of hospitalization
  • Increasing age
  • Elevated C-reactive protein levels

One study found that 19 patients (42%) with thrombosis had false-negative D-dimer tests by at least one assay method[16].

Cancer and Chronic Illness

Multiple conditions elevate D-dimer without active clotting. Clinical reviews note that D-dimer may be high due to physiologic conditions like aging and strenuous physical activity, plus disorders ranging from infections to cancers[17].

Dr. Jin-Xiong She, founder of Jinfiniti Precision Medicine, notes: “Understanding your baseline biomarkers, including inflammatory and coagulation markers, allows you to track changes over time and intervene before problems escalate. This is the foundation of our Test, Act, Optimize philosophy.”

Predictive factors for elevated D-dimer include:

  • Active malignancy
  • Rheumatoid arthritis
  • Systemic lupus
  • Sickle cell disease
  • Chronic kidney disease requiring hemodialysis
  • Recent orthopedic, chest, or abdominal surgery

D-Dimer and Clinical Decision Rules

Doctors don’t interpret D-dimer results in isolation. They combine the test with clinical scoring systems to make better diagnostic decisions.

The Wells Score

The Wells score helps doctors assess your pre-test probability of having a blood clot. This validated prediction rule includes factors like previous PE or DVT, rapid heart rate, recent surgery or immobilization, hemoptysis, active cancer, and clinical signs of DVT[9].

When combined with D-dimer, the negative predictive values of Wells score ≤4 plus normal D-dimer were 100% in both elderly and non-elderly patients[10].

Clinical guidelines are clear: with high PE pre-test probability (Wells score > 4.5), there’s no role for ordering D-dimer because clinical likelihood of PE remains high regardless of the result[18].

The American Academy of Family Physicians recommends that patients in the low-risk category (Wells score <2) with a concurrent negative D-dimer can be effectively ruled out from having DVT. High-risk patients should advance straight to imaging.

How Doctors Combine Test Results

Clinical decision rules work in conjunction with imaging studies. Imaging is required when a clinical decision rule indicates PE is likely or an elevated D-dimer test appears[19].

The diagnostic process follows a sequence: D-dimer test, followed by imaging tests including CT pulmonary angiography (CTPA) or ventilation-perfusion (V/Q) scintigraphy if needed.

Compression ultrasonography should be the initial test for patients with intermediate to high pretest probability of DVT in lower extremities. Its sensitivity for suspected PE is limited to 23-29%[11].

D-Dimer as a Cancer Biomarker

Research has established connections between D-dimer levels and malignancy. A literature review concluded that research established a direct link between plasma D-dimer and underlying malignancy, with strong associations for detection and prognosis of several cancers[20].

A large cohort study reported that high D-dimer levels are associated with poor prognosis in the general cancer population. The poor prognosis was independent of metastases, suggesting D-dimer might be a clinically important prognostic marker[21].

The relationship involves multiple mechanisms. Systemic activation of hemostasis and thrombosis has been implicated in tumor progression and metastasis. Specific thrombin inhibitors significantly limit metastasis, confirming that tumor progression and hypercoagulability are mutually reinforcing[22].

Cancer-Specific Applications

  • Lung Cancer: Meta-analysis enrolling 8,452 patients found that overall survival and progression-free survival in the high D-dimer group were significantly lower than those in the low D-dimer group. High plasma D-dimer level leads to lower survival[23].
  • Gastric Cancer: Research showed that D-dimer can serve as a prognostic and predictive biomarker for metastatic gastric cancer treated by chemotherapy[24]. Cox multivariate analysis indicated D-dimer level was an independent risk factor for survival[25].
  • Colorectal Cancer: A 2024 study assessed D-dimer’s diagnostic efficacy for distant metastasis in colorectal cancer[26]. Previous studies showed plasma D-dimer levels correlate with tumor markers like carcinoembryonic antigen.

Important Limitations to Understand

D-dimer testing faces several key limitations you should know about:

  • Assay Variability Different D-dimer tests can produce varying results. Several distributors use different methods resulting in two distinct reference intervals reported in DDUs and FEUs. Clinicians should be aware of their specific test’s performance characteristics.
  • Hospital Setting Challenges In unselected inpatients, D-dimer testing has limited clinical utility because of poor specificity[16]. This is particularly true for older patients, those with prolonged hospitalization, and those with markedly elevated inflammatory markers like cytokines.
  • Not a Standalone Test A positive D-dimer alone doesn’t confirm any particular illness. You need to combine D-dimer results with other diagnostic parameters including clinical assessment, imaging studies, and additional biomarkers.
  • Standardization Needs The International Society on Thrombosis and Hemostasis notes that consistent reporting of D-dimer tests will be welcomed by clinicians and research units[27]. Efforts continue to improve uniformity of different detection systems.

The key takeaway: D-dimer is a powerful tool when used appropriately. A negative result in a low-risk patient reliably rules out dangerous clots. A positive result requires clinical context, additional testing, and sometimes imaging to determine the cause.

Understanding your D-dimer results means recognizing both what the test can tell you and what it can’t. It’s one piece of your health puzzle, best interpreted alongside other biomarkers like homocysteine and apolipoprotein B for a complete cardiovascular risk assessment.

Referenced Sources

  1. Wauthier L, Favresse J, Hardy M, Douxfils J, Le Gal G, Roy PM, et al. D-dimer Testing in Pulmonary Embolism with a Focus on Potential Pitfalls: A Narrative Review. MDPI AG; 2022. https://doi.org/10.3390/diagnostics12112770
  2. Costello R, Nehring S. Disseminated Intravascular Coagulation (DIC). 2019.
  3. Auditeau C, Khider L, Planquette B, Sanchez O, Smadja DM, Gendron N. D-dimer testing in clinical practice in the era of COVID-19. Elsevier BV; 2022. https://doi.org/10.1002/rth2.12730
  4. Suzuki T, Distante A, Zizza A, Trimarchi S, Villani M, Salerno Uriarte JA, et al. Diagnosis of Acute Aortic Dissection by D-Dimer. Ovid Technologies (Wolters Kluwer Health); 2009. https://doi.org/10.1161/circulationaha.108.833004
  5. Parks C, Bounds R, Davis B, Caplan R, Laughery T, Zeserson E. Investigation of age-adjusted D-dimer using an uncommon assay. Elsevier BV; 2019. https://doi.org/10.1016/j.ajem.2018.09.035
  6. Gerber JL, Messmer AS, Krebs T, Müller M, Hofer DM, Pfortmueller CA. Utility and limitations of patient-adjusted D-dimer cut-off levels for diagnosis of venous thromboembolism – A systematic review and meta-analysis. Wiley; 2023. https://doi.org/10.1111/joim.13650
  7. Kitamura F, Shiraishi Y, Sakata K, Takata N, Harada K, Yoshinaka I, et al. Screening for Deep Vein Thrombosis Using D-dimer Levels Based on Surgical Patients’ Characteristics. Springer Science and Business Media LLC; 2024. https://doi.org/10.7759/cureus.75565
  8. Riley RS, Gilbert AR, Dalton JB, Pai S, McPherson RA. Widely Used Types and Clinical Applications of D-Dimer Assay. Oxford University Press (OUP); 2016. https://doi.org/10.1093/labmed/lmw001
  9. Guo DJ, Zhao C, Zou YD, Huang XH, Hu JM, Guo L. Values of the Wells and Revised Geneva Scores Combined with D-dimer in Diagnosing Elderly Pulmonary Embolism Patients. Ovid Technologies (Wolters Kluwer Health); 2015. https://doi.org/10.4103/0366-6999.155085
  10. Zhao Y, Cheng Y, Wang H, Du H, Sun J, Xu M, et al. The Legend score synthesizes Wells, PERC, Geneva, D-dimer and predicts acute pulmonary embolism prior to imaging tests. Informa UK Limited; 2024. https://doi.org/10.1016/j.pulmoe.2023.10.002
  11. Wilbur J, Shian B. Diagnosis of deep venous thrombosis and pulmonary embolism. American Family Physician. 2012;86(10):913–9.
  12. Siragusa S. D-dimer testing: advantages and limitations in emergency medicine for managing acute venous thromboembolism. Springer Science and Business Media LLC; 2006. https://doi.org/10.1007/bf02934724
  13. Kabrhel C, Mark Courtney D, Camargo CA, Plewa MC, Nordenholz KE, Moore CL, et al. Factors Associated With Positive D-dimer Results in Patients Evaluated for Pulmonary Embolism. Wiley; 2010. https://doi.org/10.1111/j.1553-2712.2010.00765.x
  14. Hedengran KK, Andersen MR, Stender S, Szecsi PB. Large D-Dimer Fluctuation in Normal Pregnancy: A Longitudinal Cohort Study of 4,117 Samples from 714 Healthy Danish Women. Hindawi Limited; 2016. https://doi.org/10.1155/2016/3561675
  15. Wang W, Dai Q, Pan L, Zhang H, Wang Y. Reference Levels of Plasma D-dimer for Normal Pregnant and Their Association with Pregnancy Complications: A Single-center Retrospective Analysis. IMR Press; 2024. https://doi.org/10.31083/j.ceog5111256
  16. Brotman DJ, Segal JB, Jani JT, Petty BG, Kickler TS. Limitations of D-dimer testing in unselected inpatients with suspected venous thromboembolism. Elsevier BV; 2003. https://doi.org/10.1016/s0002-9343(02)01520-6
  17. Franchini M, Focosi D, Pezzo MP, Mannucci PM. How we manage a high D-dimer. Ferrata Storti Foundation (Haematologica); 2023. https://doi.org/10.3324/haematol.2023.283966
  18. Perelas A, Kirincich J, Yadav R, Ennala S, Wang X, Sadana D, et al. Diagnostic Yield, Radiation Exposure, and the Role of Clinical Decision Rules to Limit Computed Tomographic Pulmonary Angiography–Associated Complications. Ovid Technologies (Wolters Kluwer Health); 2023. https://doi.org/10.1097/pts.0000000000001167
  19. Mos I, Klok F, Kroft L, de Roos A, Huisman M. Imaging Tests in the Diagnosis of Pulmonary Embolism. Georg Thieme Verlag KG; 2012. https://doi.org/10.1055/s-0032-1311792
  20. Siddiqui NA, Malik M, Wijeratne Fernando R, Sreekantan Nair A, Illango J, Gor R, et al. D-Dimer: A Potential Solution to Problems of Cancer Screening, Surveillance, and Prognosis Assessment. Springer Science and Business Media LLC; 2021. https://doi.org/10.7759/cureus.15064
  21. Ay C, Dunkler D, Pirker R, Thaler J, Quehenberger P, Wagner O, et al. High D-dimer levels are associated with poor prognosis in cancer patients. Ferrata Storti Foundation (Haematologica); 2012. https://doi.org/10.3324/haematol.2011.054718
  22. Zhang X, Wang X, Li W, Sun T, Dang C, Diao D. D-dimer, a predictor of bad outcome in gastric cancer patients undergoing radical resection. Springer Science and Business Media LLC; 2022. https://doi.org/10.1038/s41598-022-16582-9
  23. Ma M, Cao R, Wang W, Wang B, Yang Y, Huang Y, et al. The D-dimer level predicts the prognosis in patients with lung cancer: a systematic review and meta-analysis. Springer Science and Business Media LLC; 2021. https://doi.org/10.1186/s13019-021-01618-4
  24. Go SI, Lee MJ, Lee WS, Choi HJ, Lee US, Kim RB, et al. D-Dimer Can Serve as a Prognostic and Predictive Biomarker for Metastatic Gastric Cancer Treated by Chemotherapy. Ovid Technologies (Wolters Kluwer Health); 2015. https://doi.org/10.1097/md.0000000000000951
  25. Zhang X, Wang W, Tian B, Wang Y, Jing J. The Relationship Between D-dimer and Prognosis in the Patients with Serum Alpha-Fetoprotein-Positive Gastric Cancer: A Retrospective Cohort Study. SAGE Publications; 2022. https://doi.org/10.1177/11795549221120158
  26. Zhang X, Li W, Wang X, Lin J, Dang C, Diao D. Effectiveness of D-dimer in predicting distant metastasis in colorectal cancer. Public Library of Science (PLoS); 2024. https://doi.org/10.1371/journal.pone.0306909
  27. Zhang L, Zhang Z. Standardization of D-dimer reporting in the COVID-19 era. Elsevier BV; 2022. https://doi.org/10.1002/rth2.12772
Turmeric and Erectile Dysfunction

Turmeric and Erectile Dysfunction: A Look at the Science

If you’re researching turmeric for erectile dysfunction, you’ve probably seen some promising claims. Maybe you’re hoping to skip the prescription medications and their side effects. Or maybe you’re already taking ED drugs and looking for something that addresses the root cause instead of just treating symptoms.

That’s not an unreasonable hope. Turmeric has legitimate science backing its cardiovascular benefits. But when it comes to erectile function specifically, the picture gets more complicated.

Turmeric doesn’t work like Viagra or Cialis. You can’t take it an hour before sex and expect results. What it does do is repair damaged blood vessels over time, which could improve erectile function if vascular problems are your issue.

But (and this is the part most articles skip) there’s a potential hormonal downside that could make things worse for some men.

What You Should Know

  • Turmeric improves blood vessel function by increasing nitric oxide, the same chemical pathway that prescription ED drugs use
  • No direct human trials prove that turmeric treats ED, but vascular studies show promising indirect benefits
  • There is a potential DHT-lowering effect, though human evidence is lacking
  • Combining turmeric with ginger may provide better results than using turmeric alone

Can Turmeric Help With Male Sexual Health?

The honest answer on whether turmeric can help with ED is: maybe, but it depends entirely on what’s causing your erectile issues in the first place.

ED isn’t one problem with one cause. You could be dealing with:

  • Damaged or stiff arteries (the most common culprit after 40)
  • Psychological factors like stress, anxiety, or relationship issues
  • Hormonal imbalances (low testosterone, thyroid problems)
  • Medication side effects (blood pressure meds, antidepressants)
  • Nerve damage from diabetes or surgery
  • A combination of several of these

Turmeric works primarily on that first category: vascular problems. If your arteries are damaged, inflamed, or just not functioning the way they did when you were younger, turmeric’s effects on blood vessel health could potentially help. But we’re talking weeks to months, not minutes to hours.

The active compound doing the heavy lifting is curcumin. It increases nitric oxide availability in your blood vessels[1]

Prescription drugs like Viagra block an enzyme called PDE5, which normally breaks down a molecule called cGMP. Think of cGMP as the “relax and let blood flow” signal[2].

Turmeric works much earlier in the chain. It reduces the oxidative stress that destroys nitric oxide before it can even start the cascade. Different mechanism, much slower timeline.

Think of it like this: your garden hose has kinks, cracks, and buildup inside. Viagra cranks up the water pressure to force water through the damaged hose. Turmeric slowly repairs the hose itself.

One approach works immediately but doesn’t fix anything long-term. The other takes consistent use over weeks or months but could provide lasting improvement by addressing the underlying damage.

The catch? If your ED isn’t primarily vascular (psychological causes, nerve damage, hormonal issues), turmeric may not move the needle as much.

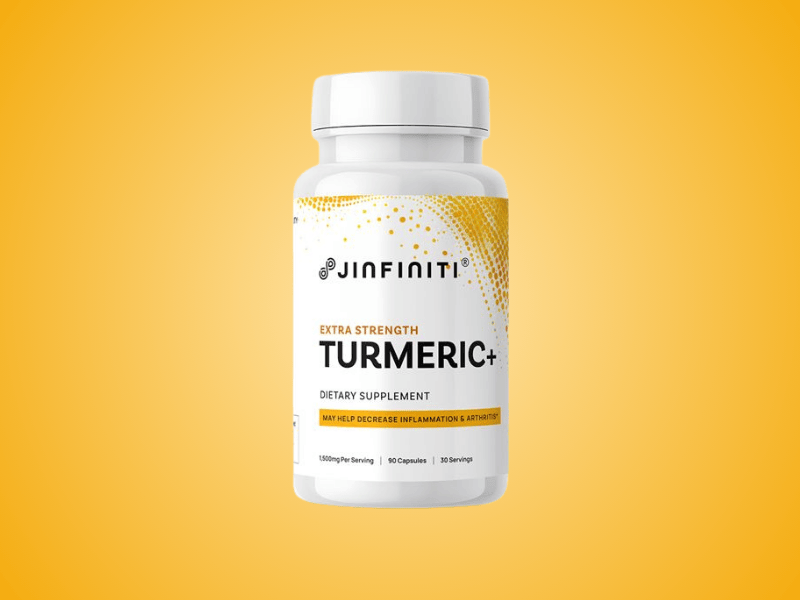
Vascular Support Formula

Extra strength Turmeric + Ginger for better blood flow.

Jinfiniti Turmeric Supplement

What the Research Actually Shows

Let’s be honest about the evidence. There are no clinical trials where men with ED took turmeric and measured whether their erections improved.

The closest we have are indirect hints from vascular studies in humans and a collection of animal studies that suggest we should look further in that direction.

Vascular Function Studies

The strongest human evidence comes from cardiovascular research, not sexual health studies directly.

A 2017 study published in the journal Aging tested the effects of curcumin supplementation in middle-aged and older adults. In this 12-week trial, the men took 2,000mg per day of Longvida curcumin extract[1].

After 12 weeks, the treatment group’s resistance artery endothelial function was restored to the level of healthy young control subjects.

The researchers measured something called flow-mediated dilation in resistance arteries. This is a measure of how well a person’s blood vessels can dilate or widen in response to increased blood flow. When they can’t relax and expand efficiently, blood flow to the penis suffers.

The mechanism was clear: curcumin increased nitric oxide bioavailability by reducing vascular oxidative stress. Oxidative stress is like rust building up in your pipes. It damages the inner lining of blood vessels and destroys nitric oxide before it can signal blood vessels to relax.

Another human trial using curcumin nanomicelles found improvements in sperm count, motility, and sexual hormone profiles in infertile men. The researchers didn’t measure erectile function directly, but the fertility improvements suggest better reproductive health overall[3].

Animal Studies on Erectile Tissue

Research in diabetic rats provides more direct evidence for erectile function, though we can’t assume the same results translate perfectly to humans.

Diabetic rats given curcumin showed improved intracavernosal pressure, which is basically a measure of erection strength. The treatment also reduced fibrosis (scarring) in penile tissue[4].

The protective mechanism involved activation of the Nrf2/HO-1 pathway. This cellular defense system protects penile tissue from oxidative damage and a type of cell death called ferroptosis[5].

Rats with nerve damage to the penis (similar to what happens after prostate surgery in humans) showed improved erectile function after curcumin treatment. The compound seemed to help nerves regenerate[6].

The Evidence Gap

The jump from “improves blood vessel function” to “cures ED” requires assumptions we can’t fully support yet.

Healthy blood vessels are necessary for erections, but they’re not always sufficient. ED can stem from psychological factors, hormonal imbalances, medication side effects, or nerve damage. Turmeric addresses the vascular component, but that’s only part of the picture for many men.

We need human clinical trials specifically testing turmeric supplementation in men with diagnosed ED, measuring actual erectile function outcomes. Until those studies exist, we’re extrapolating from related research.

The DHT Problem Most Articles Won’t Tell You About

Now things get interesting. And potentially problematic for some men.

Turmeric contains compounds that may inhibit an enzyme called 5-alpha reductase. This enzyme converts testosterone into DHT (dihydrotestosterone), a more potent androgen.

Curcumin and 5-Alpha Reductase Inhibition

DHT is the hormone responsible for several things men care about: libido, mental drive, that feeling of vitality and motivation.

Some studies suggest curcumin can reduce DHT levels[7]. This is why researchers are studying it for prostate cancer, where lowering androgens can slow tumor growth.

Dr. Kyle Gillett, a dual board-certified physician, discussed this concern on the Huberman Lab podcast.

The Libido Paradox

This creates a paradox: turmeric might improve your blood flow while simultaneously reducing your desire to use it.

But you need to know this: Human studies specifically measuring DHT changes from turmeric supplementation don’t exist. The theoretical concern comes from animal studies and isolated cell research.

This means we’re talking about a possibility, not a proven effect. Many men take turmeric supplements without any libido issues whatsoever.

If you’re already dealing with low testosterone or low DHT, you might want to start with a lower dose and see how you feel. But for most men, the vascular health benefits likely outweigh any theoretical hormonal concerns.

🧬 MORE TURMERIC INSIGHTS

Ginger and Turmeric: A Spicier Combination?

Ginger has compounds that act in different ways than turmeric does, so this combination is especially intriguing. The research on ginger and male sexual health is actually pretty good.

How Ginger Supports Erectile Function

Studies on Zingiber officinale (common ginger) show it reduces oxidative stress in penile tissue and protects the testis from damage caused by high blood sugar. Like turmeric, it helps preserve nitric oxide availability.

But ginger does something turmeric doesn’t: it directly supports testosterone production.

A randomized trial showed that ginger supplementation improved sperm count, motility, and DNA integrity in men. The researchers found it protected Leydig cells, which are the cells in your testicles that produce testosterone[8].

The Combination Approach

Combining turmeric and ginger gives you coverage from multiple angles:

  • Turmeric handles vascular health and inflammation reduction
  • Ginger protects testosterone-producing cells and supports hormone balance
  • Both reduce oxidative stress and improve nitric oxide availability

This combination addresses both the plumbing (blood flow) and the hormonal drive that makes you want to use that plumbing.

Our Extra Strength Turmeric+ contains both turmeric and ginger along with other complementary ingredients like Boswellia and quercetin. The formula includes black pepper extract, which increases absorption by 2,000%.

How to Take Turmeric for Erectile Dysfunction

Raw turmeric powder is about 1% bioavailable. Your body simply can’t absorb it efficiently.

You could eat a tablespoon of turmeric with every meal and get less benefit than a single high-quality supplement capsule.

The studies showing vascular benefits used specially formulated curcumin:

  • Longvida: Lipid-bound particles that cross cell membranes easily
  • Nanomicelles: Microscopic droplets that dissolve in water
  • Piperine combinations: Black pepper extract that inhibits curcumin breakdown

Without one of these absorption enhancers, you’re mostly just creating expensive yellow urine.

A quality turmeric supplement should contain:

  • At least 1,000mg of turmeric extract standardized to 95% curcuminoids
  • Black pepper extract (piperine) or another absorption enhancer
  • Complementary anti-inflammatory compounds like ginger or Boswellia
  • Third-party testing for purity and potency

The cheapest turmeric supplement is a waste of money if your body can’t absorb it. You’re better off spending more on a product that actually delivers the compounds to your bloodstream.

Safety and Drug Interactions

Turmeric has an excellent safety profile for most people. But it’s not risk-free, especially if you’re taking certain medications.

The biggest concern is bleeding risk. Turmeric has antiplatelet properties similar to aspirin. If you’re taking blood thinners like Warfarin, Plavix, or aspirin, adding turmeric can increase bleeding risk to dangerous levels[9].

Talk to your doctor before combining turmeric with:

  • Any anticoagulant or antiplatelet medication
  • NSAIDs like ibuprofen (which also increase bleeding risk)
  • Diabetes medications (turmeric can lower blood sugar)

There’s also a theoretical interaction with PDE5 inhibitors like Viagra or Cialis. Some research suggests curcumin might enhance the effects of these drugs, which could be good or bad depending on the dose[10].

Start with lower doses if you’re taking prescription ED medications, and monitor how you respond.

The Bottom Line on Turmeric for ED

Turmeric isn’t a quick fix for erectile dysfunction. It’s a long-term investment in vascular health.

If your ED is due to damaged blood vessels (which it often does, especially in men over 40), turmeric’s ability to reduce oxidative stress and improve nitric oxide availability could help. The research on vascular function is solid.

But it works slowly, over weeks to months. And it works best as part of a broader strategy that includes exercise, stress management, and addressing any underlying health issues like diabetes or high blood pressure.

The DHT concern is real in theory but unproven in humans. Most men won’t experience any libido issues. If you do feel flat or low-energy after starting turmeric, try reducing your dose or cycling it rather than taking it daily.

Combining turmeric with ginger gives you a more complete approach to male sexual health. You get the vascular benefits of turmeric plus the testosterone-protective effects of ginger.

Just make sure you’re taking a bioavailable form. Otherwise, you’re just adding flavor to your food with no therapeutic benefit.

Frequently Asked Questions

How much turmeric should I take for erectile dysfunction?

The human studies showing vascular improvements used 2,000mg daily dosage of turmeric. Raw turmeric powder won’t get you there because your body barely absorbs it. Look for supplements with black pepper extract (piperine) or specialized delivery systems like Longvida or nanomicelles. Start with 1,000mg daily and increase if needed.

How long does it take to see results?

If it’s going to help, expect 8-12 weeks minimum. The vascular studies showed measurable improvements at 12 weeks. This isn’t an acute fix. You’re repairing blood vessel damage, not triggering an immediate response.

Can I take turmeric with Viagra or Cialis?

Possibly, but talk to your doctor first. Some research suggests curcumin might enhance the effects of PDE5 inhibitors. That could be good or problematic depending on your cardiovascular health and dose. Don’t experiment with this combination on your own.

Is turmeric safe for daily use?

For most people, yes. The main concern is bleeding risk if you’re on blood thinners (Warfarin, Plavix, aspirin). Turmeric has antiplatelet properties similar to aspirin. High doses can also cause digestive upset in some people. If you’re on any medications, check with your doctor.

Should I eat turmeric or take a supplement?

Supplements, hands down. You’d need to eat unrealistic amounts of turmeric powder to match the doses used in research. Plus, raw turmeric is about 1% bioavailable. Save the powder for your cooking. For therapeutic effects, use a properly formulated supplement with absorption enhancers.

Will turmeric lower my testosterone?

The DHT concern is real in theory but unproven in human studies. Most men don’t experience libido issues from turmeric. If you feel flat or low-energy after starting supplementation, try reducing your dose or cycling it (5 days on, 2 days off). If you already know you have low DHT, start cautiously.

Referenced Sources

  1. Santos-Parker JR, Strahler TR, Bassett CJ, Bispham NZ, Chonchol MB, Seals DR. Curcumin supplementation improves vascular endothelial function in healthy middle-aged and older adults by increasing nitric oxide bioavailability and reducing oxidative stress. Impact Journals, LLC; 2017. https://doi.org/10.18632/aging.101149
  2. Sandberg M, Natarajan V. Phosphodiesterase 5 – the enzyme inhibited by sildenafil (Viagra). Tidsskrift for Den Norske Laegeforening. 1999;119(7):945–9.
  3. Alizadeh F, Javadi M, Karami AA, Gholaminejad F, Kavianpour M, Haghighian HK. Curcumin nanomicelle improves semen parameters, oxidative stress, inflammatory biomarkers, and reproductive hormones in infertile men: A randomized clinical trial. Wiley; 2017. https://doi.org/10.1002/ptr.5998
  4. Draganski A, Tar MT, Villegas G, Friedman JM, Davies KP. Topically Applied Curcumin-Loaded Nanoparticles Treat Erectile Dysfunction in a Rat Model of Type-2 Diabetes. Oxford University Press (OUP); 2018. https://doi.org/10.1016/j.jsxm.2018.03.009
  5. Jiang Y, Xing S, Ni D, Yang B, Kai J, Wang T, et al. Curcumin Attenuates Ferroptosis and Ameliorates Erectile Function in Diabetic Rats by Activating Nrf2/HO‐1 Pathway. Wiley; 2023. https://doi.org/10.1155/2023/7236816
  6. Yang L, Ren Z, Liu Z, Peng Z, Song P, Zhou J, et al. Curcumin slow‐release membrane promotes erectile function and penile rehabilitation in a rat model of cavernous nerve injury. Wiley; 2022. https://doi.org/10.1002/term.3334
  7. Ide H, Lu Y, Noguchi T, Muto S, Okada H, Kawato S, et al. Modulation of AKR1C2 by curcumin decreases testosterone production in prostate cancer. Wiley; 2018. https://doi.org/10.1111/cas.13517
  8. Hosseini J, Mardi Mamaghani A, Hosseinifar H, et al. The influence of ginger (Zingiber officinale) on human sperm quality and DNA fragmentation: A double-blind randomized clinical trial. Knowledge E DMCC; 2016. https://doi.org/10.29252/ijrm.14.8.533
  9. Talasaz AH, McGonagle B, HajiQasemi M, Ghelichkhan ZA, Sadeghipour P, Rashedi S, et al. Pharmacokinetic and Pharmacodynamic Interactions between Food or Herbal Products and Oral Anticoagulants: Evidence Review, Practical Recommendations, and Knowledge Gaps. Georg Thieme Verlag KG; 2024. https://doi.org/10.1055/s-0044-1790258
  10. Roberts JL, Poklepovic A, Booth L. Curcumin interacts with sildenafil to kill GI tumor cells via endoplasmic reticulum stress and reactive oxygen/nitrogen species. Impact Journals, LLC; 2017. https://doi.org/10.18632/oncotarget.19807
A doctor examines her patient's vitamin B3 test results.

Vitamin B3 Test: Measuring Niacin Metabolites and Ranges

You asked your doctor for a blood test for Vitamin B3. Finally, you thought, some answers as to why you were feeling so out of energy

The issue: blood tests for niacin (vitamin B3) can miss the mark. Levels can change dramatically based on what you ate for breakfast that morning. This is why they are the least reliable marker for assessing your nutritional status.

Want to know what your Vitamin B3 status is really saying about your health? Learn which test to request and what the numbers mean.

What You Should Know

  • Vitamin B3 blood tests measure current levels but miss long-term nutritional status
  • Urine metabolite tests give the most accurate picture of your B3 stores
  • Testing makes sense only for specific symptoms or high-dose supplementation
  • Your NAD+ levels matter more than isolated niacin measurements for cellular health

What Does a Vitamin B3 Test Measure?

Testing for Vitamin B3 isn’t as straightforward as checking cholesterol or blood sugar. You’re actually measuring different forms and breakdown products that tell different stories about your health.

The main challenge? Your body processes niacin so quickly that a snapshot measurement rarely tells the full story.

Blood Testing Methods

Blood tests look for two forms of B3 in your plasma or serum: nicotinic acid (the form that causes flushing) and nicotinamide (the non-flushing form).

These tests work well for one thing: catching toxicity in people taking high-dose niacin therapy for cholesterol. A cardiologist might use them to check if your therapeutic dose is pushing into dangerous territory.

But for everyday nutritional status? They’re nearly useless. According to the National Institutes of Health, “levels of niacin in the blood are not reliable indicators of niacin status.”

Your blood niacin levels jump after eating anything with B3 or after taking niacin supplements. Two hours later, they’ve dropped again.

Urine Metabolite Analysis (The Gold Standard)

Your body breaks down niacin into specific compounds that end up in your urine. These metabolites paint a much clearer picture than blood tests ever could.

Labs look for two key metabolites:

  • N1-methylnicotinamide (NMN): Not to be confused with the NAD+ precursor, this methylated form shows how much niacin your body processed recently.
  • 2-pyridone (2-Pyr): Another breakdown product that, when measured alongside NMN, reveals your true niacin stores.

Why does urine work better? Your kidneys excrete these metabolites consistently over 24 hours, smoothing out the spikes and drops you see in blood. Low levels of both metabolites directly signal depleted body stores.

Research published in the Journal of Nutrition confirms that urinary metabolites are “the most sensitive and reliable measure of niacin status[1].”

You’ll need either a 24-hour urine collection (the gold standard) or a spot urine test with creatinine correction. The 24-hour test gives the most accurate reading but requires you to collect every drop of urine for a full day.

CLIA-Certified NAD Test Kit

Test your NAD+ levels from home.

Jinfiniti Intracellular NAD Test on purple background

Normal Vitamin B3 Reference Ranges

Lab ranges vary depending on the testing method and laboratory, so always check your specific lab report first. These are typical ranges you’ll encounter.

Blood Test Ranges

AnalyteNormal RangeWhat High Levels Mean
Nicotinic Acid< 5.0 – 20 ng/mLTaking supplements or therapeutic doses
Nicotinamide5.0 – 48.0 ng/mLRecent niacin intake
Therapeutic LevelsCan exceed 1,000 ng/mLUsed for cholesterol management

Source: Mayo Clinic Laboratories

Urine Test Ranges

Metabolite LevelsStatusWhat It Means
Combined (NMN + 2-Pyr) > 17.5 micromol/dayAdequateBody stores are healthy
Combined 5.8 – 17.5 micromol/dayLowHeading toward deficiency
Combined < 5.8 micromol/dayDeficientSerious depletion
NMN < 0.5 mg/g creatinineDeficientSpot test showing depletion

Source: Principles of Nutritional Assessment

These cutoffs come from population studies tracking niacin status against pellagra symptoms. If your combined metabolites drop below 5.8 micromol per day, your body is running on fumes.

Infographic showing Vitamin B3 blood test ranges

When Should You Get Tested?

Most people never need a niacin test. The vitamin is so widespread in foods that deficiency is rare in developed countries. Testing makes sense only in specific situations.

Signs of Deficiency (Pellagra)

Pellagra presents with “the 4 Ds,” a collection of symptoms that get worse without treatment:

  • Dermatitis: Thick, scaly rashes appear on sun-exposed skin, often called “Casal’s necklace” when it circles your neck. The skin darkens and becomes rough.
  • Diarrhea: Chronic digestive issues, including a bright red, swollen tongue (glossitis). Your GI tract basically shuts down properly processing nutrients.
  • Dementia: Mental confusion, memory loss, depression, or even hallucinations. Your brain needs niacin to function.
  • Death: Without treatment, pellagra kills. That’s how serious severe deficiency becomes.

You’re at higher risk if you’re an alcoholic, have malabsorption disorders like Crohn’s disease, or rely heavily on corn as a dietary staple without proper preparation. Carcinoid syndrome also depletes niacin because tumor cells hijack tryptophan (which normally converts to niacin) for their own purposes.

If you see these symptoms, your doctor will likely test urinary metabolites to confirm pellagra before starting treatment. Treatment is straightforward: high-dose niacin supplementation reverses symptoms quickly.

Symptoms of Niacin Toxicity

On the flip side, taking too much niacin causes its own set of problems. This usually happens from supplements, not food.

The most common issue? Niacin flushing. Your skin turns red, burns, and itches intensely minutes after taking nicotinic acid supplements over 50 mg. This happens because niacin triggers prostaglandin release, dilating your blood vessels.

More serious toxicity symptoms include:

  • Hepatotoxicity (liver damage showing up as jaundice or elevated liver enzymes)
  • Hyperglycemia (high blood sugar, a problem for diabetics)
  • Elevated uric acid (triggering gout attacks)
  • Gastrointestinal distress (nausea, vomiting, stomach pain)

People taking therapeutic doses of 1-3 grams daily for cholesterol need regular monitoring. Blood tests every few months check liver function and blood sugar alongside niacin levels.

According to Mayo Clinic Laboratories, “testing of nonfasting specimens can result in elevated plasma vitamin B3 concentrations, particularly in patients with dietary supplement use.”

🧬 MORE VITAMIN B3 INSIGHTS

Why Blood Tests Can Mislead You

Blood niacin levels are like checking your bank account five minutes after depositing your paycheck. Sure, it looks great right now, but that snapshot doesn’t show how you’ve managed money all month.

You take a vitamin B complex with breakfast. Two hours later, your blood test shows elevated niacin. Your doctor might think you’re taking too much or have excellent status.

Fast forward six hours. Those same blood levels have dropped dramatically because your kidneys filtered out the excess and your cells grabbed what they needed. That morning spike meant nothing for your long-term nutritional status.

This is why the NIH specifically calls out blood tests as unreliable. The transient nature of blood measurements creates false positives and false negatives constantly.

Urine tests average your niacin processing over many hours, smoothing out these fluctuations. That 24-hour collection captures your body’s actual handling of niacin rather than a random moment in time.

The NAD+ Connection: Why Testing Matters When Supplementing

Here’s where things get interesting for anyone taking niacin supplements: the goal isn’t just having enough Vitamin B3. You want optimal NAD+ levels.

Niacin is a precursor to NAD+ (nicotinamide adenine dinucleotide), a coenzyme every cell in your body needs for energy production, DNA repair, and healthy aging. To convert niacin to NAD+, your cells use several biochemical pathways.

Some people take niacin specifically to drive up their NAD+. However, you can take too much.

“The only way to know if your NAD+ is at an ideal level or if you are overdoing it with niacin supplements is to test,” says Dr. Jin-Xiong She, the founder of Jinfiniti Precision Medicine. “We see people who are taking high-dose niacin and getting NAD+ levels over 100 μM. At that level, you’re not necessarily adding any benefits. You may also be causing problems.”

Jinfiniti’s proprietary research has found that the optimal range of NAD+ is 40-100 μM. Too little and your cells have limited energy. Too much and you run into problems similar to niacin toxicity.

The answer is to test your NAD+ levels directly. This way, you don’t have to guess if your niacin supplement is turning into the coenzyme you want at the cellular level.

Jinfiniti’s CLIA-Certified Intracellular NAD+ Test measures the actual NAD+ level in your cells. It gives you the real data you need to adjust your supplementation. Testing niacin metabolites tells you if you’re deficient. Testing NAD+ tells you if your cells are actually using that niacin effectively.

How to Prepare for Your Test

Preparation depends on the test ordered by your doctor.

If your doctor has ordered a blood test, you will need to fast for 8-12 hours for the most accurate baseline. This ensures no recent food or supplement spike will skew the results. 

Stop taking niacin supplements 24 hours before your blood draw unless your doctor specifically wants to measure therapeutic levels.

For urine metabolite testing, you’ll need special collection containers from your lab. The 24-hour collection starts with discarding your first morning urine, then collecting everything after that for exactly 24 hours.

Keep the collection container in a cool, dark place (some labs provide refrigeration instructions). Don’t add anything to your urine sample, and make sure the container stays sealed between uses.

Maintain your normal diet and medication schedule unless your doctor says otherwise. The goal is measuring your typical niacin status, not creating an artificial situation.

If you’re testing for toxicity and are on high-dose niacin therapy, your doctor will want to see what your normal therapeutic levels look like. Take all medications as directed before the test.

Interpreting Your Results

Your test results come back with numbers, but understanding what they mean for your health takes some context.

  • Deficient ranges: If your combined urinary metabolites are below 5.8 micromol/day or your blood NMN is under 0.5 mg/g creatinine, you have confirmed niacin deficiency. Treatment starts immediately with therapeutic niacin doses, typically 100-500 mg daily until symptoms resolve.
  • Low normal ranges: Metabolites between 5.8-17.5 micromol/day suggest your stores are declining. You’re not pellagra-level deficient, but you’re heading that direction. Increasing dietary niacin or adding modest supplementation (15-35 mg daily) prevents further decline.
  • Optimal ranges: Combined metabolites above 17.5 micromol/day indicate healthy niacin status. Your diet provides enough, or your supplementation is working. No changes needed.
  • High ranges: Blood levels above 48 ng/mL for nicotinamide or very high urinary metabolites. You may be over-supplementing, and this is where testing can be useful in people taking therapeutic niacin doses for cholesterol management.

One lesser-known marker they sometimes check is the Niacin Number, which is the NAD/NADP ratio in red blood cells. If it is less than 1.0, the body is headed towards developing a deficiency even before there are signs or symptoms. It’s an early warning system for pellagra, so you can address it before it happens.

Bear in mind, though, that testing B3 in isolation does not give you the full picture. A homocysteine test can be a helpful companion to niacin testing, because B3 is one of the methyl group metabolizers.

If you’re supplementing to boost NAD+ levels, niacin testing alone won’t tell you if your approach is working. You’ll need direct NAD+ testing to be certain that those precursors are being absorbed and utilized. 

Think of niacin testing as determining if you’re putting gas in your tank. NAD+ testing is to see if your engine is actually running, and if it’s running efficiently.

Referenced Sources

  1. Jacob RA, Swendseid ME, McKee RW, Fu CS, Clemens RA. Biochemical Markers for Assessment of Niacin Status in Young Men: Urinary and Blood Levels of Niacin Metabolites. Elsevier BV; 1989. https://doi.org/10.1093/jn/119.4.591
Featured image of homocysteine amino acid in the blood

Homocysteine Testing Guide: Ranges, Results and When It Matters

The homocysteine test measures a specific marker that reflects how well your body processes B vitamins and manages a cycle called one-carbon metabolism. When this system works efficiently, homocysteine levels stay low. When it doesn’t, levels rise and signal potential problems with nutrition, genetics, or underlying health conditions.

Here’s what makes this test interesting: elevated homocysteine doesn’t just point to one issue. It can reveal B vitamin deficiencies, kidney problems, genetic variations, or increased risk for cognitive decline.

What You Should Know

  • Homocysteine is a sulfur-containing amino acid that reflects how efficiently your body uses B vitamins
  • Normal levels typically fall below 15 μmol/L, while elevated levels are classified into moderate, intermediate, and severe categories
  • High levels most often result from deficiencies in folate (B9), B12, or B6 rather than serious disease
  • Testing makes the most sense for diagnosing nutritional deficiencies, evaluating cognitive concerns, or managing chronic kidney disease

What is Homocysteine?

Homocysteine is an amino acid, but not one that gets built into proteins like the amino acids you eat in food. It is a metabolic intermediate. This means it forms when your body breaks down methionine(an essential amino acid from your diet). After that, it is quickly converted into other substances that your body needs.

Think of it as a temporary product in an assembly line. Your body doesn’t want homocysteine hanging around. When everything works correctly, enzymes rapidly transform it into either methionine or cysteine, keeping blood levels low.

The entire process depends on B vitamins serving as cofactors (helper molecules that make reactions happen). Without enough folate, B12, and B6, the conversion slows down and homocysteine accumulates.

Why Homocysteine Levels Matter for Cellular Health

The real issue with elevated homocysteine isn’t the molecule itself but what it signals about cellular methylation. Methylation is how your cells add small chemical groups to DNA, proteins, hormones, and neurotransmitters to control their function.

When homocysteine builds up, it creates a compound called S-adenosylhomocysteine (SAH) that blocks methylation enzymes. Cells can’t properly maintain DNA, produce neurotransmitters, or regulate inflammation[1].

This methylation failure, not homocysteine toxicity itself, appears to drive many of the health problems associated with high levels. Brain function suffers particularly hard since neurons rely heavily on methylation for neurotransmitter production and membrane maintenance.

What Does a Homocysteine Blood Test Measure?

The test measures total homocysteine (tHcy) concentration in your blood, reported in micromoles per liter (μmol/L). A lab technician draws blood from your arm, usually after you’ve fasted for 8-12 hours, since eating can temporarily affect results.

Most labs use a technique called immunoassay or liquid chromatography to quantify the exact amount present. The test itself is straightforward, but interpreting what the number means requires understanding your individual health context.

Who Should Get Tested?

Testing makes sense in specific situations, not as routine screening for everyone. You might benefit from a homocysteine test if you’re experiencing symptoms that suggest B vitamin deficiency:

  • Unusual fatigue or weakness
  • Memory problems or difficulty concentrating
  • Numbness or tingling in hands and feet
  • Balance issues or unsteady gait
  • Changes in mood or cognitive function

Doctors also order the test when evaluating newborns for homocystinuria, a rare genetic disorder causing extremely high levels. If you have chronic kidney disease, your physician might monitor homocysteine since kidney function directly affects how well your body clears it.

People with unexplained cognitive decline often get tested. Research shows that elderly individuals with mild cognitive impairment and elevated homocysteine may benefit from specific interventions that those with normal levels don’t need.

When Testing Doesn’t Make Sense

Major medical organizations, including the American Heart Association, advise against routine homocysteine screening for cardiovascular disease prevention in healthy people[2]. Large clinical trials found that lowering homocysteine with B vitamins didn’t reduce heart attack or stroke risk in unselected populations.

The test works best as a diagnostic tool for specific conditions, not as a general wellness metric. If you’re healthy, eating a balanced diet, and have no symptoms suggesting B vitamin problems, testing likely won’t change your health management.

CLIA-Certified Longevity Testing

Measure Homocysteine with 27 other longevity biomarkers.

Jinfiniti AgingSOS green gradient background

Understand Your Homocysteine Test Results

Labs typically consider levels below 15 μmol/L normal for adults. That threshold reflects the point where most healthy people with adequate B vitamin status fall.

Your results get classified into categories that help doctors determine what’s causing elevation and how aggressively to treat it.

Normal Homocysteine Levels

If your result comes back under 15 μmol/L, your body is efficiently converting homocysteine through the remethylation and transsulfuration pathways. This suggests:

  • You’re getting enough B vitamins from food or supplements
  • Your liver and kidneys are functioning well enough to process homocysteine properly
  • Your methylation cycle is working as designed

Normal levels don’t guarantee you’re free from other health issues. They simply indicate this particular metabolic cycle is working efficiently.

What High Homocysteine Levels Mean

Doctors classify elevated homocysteine into three severity levels based on concentration:

  • Moderate elevation (15-30 μmol/L): This range most often signals nutritional deficiencies in folate, B12, or B6. It can also occur in people with the MTHFR C677T genetic variant, which reduces the efficiency of folate metabolism by about 35%.
  • Intermediate elevation (30-100 μmol/L): You’ll see levels this high with more serious B vitamin depletion, chronic kidney disease, or certain medications like methotrexate and anti-seizure drugs. About 70% of homocysteine gets metabolized by the kidneys, so any kidney impairment can push levels into this range[2].
  • Severe elevation (>100 μmol/L): Levels above 100 μmol/L strongly suggest homocystinuria or another inborn error of metabolism. These rare genetic conditions prevent enzymes from working at all, causing homocysteine to accumulate to toxic concentrations.

Dr. Jin-Xiong She explains it this way: “Homocysteine testing functions as a window into cellular methylation efficiency. When we see elevated levels, we’re not just looking at one molecule, we’re seeing evidence that thousands of methylation reactions throughout the body may be impaired. That’s why the test is valuable for precision health optimization, even though it’s fallen out of favor for routine heart health screening.”

What Causes Elevated Homocysteine?

Several factors can push homocysteine above normal ranges. Understanding the cause determines the right intervention.

B Vitamin Deficiencies

Insufficient folate (B9) has the strongest impact on homocysteine levels. Research shows folate status contributes more to elevated homocysteine than other factors. The MTHFR enzyme needs activated folate to convert homocysteine back to methionine.

Vitamin B12 deficiency contributes almost as much. A 2017 study in Yunnan Province, China examined over 500 adults and found that folate status had the greatest impact on homocysteine levels, followed by MTHFR genotype, and then B12 status[3].

B6 plays a different role. It’s needed for the transsulfuration pathway that converts homocysteine to cysteine. Deficiency here matters less for most people than folate or B12 shortfalls.

Other Contributing Factors

Several conditions and lifestyle factors can raise the level of homocysteine beyond normal ranges:

Age: Levels rise progressively after age 50 due to declining kidney function, reduced enzyme activity, and changes in hormone status. This age-related increase explains why older adults show higher baseline readings even when otherwise healthy.

Chronic kidney disease: Damaged kidneys can’t metabolize and clear homocysteine effectively. Patients with moderate to severe kidney impairment often show intermediate elevation (30-100 μmol/L) regardless of vitamin status.

Medications: Several drugs interfere with B vitamin metabolism:

  • Methotrexate blocks folate processing
  • Anti-epileptic drugs increase breakdown of B vitamins
  • Proton pump inhibitors reduce B12 absorption over time

High methionine intake: Since methionine converts to homocysteine during metabolism, eating excessive amounts of methionine-rich foods (mostly animal proteins) without adequate B vitamins creates a metabolic bottleneck.

Homocysteine and Heart Health: What Research Shows

The relationship between homocysteine and cardiovascular disease has generated decades of research and considerable debate.

The Cardiovascular Connection Explained

People with the rare genetic condition homocystinuria develop severe atherosclerosis and blood clots in their teens and twenties when homocysteine levels exceed 100 μmol/L. This observation led researchers to hypothesize that even moderately elevated levels might damage blood vessels[2].

Studies show that high homocysteine concentrations can damage blood vessels through several mechanisms[2]:

  • Damaging endothelial cells lining blood vessels
  • Promoting oxidative stress and inflammation
  • Creating a pro-thrombotic environment that encourages inappropriate clotting

The mechanisms are real and reproducible in test tubes and animal models.

Observational studies in humans found associations between elevated homocysteine and increased risk of cardiovascular disease. A meta-analysis of multiple cohort studies suggested that each 5 μmol/L increase in homocysteine correlated with about a 20% increase in coronary heart disease risk[4].

That sounds concerning. But observational data can’t prove causation, only correlation.

Why Experts Don’t Recommend Routine Screening

The critical test came from randomized controlled trials. Researchers gave thousands of people B vitamin supplements (folic acid, B12, and B6) to lower their homocysteine by 25-33%. If elevated homocysteine caused cardiovascular disease, reducing it should prevent heart attacks and strokes.

It didn’t work. A comprehensive meta-analysis of 56,000 participants across multiple trials found[5]:

  • Major cardiovascular events: Risk ratio 0.98 (no reduction)
  • Myocardial infarction: Risk ratio 0.99 (no reduction)
  • Stroke: Risk ratio 0.94 (no significant reduction)
  • Total mortality: Risk ratio 1.01 (no reduction)

B vitamins successfully lowered homocysteine. They failed to reduce cardiovascular outcomes.

This disconnect suggests homocysteine functions as a marker of underlying metabolic dysfunction rather than a direct cause of heart disease. Animal research supports this interpretation: mice fed high-methionine diets developed atherosclerosis even when their homocysteine stayed normal, while mice with severe B vitamin deficiency and very high homocysteine showed no increased vascular disease[6].

The real culprit may be toxic byproducts of methionine metabolism that B vitamins don’t address. That’s why the American Heart Association now advises against routine homocysteine screening for cardiovascular prevention[7].

Homocysteine and Brain Health

While cardiovascular benefits remain questionable, the connection between homocysteine and cognitive function appears more promising.

The Link to Cognitive Decline

Elevated homocysteine correlates with increased risk of dementia, Alzheimer’s disease, and general cognitive impairment in older adults. A study of Parkinson’s disease patients found those with cognitive impairment had significantly higher homocysteine levels (21.8 ± 7.9 μmol/L) compared to those without cognitive decline (17.5 ± 6.3 μmol/L)[8].

The mechanism likely involves the methylation failure discussed earlier. Brain tissue requires constant methylation for:

  • Neurotransmitter synthesis (serotonin, dopamine)
  • Myelin maintenance around nerve fibers
  • DNA repair in neurons
  • Membrane lipid regulation

When elevated homocysteine levels accumulate and SAH blocks methylation enzymes, neurons can’t maintain normal function.

Low B vitamin status also reduces production of tetrahydrobiopterin, a cofactor needed to make serotonin and dopamine. This double hit, impaired methylation plus reduced neurotransmitter synthesis, may explain why B vitamin deficiency affects mood and cognition so profoundly.

When Testing Helps with Memory Concerns

Here’s where homocysteine testing becomes clinically valuable. Intervention trials in elderly people with mild cognitive impairment and elevated homocysteine showed that high-dose B vitamin supplementation (folic acid, B6, and B12) significantly slowed brain atrophy and cognitive decline[9].

The same intervention doesn’t work in people with normal homocysteine levels. Testing identifies who might benefit from targeted supplementation.

If you’re over 65 and experiencing memory problems, checking homocysteine alongside other biomarkers for cognitive health makes sense. Elevated levels suggest a potentially treatable contributor to your symptoms.

An international consensus statement published by leading researchers argued that if larger trials confirm homocysteine lowering slows dementia progression, screening should expand to all adults over 65, the age when cognitive decline accelerates[10].

🧬 MORE BIOMARKER TESTING

How to Lower High Homocysteine Levels

If testing reveals elevated homocysteine, the treatment approach depends on what’s causing the increase.

B Vitamin Supplementation That Works

The most effective protocol combines folic acid (0.5-5 mg daily) with vitamin B12 (0.5 mg daily). This combination reduces homocysteine by 25-33% in most people who aren’t getting folic acid from fortified foods[11].

B12 provides about a 7% additional reduction beyond what folate achieves alone. B6 supplementation (typically 16.5 mg daily) doesn’t add further benefit when combined with folate and B12[11].

What to expect from supplementation:

  • Results visible within 4-6 weeks of starting
  • Retest at 8-12 weeks to confirm effectiveness
  • People with MTHFR 677TT genotype respond particularly well
  • Adequate supplementation overcomes genetic limitations

Dietary Changes That Help

Food sources rich in B vitamins can support healthy homocysteine metabolism:

Folate-rich foods:

  • Dark leafy greens (spinach, kale, romaine lettuce)
  • A cup of cooked spinach delivers about 260 mcg of folate
  • Asparagus, broccoli, and Brussels sprouts

B12 sources:

  • Meat, fish, eggs, and dairy products
  • Animal products provide B12 in forms your body readily absorbs
  • Plant-based eaters need fortified foods or supplements

B6 and folate sources:

  • Chickpeas, lentils, and beans
  • Bananas, potatoes, and poultry
  • Fortified whole grains

The catch: if you have genuine B vitamin deficiency, dietary changes alone often can’t normalize elevated homocysteine levels quickly enough. Supplements work faster and more reliably for correction, after which food sources help maintain healthy levels.

Should You Get MTHFR Genetic Testing?

You might have heard about testing for MTHFR gene variants. The question is whether knowing your genotype changes what you should do.

The answer for most people is no. The American College of Medical Genetics and Genomics and the American Heart Association both advise against routine MTHFR testing in clinical practice[7].

Here’s why genetic testing adds little value:

  • Common variants occur in 30-40% of some populations
  • They represent normal genetic variation, not disease
  • Treatment remains the same regardless of genotype (B vitamin supplementation)
  • Testing homocysteine directly shows if your methylation works properly

Testing the level of homocysteine tells you if your genetic variant is causing problems. If levels are normal, your genes aren’t an issue. If levels are high, you need B vitamins whether the elevation comes from genetics, diet, or both.

Save the genetic testing cost. Test the actual metabolite (homocysteine) that matters for your health.

The rare exception is diagnosing severe genetic conditions like homocystinuria in newborns, where genetic confirmation guides specific enzyme replacement therapies.

Test Your Homocysteine with Jinfiniti’s AgingSOS

At Jinfiniti, we include homocysteine as one of 28 biomarkers in the AgingSOS Advanced Panel because it provides insight into metabolic efficiency that other standard tests miss.

What makes comprehensive testing valuable:

  • Homocysteine measured alongside NAD+ levels, inflammatory markers, and oxidative stress indicators
  • See how multiple metabolic systems interact, not just isolated data points
  • Identify patterns that single biomarkers can’t reveal
  • Context for interpreting what’s driving any elevations

The test follows our Test, Act, Optimize (TAO) philosophy. First, measure your baseline through CLIA-certified laboratory testing. Second, act on results with targeted nutrition or supplementation. Third, optimize by retesting after 3-4 months to confirm your interventions worked.

Homocysteine fits particularly well into this framework. It responds reliably to B vitamin supplementation, so you can track objective improvement. That’s different from some biomarkers where intervention effects remain unclear or take years to manifest.

The AgingSOS panel also includes markers for kidney function and inflammation, which helps interpret what’s driving elevated homocysteine if levels come back high. You get context, not just an isolated number.

Final Thoughts

Homocysteine testing works best as a precision tool for specific situations, not as routine screening. The evidence shows distinct clinical applications:

When testing provides value:

  • Diagnosing B vitamin deficiencies causing symptoms
  • Evaluating cognitive changes in older adults
  • Managing chronic kidney disease
  • Monitoring metabolic health in high-risk populations

When testing isn’t recommended:

  • Routine cardiovascular screening in healthy people
  • General wellness checks without specific symptoms
  • Replacing direct measurement of other risk factors

The cardiovascular story turned out more complicated than researchers initially hoped. Lowering elevated homocysteine levels doesn’t prevent heart attacks in most people. But for brain health in older adults with high levels, intervention may slow cognitive decline.

Your homocysteine level reflects how efficiently your cells perform thousands of methylation reactions every second. When the number rises, it signals metabolic stress that targeted nutrition can often correct.

Test strategically, interpret results in context, and act on findings with evidence-based interventions. That’s how you turn a simple blood test into meaningful health optimization.

Referenced Sources

  1. Shen W, Gao C, Cueto R, Liu L, Fu H, Shao Y, et al. Homocysteine-methionine cycle is a metabolic sensor system controlling methylation-regulated pathological signaling. Elsevier BV; 2020. https://doi.org/10.1016/j.redox.2019.101322
  2. Varga EA, Sturm AC, Misita CP, Moll S. Homocysteine and MTHFR Mutations. Ovid Technologies (Wolters Kluwer Health); 2005. https://doi.org/10.1161/01.cir.0000165142.37711.e7
  3. Ni J, Zhang L, Zhou T, Xu WJ, Xue JL, Cao N, et al. Association between the MTHFR C677T polymorphism, blood folate and vitamin B12 deficiency, and elevated serum total homocysteine in healthy individuals in Yunnan Province, China. Ovid Technologies (Wolters Kluwer Health); 2017. https://doi.org/10.1016/j.jcma.2016.07.005
  4. Clarke R, Collins R, Lewington S, Donald A, Alfthan G, Tuomilehto J, et al. Homocysteine and risk of ischemic heart disease and stroke: a meta-analysis. Journal of the American Medical Association (JAMA). 2002;288(16):2015–22.
  5. Zhang C, Wang ZY, Qin YY, Yu FF, Zhou YH. Association between B Vitamins Supplementation and Risk of Cardiovascular Outcomes: A Cumulative Meta-Analysis of Randomized Controlled Trials. Public Library of Science (PLoS); 2014. https://doi.org/10.1371/journal.pone.0107060
  6. Troen AM, Lutgens E, Smith DE, Rosenberg IH, Selhub J. The atherogenic effect of excess methionine intake. Proceedings of the National Academy of Sciences; 2003. https://doi.org/10.1073/pnas.2436385100
  7. D’Elia S, Morello M, Titolo G, Caso VM, Solimene A, Luisi E, et al. Homocysteine in the Cardiovascular Setting: What to Know, What to Do, and What Not to Do. MDPI AG; 2025. https://doi.org/10.3390/jcdd12100383
  8. Periñán MT, Macías-García D, Jesús S, Martín-Rodríguez JF, Muñoz-Delgado L, Jimenez-Jaraba MV, et al. Homocysteine levels, genetic background, and cognitive impairment in Parkinson’s disease. Springer Science and Business Media LLC; 2022. https://doi.org/10.1007/s00415-022-11361-y
  9. Miller JW, McCaddon A, Yu JT, Hooshmand B, Refsum H, Smith AD. Concerning the debate about homocysteine, B vitamins, and dementia. SAGE Publications; 2025. https://doi.org/10.1177/13872877251350297
  10. Smith AD, Refsum H, Bottiglieri T, Fenech M, Hooshmand B, McCaddon A, et al. Homocysteine and Dementia: An International Consensus Statement. SAGE Publications; 2018. https://doi.org/10.3233/jad-171042
  11. Clarke R, Armitage J. Vitamin Supplements and Cardiovascular Risk: Review of the Randomized Trials of Homocysteine-Lowering Vitamin Supplements. Georg Thieme Verlag KG; 2000. https://doi.org/10.1055/s-2000-8101
A nurse preparing a woman for an ApoB blood test.

Apolipoprotein B (ApoB) Test: What It Means for Heart Health

Your doctor orders a standard cholesterol panel. Your LDL cholesterol comes back normal. You’re told your heart disease risk is low.

But what if that blood test missed something?

Growing evidence shows that traditional cholesterol tests can underestimate risk of heart disease in a significant number of people. The test that many cardiologists now consider more accurate? Apolipoprotein B, or ApoB.

What You Should Know

  • ApoB testing measures the total number of atherogenic particles in your blood, not just cholesterol content.
  • When ApoB and LDL cholesterol disagree, your cardiovascular risk follows the ApoB level.
  • Up to 17.5% of people have dangerously high ApoB levels despite normal cholesterol tests.
  • Optimal ApoB levels vary by risk category, with targets as low as <65 mg/dL for high-risk individuals.

What is Apolipoprotein B?

Apolipoprotein B (ApoB-100) is a protein found on the surface of atherogenic lipoproteins. These particles lead to plaque buildup in your arteries.

Each harmful lipoprotein particle carries one ApoB molecule. This includes VLDL (very low-density lipoprotein), IDL (intermediate-density lipoprotein), LDL (low-density lipoprotein), and Lp(a).

You can think of ApoB as a particle counter. Instead of measuring how much cholesterol is in your blood, it counts how many cholesterol-carrying particles are present.

That difference is important because the number of particles predicts heart disease risk better than the amount of cholesterol they hold[1].

How ApoB Differs from LDL Cholesterol

Standard lipid panels measure LDL cholesterol (LDL-C), which reflects the mass of cholesterol in LDL particles. However, this measurement has a drawback: the makeup of these particles can vary significantly among individuals[2].

Some people have large, fluffy LDL particles that hold more cholesterol. Others have small, dense particles that carry less cholesterol but are more likely to cause plaque buildup.

Two individuals can have the same LDL cholesterol levels yet have very different particle counts.

ApoB testing addresses this issue with a straightforward 1:1 relationship. Each atherogenic particle has one ApoB molecule attached to it. When you measure ApoB concentration, you directly count the total number of particles that can penetrate and get stuck in your artery walls.

Research published in the European Heart Journal shows that ApoB gives a better evaluation of the risk for atherosclerotic cardiovascular disease compared to traditional cholesterol tests[3].

Comprehensive Lipid Testing

Test ApoB with 27 other key longevity biomarkers.

Jinfiniti AgingSOS green gradient background

Why ApoB Is More Accurate Than LDL Cholesterol

The scientific evidence for ApoB’s superiority is substantial. Multiple meta-analyses comparing cardiovascular risk markers consistently rank ApoB as superior to non-HDL cholesterol, which in turn outperforms LDL cholesterol[4].

The problem with LDL-C becomes especially pronounced in people with metabolic syndrome, diabetes, obesity, or elevated triglycerides. These conditions create smaller, denser particles that carry less cholesterol per particle[5].

Your LDL cholesterol might look normal, but you could have a dangerously high number of small particles. ApoB catches this discrepancy.

“ApoB concentration provides a direct measurement of the total number of circulating atherogenic lipoprotein particles,” explains research from the Indian Heart Journal[1]. “This direct count measures the causal factor of atherosclerosis.”

When LDL and ApoB Disagree

What happens when your LDL cholesterol and ApoB levels tell different stories? The answer is clear: your cardiovascular risk follows the ApoB number.

Data from the CARDIA study tracked young adults for 25 years. Those with high ApoB but normal LDL cholesterol had a 55% higher risk of developing coronary artery calcification compared to those with both markers in normal range[6].

The reverse wasn’t true. People with high LDL-C but normal ApoB showed no increased risk.

Analysis published in Circulation reinforces this finding across multiple clinical trials. When cholesterol levels and ApoB are discordant, clinical outcomes align with particle count, not cholesterol mass[7].

Understand Your ApoB Test Results

ApoB testing measures the amount of apolipoprotein B in your blood. It is reported in milligrams per deciliter (mg/dL). The test involves a simple blood draw and provides results using standardized immunoassay methods.

To understand your results, you need to consider two factors: general reference ranges and personal treatment goals based on your cardiovascular risk profile.

Normal ApoB Levels

Laboratory reference ranges reflect the average distribution in the general population, not necessarily optimal levels for heart health.

General Reference Ranges:

  • Men: 66-133 mg/dL
  • Women: 60-117 mg/dL

Most experts consider levels above 100 mg/dL to be the upper limit of normal for low-risk adults. Levels over 110 mg/dL indicate a high risk of cardiovascular disease, while anything above 130 mg/dL signals a significantly higher risk.

Remember that pregnancy, kidney disease (nephrotic syndrome), and existing high cholesterol can raise ApoB results.

Optimal ApoB Targets by Risk Level

Optimal ApoB levels depend on your individual cardiovascular risk. International guidelines establish aggressive targets, especially for high-risk patients.

ApoB Treatment Targets by Risk Category:

Risk LevelClinical ProfileTarget ApoB (mg/dL)
Very High RiskEstablished heart disease, recent heart attack, severe diabetes<65 (ESC/EAS) to <80 (NLA)
High RiskType 2 diabetes, multiple major risk factors<80 (ESC/EAS) to <90 (NLA)
Moderate Risk1-2 risk factors, primary prevention<100

The 2019 ESC/EAS Guidelines recommend the most aggressive targets, particularly the <65 mg/dL goal for very high-risk patients. 

Preventive cardiologists often aim even lower; some specialists target <60 mg/dL for optimal heart protection in high-risk individuals. 

These aggressive targets reflect current understanding. The relationship between particle count and atherosclerosis is nearly linear. Lower particle exposure over time leads to less plaque accumulation and better long-term outcomes.

What High ApoB Means for Your Heart

Elevated ApoB directly increases your risk of atherosclerotic cardiovascular disease (ASCVD). The mechanism is simple: more particles create more chances for them to penetrate arteries and form plaque.

When ApoB particles get into the artery wall and become trapped, they cause inflammation and lead to plaque development. A higher level of circulating particles raises the likelihood of this harmful process happening.

The risk can be measured. A meta-analysis of 29 randomized trials with over 330,000 patients showed that every 10 mg/dL drop in ApoB reduces major adverse cardiovascular events by 7%[8].

For those who have already had a heart attack, high ApoB levels afterward indicate both the seriousness of coronary artery blockages and the chance of future heart issues, more accurately than LDL cholesterol[9].

The risk goes beyond just LDL particles. Since ApoB counts all harmful particles—including triglyceride-rich VLDL and remnants—it captures cardiovascular risk that standard cholesterol tests completely miss.

Who Should Get an ApoB Test?

Current U.S. guidelines primarily recommend ApoB testing for people with triglyceride levels ≥200 mg/dL. But many cardiologists argue this restriction misses too many at-risk individuals.

You should consider ApoB testing if you have:

  • Metabolic syndrome, prediabetes, or type 2 diabetes
  • Family history of early heart disease
  • High triglycerides or low HDL cholesterol
  • Obesity or excess abdominal fat
  • Normal LDL cholesterol despite other risk factors
  • Existing cardiovascular disease

Research shows that up to 17.5% of people have isolated high ApoB, which means they have elevated particle counts even though their cholesterol panels appear normal. This group would not be detected without directly measuring ApoB[10].

“Restricting testing of apoB to those with metabolic risk factors will miss a substantial minority of individuals with discordantly elevated levels,” notes a study in JAMA Cardiology analyzing population-wide ApoB screening[11].

The argument for regular ApoB testing becomes more convincing as we see that discrepancies in particle numbers aren’t just found in those with obvious metabolic issues. Even healthy individuals can have hidden particle burdens that standard tests fail to detect.

🧬 MORE BIOMARKER TESTING

How ApoB Testing Guides Treatment

ApoB serves two critical functions in cardiovascular care: identifying high-risk patients who need treatment and monitoring how well therapies work[7].

The marker is particularly valuable for assessing residual risk in people already taking cholesterol-lowering medications. You might have reached your LDL cholesterol target on a statin, but if your ApoB remains elevated, you still carry significant cardiovascular risk.

Studies of major drug trials confirm that ApoB is the most accurate predictor of treatment benefit across all lipid-lowering therapies, including statins, ezetimibe, and PCSK9 inhibitors[7].

When treatments lower ApoB by enhancing LDL receptor function (the mechanism used by statins and most modern therapies), cardiovascular events decrease proportionally. Every 10 mg/dL reduction in ApoB through receptor-mediated clearance reduces heart attack and stroke risk by approximately 7-12%.

If your ApoB remains high after starting therapy, your doctor has clear justification to intensify treatment—perhaps adding ezetimibe or a PCSK9 inhibitor to your statin.

The European Society of Cardiology and Canadian Cardiovascular Society already endorse ApoB for treatment monitoring. U.S. adoption lags behind, but the scientific consensus is clear: ApoB provides superior guidance for therapeutic decisions.

ApoB Testing with AgingSOS

While individual ApoB tests provide valuable cardiovascular risk information, they work best as part of comprehensive health assessment.

Jinfiniti’s AgingSOS Advanced Panel includes ApoB measurement alongside 27 other biomarkers that influence longevity and cardiovascular health. The panel measures inflammation markers, oxidative stress markersNAD+ levels, and the longevity protein Klotho.

This integrated approach allows you to see how particle burden interacts with other aging processes. High ApoB combined with elevated inflammatory markers, for instance, suggests particularly aggressive atherosclerosis risk.

The AgingSOS panel includes a free consultation to help interpret results and develop targeted intervention strategies based on your unique biomarker profile.

Frequently Asked Questions

Is ApoB testing covered by insurance?

Coverage varies by insurance provider and medical necessity. Testing is more likely to be covered if you have diabetes, metabolic syndrome, high triglycerides, or established cardiovascular disease. Check with your insurance provider about specific coverage for preventive testing.

How often should I test ApoB?

For people at high cardiovascular risk or those on lipid-lowering therapy, testing every 3-6 months helps track treatment effectiveness. Once you’ve achieved target levels, annual monitoring is typically appropriate. Your doctor can provide personalized recommendations based on your risk profile.

Can I lower high ApoB naturally?

Diet and lifestyle changes can reduce ApoB levels. Weight loss, particularly reducing abdominal fat, helps lower particle count. Reducing saturated fat and refined carbohydrates while increasing fiber intake supports better lipoprotein profiles. Regular exercise and adequate sleep also contribute. For many people with significantly elevated ApoB, medications like statins provide necessary additional particle reduction.

What’s the difference between ApoB and Lp(a)?

Lipoprotein(a), or Lp(a), is a specific type of LDL particle that carries ApoB plus an additional protein called apolipoprotein(a). ApoB counts all atherogenic particles, including Lp(a). Lp(a) is largely genetically determined and doesn’t respond well to standard therapies, while ApoB includes modifiable lipoproteins that decrease with treatment.

Referenced Sources

  1. Singh K, Prabhakaran D. Apolipoprotein B – An ideal biomarker for atherosclerosis? Elsevier BV; 2024. https://doi.org/10.1016/j.ihj.2023.12.001
  2. Sniderman AD, Thanassoulis G, Glavinovic T, Navar AM, Pencina M, Catapano A, et al. Apolipoprotein B Particles and Cardiovascular Disease. American Medical Association (AMA); 2019. https://doi.org/10.1001/jamacardio.2019.3780
  3. Sniderman AD, Dufresne L, Pencina KM, Bilgic S, Thanassoulis G, Pencina MJ. Discordance among apoB, non–high-density lipoprotein cholesterol, and triglycerides: implications for cardiovascular prevention. Oxford University Press (OUP); 2024. https://doi.org/10.1093/eurheartj/ehae258
  4. Sniderman AD, Williams K, Contois JH, Monroe HM, McQueen MJ, de Graaf J, et al. A Meta-Analysis of Low-Density Lipoprotein Cholesterol, Non-High-Density Lipoprotein Cholesterol, and Apolipoprotein B as Markers of Cardiovascular Risk. Ovid Technologies (Wolters Kluwer Health); 2011. https://doi.org/10.1161/circoutcomes.110.959247
  5. Behbodikhah J, Ahmed S, Elyasi A, Kasselman LJ, De Leon J, Glass AD, et al. Apolipoprotein B and Cardiovascular Disease: Biomarker and Potential Therapeutic Target. MDPI AG; 2021. https://doi.org/10.3390/metabo11100690
  6. Liu K, Daviglus ML, Loria CM, Colangelo LA, Spring B, Moller AC, et al. Healthy Lifestyle Through Young Adulthood and the Presence of Low Cardiovascular Disease Risk Profile in Middle Age. Ovid Technologies (Wolters Kluwer Health); 2012. https://doi.org/10.1161/circulationaha.111.060681
  7. De Oliveira-Gomes D, Joshi PH, Peterson ED, Rohatgi A, Khera A, Navar AM. Apolipoprotein B: Bridging the Gap Between Evidence and Clinical Practice. Ovid Technologies (Wolters Kluwer Health); 2024. https://doi.org/10.1161/circulationaha.124.068885
  8. Khan SU, Khan MU, Valavoor S, Khan MS, Okunrintemi V, Mamas MA, et al. Association of lowering apolipoprotein B with cardiovascular outcomes across various lipid-lowering therapies: Systematic review and meta-analysis of trials. Oxford University Press (OUP); 2019. https://doi.org/10.1177/2047487319871733
  9. Wang Y, Guo D, Wang Y, Yang J, Li P. Correlation analysis of ApoB and TyG index levels with residual cardiovascular risk in patients with acute myocardial infarction. Frontiers Media SA; 2025. https://doi.org/10.3389/fendo.2025.1542190
  10. Choi R, Lee SG, Lee EH. Effect of Adding Apolipoprotein B Testing on the Prevalence of Dyslipidemia and Risk of Cardiovascular Disease in the Korean Adult Population. MDPI AG; 2024. https://doi.org/10.3390/metabo14030169
  11. Sayed A, Peterson ED, Virani SS, Sniderman AD, Navar AM. Individual Variation in the Distribution of Apolipoprotein B Levels Across the Spectrum of LDL-C or Non–HDL-C Levels. American Medical Association (AMA); 2024. https://doi.org/10.1001/jamacardio.2024.1310
Hemoglobin A1C (HbA1c) Test Featured Image

Hemoglobin A1C (HbA1c) Test: Ranges, Benefits and Limitations

If you’ve ever wondered how well your blood sugar has been controlled over the past few months, the HbA1c test gives you that answer. Unlike a standard glucose test that captures just one moment in time, HbA1c measures your average blood glucose levels over the preceding 8-12 weeks.

This blood test is one of the most valuable tools for diagnosing diabetes, monitoring treatment effectiveness, and predicting long-term health risks.

What You Should Know

  • HbA1c measures average blood glucose over 2-3 months by checking how much sugar has attached to your red blood cells
  • Results below 5.7% are normal, 5.7-6.4% indicate prediabetes, and 6.5% or higher suggests diabetes
  • The test doesn’t require fasting and provides better insight into complications risk than single glucose measurements
  • Certain conditions like anemia can affect accuracy, so HbA1c should be interpreted alongside other health markers

What is the Hemoglobin A1C (HbA1c) Test?

The hemoglobin A1c test measures glycated hemoglobin, which is hemoglobin with glucose molecules attached.

Hemoglobin is a protein in your red blood cells that carries oxygen throughout your body. When glucose enters your bloodstream, some of it binds to hemoglobin through a process called glycation.

As your blood sugar levels increase, more glucose attaches to your hemoglobin.

Since red blood cells live for about 120 days, the HbA1c test shows your blood sugar levels over that entire period. The test results are given as a percentage. A higher percentage means more glucose has been in your blood.

How Glycation Works

Glycation happens when glucose binds to the NH₂-terminal valine on hemoglobin’s beta chain. First, it forms an unstable structure called a Schiff base. This then undergoes something called an Amadori rearrangement to create stable HbA1c[1].

This process is irreversible. Once glucose attaches to hemoglobin, it stays there for the life of that red blood cell.

Dr. David B. Sacks from the National Institutes of Health explains: “Formation of HbA1c is essentially irreversible, and its concentration in the blood depends on both the life span of the red blood cell, which averages ~120 days, and the blood glucose concentration.”

Your HbA1c is a weighted average. Blood sugar levels from the past 30 days contribute more to your result than levels from 90-120 days ago.

Comprehensive Metabolic Testing

Test HbA1c with 27 other key longevity biomarkers.

Jinfiniti AgingSOS green gradient background

Why HbA1c Testing Matters for Long-Term Health

HbA1c doesn’t just diagnose diabetes. It also predicts your risk for serious complications such as kidney disease, vision loss, and nerve damage.  

These complications come from long-term exposure to high blood sugar. This condition harms blood vessels and speeds up cellular aging.  

A1C levels are now seen as essential for diabetes care around the world. Two important studies established this link.

The DCCT and UKPDS Studies

The Diabetes Control and Complications Trial (DCCT) followed 1,441 people with type 1 diabetes from 1983 to 1993. Participants who kept their HbA1c levels around 7% through intensive treatment had a 35-76% lower risk of microvascular complications compared to those with an HbA1c around 9%[2].

Specific reductions included:

The UK Prospective Diabetes Study (UKPDS) showed similar findings for type 2 diabetes. Even a modest difference in HbA1c (7.0% versus 7.9%) resulted in approximately 25% fewer microvascular complications[3].

Both studies revealed a “legacy effect”—early intensive glucose control produced lasting benefits years later, even after HbA1c levels converged between treatment groups. This metabolic memory indicates that getting your HbA1c under control early is important for your long-term health.

HbA1c and Complications Risk

The relationship between HbA1c and complications risk is dose-dependent. Higher levels mean higher risk.

A Swedish study tracking 10,398 people with type 1 diabetes found[4]:

  • HbA1c of 7.0-7.4% showed 1.31-fold increased retinopathy risk compared to 6.5-6.9%
  • HbA1c above 8.6% demonstrated 5.98-fold increased risk of proliferative retinopathy
  • HbA1c above 8.6% carried 3.43-fold increased risk of macroalbuminuria (kidney damage)

Over 16-20 years of follow-up, each 1% increase in HbA1c resulted in an odds ratio of 2.87 for proliferative diabetic retinopathy and 3.83 for macroalbuminuria.

According to UKPDS analysis, each 10% relative reduction in HbA1c resulted in[5]:

  • 43% relative risk reduction for retinopathy progression
  • 25% relative risk reduction for nephropathy

Understand Your HbA1c Results

The World Health Organization and major diabetes organizations have established clear thresholds for interpreting your results.

Normal, Prediabetes, and Diabetes Ranges

HbA1c LevelClassification
Below 5.7% (39 mmol/mol)Normal
5.7% to 6.4% (39-47 mmol/mol)Prediabetes
6.5% or higher (48 mmol/mol)Diabetes

The WHO states: “HbA1c can be used as a diagnostic test for diabetes providing that stringent quality assurance tests are in place and assays are standardised to criteria aligned to the international reference values… An HbA1c of 6.5% is recommended as the cut point for diagnosing diabetes.”

For people already diagnosed with diabetes, treatment targets differ. The American Diabetes Association recommends an HbA1c target of less than 7% for most non-pregnant adults. The American Association of Clinical Endocrinologists suggests 6.5% if achievable safely.

For children and adolescents with type 2 diabetes, the 2025 ADA guidelines recommend an HbA1c goal of less than 6.5%.

How HbA1c Translates to Average Blood Glucose

To make HbA1c more intuitive, researchers developed estimated average glucose (eAG). This converts your percentage into the average blood sugar level you’ve maintained.

The A1c-Derived Average Glucose study included 507 people across 10 international centers. It demonstrated a tight correlation (r = 0.92) between HbA1c and average glucose[6].

HbA1c (%)Estimated Average Glucose
5%97 mg/dL (5.4 mmol/L)
6%126 mg/dL (7.0 mmol/L)
7%154 mg/dL (8.6 mmol/L)
8%183 mg/dL (10.2 mmol/L)
9%212 mg/dL (11.8 mmol/L)
10%240 mg/dL (13.4 mmol/L)

The formula is: eAG (mg/dL) = 28.7 × HbA1c − 46.7

Benefits of HbA1c Over Standard Glucose Tests

HbA1c offers several practical advantages over traditional glucose testing.

You don’t need to fast. The test can be performed any time of day, regardless of when you last ate. This eliminates the inconvenience of overnight fasting required for fasting plasma glucose tests.

Results are stable and reproducible. Blood glucose fluctuates widely throughout the day. HbA1c varies minimally (approximately 1%) in healthy individuals.

Acute factors don’t affect it. Your results aren’t thrown off by stress, exercise, or what you ate yesterday.

It reflects chronic exposure. HbA1c provides a comprehensive view of glucose control over 2-3 months, which better correlates with long-term complication risk than single glucose measurements[7].

When HbA1c Results Can Be Misleading

Despite its utility, HbA1c has limitations that can affect accuracy.

Conditions That Affect Red Blood Cells

Any condition that changes how long your red blood cells survive will affect your HbA1c.

Conditions causing falsely low HbA1c:

  • Hemolytic anemia (red blood cells break down too quickly)
  • Chronic kidney disease (shortened RBC survival)
  • Recent blood transfusion
  • Treatment with erythropoietin

Conditions causing falsely high HbA1c:

  • Iron deficiency anemia
  • B12 or folate deficiency anemia
  • Asplenia (absence of spleen)

Hemoglobin variants like HbS, HbE, HbD, and HbC can interfere with some HbA1c assay methods. Depending on the variant and testing method, results can be spuriously increased or decreased[8].

Individual Variations in HbA1c

Research shows that some people have higher average HbA1c levels independent of their actual blood glucose control.

Studies consistently demonstrate that individuals who identify as Black or African American have approximately 0.3-0.5% higher HbA1c levels compared with non-Hispanic White individuals, even after adjusting for glucose measures.

Dr. Mary Rhee from the Atlanta VA Health Care System and Emory University has highlighted the clinical implications: “HbA1c mismatches are not widely appreciated, but we found that they are not uncommon, and can have important clinical implications. Because HbA1c mismatches could lead to errors, the diagnoses of diabetes/prediabetes should include measurement of fasting glucose levels and/or oral glucose tolerance tests in addition to HbA1c in most Veterans.”

A UK study found that children and young people from Black ethnic backgrounds demonstrated approximately 4-5 mmol/mol higher HbA1c than their White and South Asian counterparts, independent of mean blood glucose levels[9].

This is why your test result should be interpreted within the context of individual patient factors and combined with other assessments.

How Often Should You Test HbA1c?

Diabetes Canada and other organizations provide clear guidance on testing frequency.

  • For patients not meeting glucose targets or with recent therapy changes: every 3 months
  • For patients with stable, well-controlled diabetes: every 6 months

HbA1c should not be measured more than 4 times yearly in most circumstances. Since the test reflects 2-3 months of glucose exposure, testing more frequently doesn’t provide new information.

🧬 MORE BIOMARKER TESTING

  • HbA1c isn’t the only glycation marker worth tracking. The glycated serum protein test captures shorter-term glucose patterns.
  • Elevated levels can signal metabolic trouble ahead. Understanding uric acid testing helps identify inflammation and insulin resistance.
  • Chronic inflammation drives diabetes complications. Learn what C-reactive protein levels reveal about your risk.
  • Your immune response affects blood sugar control. Discover how cytokine testing measures inflammatory pathways.

Test Your HbA1c with AgingSOS

Jinfiniti’s AgingSOS includes HbA1c testing as part of a comprehensive longevity assessment.

You’ll get HbA1c measured alongside 27 other biomarkers including intracellular NAD+, Klotho (the longevity protein), inflammation markers, oxidative stress indicators, and cardiovascular risk factors.

This complete picture helps you detect metabolic issues years before symptoms appear. You can track how your interventions—whether supplements, diet changes, or exercise—affect your HbA1c and other aging markers over time.

The AgingSOS Longevity Panel includes a free consultation to help you interpret your results and develop a personalized optimization strategy.

Mobile phlebotomy is available for convenient at-home blood collection.

Referenced Sources

  1. Sacks DB. Hemoglobin A1c in Diabetes: Panacea or Pointless? American Diabetes Association; 2012. https://doi.org/10.2337/db12-1485
  2. Nathan DM. The Diabetes Control and Complications Trial/Epidemiology of Diabetes Interventions and Complications Study at 30 Years: Overview. American Diabetes Association; 2013. https://doi.org/10.2337/dc13-2112
  3. King P, Peacock I, Donnelly R. The UK Prospective Diabetes Study (UKPDS): clinical and therapeutic implications for type 2 diabetes. Wiley; 1999. https://doi.org/10.1046/j.1365-2125.1999.00092.x
  4. Lind M, Pivodic A, Svensson AM, Ólafsdóttir AF, Wedel H, Ludvigsson J. HbA1c level as a risk factor for retinopathy and nephropathy in children and adults with type 1 diabetes: Swedish population based cohort study. BMJ; 2019. https://doi.org/10.1136/bmj.l4894
  5. Regier L. DIABETES LANDMARK OUTCOME TRIALS- Glycemic Control & Prevention Summary. 2019.
  6. Borg R, Kuenen JC, Carstensen B, Zheng H, Nathan DM, Heine RJ, et al. Associations Between Features of Glucose Exposure and A1C. American Diabetes Association; 2010. https://doi.org/10.2337/db09-1774
  7. Chen Z, Shao L, Jiang M, Ba X, Ma B, Zhou T. Interpretation of HbA1c lies at the intersection of analytical methodology, clinical biochemistry and hematology (Review). Spandidos Publications; 2022. https://doi.org/10.3892/etm.2022.11643
  8. Sreeram S, Gupta D, Hanaganahalli Basavaiah S, Hegde A. HbC Revealed in A1C Assay: A Lesson Learnt From a Routine Health Checkup. SAGE Publications; 2020. https://doi.org/10.1177/1932296820935527
  9. Pemberton JS, Fang Z, Chalew SA, Uday S. Ethnic disparities in HbA1c and hypoglycemia among youth with type 1 diabetes: beyond access to technology, social deprivation and mean blood glucose. BMJ; 2025. https://doi.org/10.1136/bmjdrc-2024-004369
A nurse inserts a blood test vial into a tray in the lab.

Glycated Serum Protein (GSP) Test: What You Should Know

Your doctor orders an HbA1c test and the results don’t match your daily glucose readings. Or maybe you have sickle cell trait and standard diabetes tests aren’t giving accurate information.

The glycated serum protein (GSP) test provides another way to monitor blood sugar control. While HbA1c shows your average glucose over 2-3 months, GSP testing offers a look at the past 2-3 weeks.

This shorter timeframe makes GSP testing especially useful for assessing quick changes in blood sugar or when standard tests do not yield trustworthy results.

What You Should Know

  • GSP measures glucose attached to blood proteins, reflecting 2-3 weeks of blood sugar levels
  • The test works better than HbA1c for people with anemia, kidney disease, or hemoglobin variants
  • Research links elevated GSP levels to increased risk of heart disease, stroke, and diabetes complications
  • Normal fructosamine values range from 200-285 µmol/L, while diabetic ranges run higher

What is a Glycated Serum Protein Test?

GSP testing measures how much glucose has attached to proteins in your blood. When glucose molecules encounter proteins in your bloodstream, they bond through a chemical reaction called non-enzymatic glycation.

This process occurs naturally in everyone. The difference lies in how much glycation takes place.

Your body’s main blood protein is albumin, which makes up about 60-65% of total serum protein. Albumin has a lifespan of roughly 14-21 days; that’s much shorter than red blood cells, which live about 120 days.

Since albumin breaks down faster, glycated albumin reflects more recent blood sugar patterns than HbA1c. The rate of glycation for albumin is actually 9-10 times higher than for hemoglobin, making it a sensitive marker of glucose exposure.

Comprehensive Metabolic Testing

Know your glycation status and 27 other key biomarkers.

Jinfiniti AgingSOS green gradient background

Fructosamine vs Glycated Albumin: What’s the Difference?

Fructosamine is the general term for all glycated proteins in your plasma. This includes albumin, globulins, and lipoproteins.

Glycated albumin (GA) specifically measures the percentage of your albumin that has undergone glycation. The test presents this as a ratio compared to total albumin.

Research published in the Journal of Diabetes Science and Technology shows that glycated albumin has better diagnostic efficiency than fructosamine in different clinical settings. The ratio format reduces interference from changes in protein concentration, providing more reliable results[1].

What Do Your Test Results Mean?

Normal Reference Ranges

Here’s how different GSP values break down:

MarkerNon-Diabetic RangeDiabetic RangePoorly Controlled
Fructosamine200-285 µmol/L210-563 µmol/L268-870 µmol/L
Glycated Albumin~14%>17%2-5× upper limit

A fructosamine value of 285 µmol/L—the upper limit of normal—correlates to an HbA1c of about 6.5%. That’s the diagnostic threshold for diabetes.

How GSP Relates to HbA1c

The conversion formula used clinically is:

HbA1c (%) = 0.017 × fructosamine (µmol/L) + 1.61

Research from the Atherosclerosis Risk in Communities (ARIC) Study found strong correlations between glycated proteins and HbA1c. The Pearson’s correlation coefficient was 0.81 for fructosamine and 0.85 for glycated albumin[2].

These correlations tell you that GSP values track closely with HbA1c in most people. But the real value of GSP testing shows up when HbA1c becomes unreliable.

When Should You Get a Glycated Serum Protein Test?

Conditions Where HbA1c Isn’t Reliable

Your HbA1c results depend on having normal red blood cells with typical lifespans. Anything that disrupts this gives you inaccurate readings.

GSP testing bypasses these issues because it measures proteins instead of red blood cells. You should consider GSP testing if you have:

Blood disorders affecting red cells:

  • Sickle cell disease or sickle cell trait
  • Hemoglobin C, D, E, or other variants
  • Hemolytic anemia (shortened red cell lifespan leads to falsely low HbA1c)
  • Iron, B12, or folate deficiency (can cause falsely elevated HbA1c)

Chronic kidney disease: Advanced CKD and dialysis patients often get unreliable HbA1c results. A meta-analysis in Endocrine Practice examining 24 studies with 3,928 patients concluded that glycated albumin is superior to HbA1c for assessing blood glucose control in diabetes patients with advanced kidney disease[3].

Pregnancy: Rapid glycemic changes during pregnancy and altered red cell turnover make short-term monitoring critical. GSP testing can track changes more quickly than HbA1c.

Recent blood transfusion: Donor blood affects your HbA1c measurement because you’re now carrying someone else’s red blood cells. GSP testing avoids this problem entirely.

When You Need Short-Term Monitoring

Sometimes you need to know if a treatment change is working right now, not two months from now.

GSP testing shines when you’re adjusting diabetes medications and want to see results within weeks. It mirrors poorly controlled glucose metabolism better than HbA1c for rapid assessment of treatment effectiveness.

If you’re managing gestational diabetes, tracking your glycemic control every 2-3 weeks provides more actionable information than waiting for HbA1c results.

🧬 MORE BIOMARKER TESTING

What Research Shows About GSP and Health Outcomes

Cardiovascular Disease Risk

The landmark ARIC Study published in Circulation followed 11,104 participants for approximately two decades. During follow-up, there were 1,096 cases of coronary heart disease, 605 ischemic strokes, 1,432 heart failure cases, and 2,860 deaths[2].

Elevated baseline concentrations of fructosamine and glycated albumin were significantly associated with each cardiovascular outcome. For individuals without diagnosed diabetes but with values above the 96th percentile:

  • Coronary Heart Disease: Hazard Ratio 1.33 (fructosamine), 1.61 (glycated albumin)
  • Ischemic Stroke: HR 1.93 (fructosamine), 1.46 (glycated albumin)
  • Heart Failure: HR 1.32 (fructosamine), 1.38 (glycated albumin)
  • All-Cause Mortality: HR 1.30 (fructosamine), 1.53 (glycated albumin)

These associations persisted even after adjusting for HbA1c. This suggests that GSP provides independent prognostic information about your cardiovascular risk.

Dr. Elizabeth Selvin, lead author and researcher at Johns Hopkins Bloomberg School of Public Health, stated: “The results of the study suggest that fructosamine and glycated albumin may be useful substitutes for monitoring glucose control in patients” where HbA1c testing is problematic.

Chronic Kidney Disease

Kidney disease creates a double problem for diabetes monitoring. Not only does it make HbA1c less reliable, but poor glycemic control also accelerates kidney damage.

In advanced chronic kidney disease, the pooled correlation coefficient between glycated albumin and average glucose was 0.57, compared to only 0.49 for HbA1c. That better correlation translates to more accurate tracking of your actual blood sugar patterns.

Diabetes Complications

A 2014 Lancet Diabetes & Endocrinology study of over 12,000 ARIC participants[4] found strong associations between GSP levels and:

  • Retinopathy: Odds ratios exceeding 20 at high values among persons with diabetes
  • Chronic Kidney Disease: HR 1.48-1.50 for values above the 95th percentile
  • Incident Diabetes: HR 4.96 (fructosamine) and 6.17 (glycated albumin) for the highest categories

These findings show that elevated GSP levels predict not just cardiovascular problems, but microvascular complications as well.

Advantages of Glycated Serum Protein Testing

GSP testing fills an important gap in diabetes monitoring. The 2-3 week timeframe sits right between daily glucose checks and the longer 2-3 month window of HbA1c.

You get results that reflect recent changes in your blood sugar control. This makes GSP testing ideal for assessing whether medication adjustments are working.

The test doesn’t depend on normal red blood cell function. If you have any condition affecting red blood cells—whether that’s anemia, hemoglobin variants, or rapid cell turnover—GSP gives you more accurate information than HbA1c.

Research shows GSP levels predict cardiovascular and microvascular complications independently of HbA1c. You’re getting additional prognostic information, not just a substitute marker.

For people with chronic kidney disease, GSP testing is particularly valuable. The correlation between glycated albumin and actual glucose levels stays strong even in advanced CKD, while HbA1c becomes progressively less reliable.

Limitations You Should Know

Lack of Standardization

Unlike HbA1c, GSP testing lacks standardization across different laboratory assays. According to the NIH’s StatPearls, “there is a serious lack of standardization across the different fructosamine assays.”

Reference intervals show considerable variation depending on the testing method. Glycated albumin ranges can vary from 0.8-1.4% to 18-22% across different assays.

This makes it harder to compare results between different labs or tracking systems.

When Albumin Levels Are Abnormal

GSP testing becomes unreliable when your serum albumin drops below 30 g/L. Conditions affecting albumin levels include:

  • Liver cirrhosis (decreased albumin production)
  • Nephrotic syndrome (protein loss through kidneys)
  • Thyroid disease
  • Protein-losing enteropathies

If you have any of these conditions, your GSP results may not accurately reflect your glycemic control.

No Established Treatment Targets

Dr. David B. Sacks, NIH Senior Investigator and Chair of the National Glycohemoglobin Standardization Program steering committee, has noted: “A major limitation of the fructosamine assay is the lack of an evidence base linking the test to long-term complications of diabetes. Unlike HbA1c, there are no generally accepted treatment targets for fructosamine.”

You can use GSP testing to track changes over time. But there’s no equivalent to the HbA1c target of <7% that guides treatment decisions.

The BMI Paradox

An intriguing finding from multiple studies shows an inverse correlation between body mass index and glycated albumin. The ARIC Study found Spearman’s correlations of -0.15 for glycated albumin with BMI.

This contrasts with the positive correlation (+0.26) seen with HbA1c. The mechanism remains unexplained, but it suggests glycated albumin may underestimate glycemic status in obese individuals.

What Current Guidelines Say About GSP Testing

The 2024-2025 American Diabetes Association Standards of Care acknowledges GSP testing’s clinical utility while noting its limitations:

“Fructosamine and glycated albumin are alternative measures of glycemia that are approved for clinical use for monitoring glycemic status. Fructosamine and glycated albumin have been linked to long-term complications in epidemiologic cohort studies.”

The ADA recommends considering fructosamine or glycated albumin “in people with diabetes who have conditions where the interpretation of A1C may be problematic or when A1C cannot be measured.”

HbA1c remains the gold standard for most clinical applications. But for specific populations and situations, GSP testing provides valuable complementary information.

Test Your GSP with Jinfiniti’s AgingSOS

At Jinfiniti Precision Medicine, we recognize that comprehensive health assessment requires measuring multiple biomarkers. Our AgingSOS Advanced Panel includes glycated serum protein testing as part of a 28-biomarker assessment.

Glycation is one of the key biological processes associated with aging and metabolic dysfunction. By measuring GSP alongside markers for inflammation, oxidative stress, and cellular senescence, we provide a more complete picture of your metabolic health.

Dr. Jin-Xiong She, founder of Jinfiniti and genomic medicine researcher, emphasizes the importance of multiple biomarkers: “Understanding your glycemic control through different timeframes and methods allows for more precise interventions. GSP testing complements HbA1c by capturing short-term patterns that longer-term tests might miss.”

This approach aligns with our TAO philosophy—Test, Act, Optimize. We measure your biomarkers, implement targeted interventions based on your results, and track your progress over time.

Testing GSP levels before and after dietary or supplement interventions helps you see whether your metabolic health is improving. The 2-3 week timeframe means you don’t have to wait months to know if changes are working.

For individuals managing diabetes or working on metabolic health optimization, GSP testing provides actionable information that supports data-driven decision-making.

Referenced Sources

  1. Danese E, Montagnana M, Nouvenne A, Lippi G. Advantages and Pitfalls of Fructosamine and Glycated Albumin in the Diagnosis and Treatment of Diabetes. SAGE Publications; 2015. https://doi.org/10.1177/1932296814567227
  2. Selvin E, Rawlings AM, Lutsey PL, Maruthur N, Pankow JS, Steffes M, et al. Fructosamine and Glycated Albumin and the Risk of Cardiovascular Outcomes and Death. Ovid Technologies (Wolters Kluwer Health); 2015. https://doi.org/10.1161/circulationaha.115.015415
  3. Gan T, Liu X, Xu G. Glycated Albumin Versus HbA1c in the Evaluation of Glycemic Control in Patients With Diabetes and CKD. Elsevier BV; 2018. https://doi.org/10.1016/j.ekir.2017.11.009
  4. Selvin E, Rawlings AM, Grams M, Klein R, Sharrett AR, Steffes M, et al. Fructosamine and glycated albumin for risk stratification and prediction of incident diabetes and microvascular complications: a prospective cohort analysis of the Atherosclerosis Risk in Communities (ARIC) study. Elsevier BV; 2014. https://doi.org/10.1016/s2213-8587(13)70199-2
Lab technician labeling a uric acid blood test vial.

Uric Acid Test: Ranges, Results & What They Mean

Your physician orders routine blood work, and tucked away in the results is a line for uric acid. Most patients skip right past it, figuring it’s only a concern if they have gout.

Big mistake.

Getting your uric acid tested gives insight into much more than joint issues. It’s now connected to cardiovascular disease, kidney damage, diabetes and even mental decline, often well before you realize there’s a problem.

What You Should Know

  • Uric acid tests measure a waste product from purine breakdown that affects multiple body systems
  • Optimal levels (below 5.5 mg/dL) differ significantly from standard “normal” laboratory ranges (up to 7-8 mg/dL)
  • Blood tests provide the most common measurement, while 24-hour urine collection reveals production versus excretion patterns
  • About 14.6% of US adults have elevated uric acid (hyperuricemia), though 85-90% never develop gout symptoms

What is a Uric Acid Test?

A uric acid test measures the concentration of uric acid in your blood or urine. Your body creates this waste product when it breaks down purines, chemical compounds found in certain foods (red meat, organ meats, seafood) and naturally present in your cells.

The test uses one of two methods. The enzymatic approach (now the gold standard) employs the enzyme uricase to oxidize uric acid, creating a chemical reaction that allows precise measurement. The older colorimetric method measures color change but can overestimate levels by about 1 mg/dL due to interference from other substances like vitamin C.

Your kidneys normally filter uric acid from blood and eliminate it through urine. When your body produces too much or your kidneys remove too little, levels climb in your bloodstream.

Why Uric Acid Levels Matter for Your Health

Most physicians learned about uric acid in the context of two conditions: gout and kidney stones. That narrow focus misses the bigger picture emerging from recent research.

Dr. Richard Johnson is a Professor of Medicine at the University of Colorado Denver, who has authored over 400 articles exploring the role of fructose metabolism in causing obesity, diabetes and kidney disease through the production of uric acid. He found that when we ingest fructose, it produces uric acid within the cells of our body. The resulting uric acid then triggers metabolic pathways that increase fat storage and insulin resistance.

“Our work focuses on how diet (and in particular fructose) may have a role in the epidemics of obesity, diabetes, hypertension and kidney disease, and how those sugars may cause their metabolic effects by raising uric acid levels,” Johnson explained.

This mechanism is an evolutionary adaptation. Uric acid was once a metabolic switch that enabled our ancient ancestors to store fat and survive when food was scarce. Today we never have to go without food (particularly fructose that is added to our processed foods) and the adaptation becomes a detriment.

Comprehensive Health Assessment

Test 28 key longevity biomarkers including uric acid.

Jinfiniti AgingSOS green gradient background

The Gout Connection

Gout remains the most recognized consequence of a high level of uric acid. The condition occurs when uric acid crystals deposit in joints and soft tissues, triggering sudden, severe pain and inflammation.

The relationship between high uric acid and gout is more complex than most realize. Approximately 85-90% of people with hyperuricemia never develop gout1. Conversely, up to 39% of gout patients show normal uric acid levels during acute attacks because levels temporarily drop as uric acid crystals precipitate from blood into joints2.

Global gout prevalence ranges from 1-4%, but the United States shows the highest burden worldwide with 5.1% of adults affected (about 12.1 million people as of 2017-2018)3. That number jumped from 3.9% just two years earlier, representing nearly 3 million more cases.

Between 2001 and 2021, disability rates from gout in the US nearly doubled. Geographic patterns show clustering in Hawaii, South Carolina, Alabama, and Louisiana, with Hawaii’s rates exceeding double the national average.

Cardiovascular and Metabolic Risk

The cardiovascular connection carries serious implications. Research cited by Dr. David Perlmutter, board-certified neurologist and author of Drop Acid, reveals that for every 1 mg/dL increase in uric acid above 7, all-cause mortality rises 8-13%. Death from cardiovascular disease increases 38%, and stroke risk climbs 35%.

A 2018 study examining 90,000 adults found that uric acid levels above 5.5 mg/dL correlate with increased cardiovascular and metabolic risk, well below the point where gout typically develops4. Dr. Mimi Guarneri, cardiologist and founder of the Academy of Integrative Health and Medicine, routinely checks patients’ uric acid “because of the links with cardiovascular disease.”

The metabolic syndrome connections extend across multiple conditions. A 2023 meta-analysis found that among people with hyperuricemia, 65% had non-alcoholic fatty liver disease compared to much lower rates in those with normal levels. The pooled data showed 1.88 times higher risk of developing fatty liver with elevated uric acid5.

Recent research published in Signal Transduction and Targeted Therapy notes that 43.3 million Americans have hyperuricemia, representing a sharp rise since 19606. The paper links elevated levels to “a spectrum of commodities such as gout, cardiovascular diseases, renal disorders, metabolic syndrome, and diabetes.”

Kidney Disease Links

Multiple large-scale studies demonstrate that elevated uric acid predicts chronic kidney disease development independent of traditional risk factors. A 2008 study following 21,475 healthy volunteers for seven years found that slightly elevated levels (7.0-8.9 mg/dL) nearly doubled the risk for new kidney disease7.

The mechanism differs from gout’s crystal-dependent process. As Dr. Johnson and colleagues discovered, “When laboratory animals with CKD were made hyperuricemic, the renal disease progressed rapidly despite an absence of crystals in the kidney.” Soluble uric acid, not just crystals, drives kidney damage through inflammatory, oxidative, and vascular pathways8.

A 2014 meta-analysis of 15 cohort studies confirmed a positive association between serum uric acid and chronic kidney disease risk in middle-aged patients, independent of established metabolic risk factors9.

Types of Uric Acid Tests

Three testing approaches offer different insights into uric acid metabolism.

Blood (Serum) Test

The uric acid blood test is the most common diagnostic tool, measuring uric acid concentration in blood serum. A healthcare provider draws blood from a vein (typically in your inner elbow or back of hand) and sends it to a laboratory for analysis.

The procedure takes just a few minutes and causes minimal discomfort. You can usually eat and drink normally before the test, though certain medications may affect results (discussed below).

Results typically return within one to three days, depending on the laboratory. The uric acid blood test provides a snapshot of your current levels, making it useful for monitoring treatment and tracking changes over time.

24-Hour Urine Collection

The uric acid urine test offers a comprehensive assessment, measuring total uric acid your body excretes over a full day. This test helps determine whether high blood levels result from overproduction or inadequate kidney excretion, information that guides treatment decisions.

You collect all urineproduced during exactly 24 hours in a special container with preservative, storing samples refrigerated. The lab then measures total uric acid in the combined sample.

This uric acid urine test requires more effort but provides valuable metabolic information blood tests can’t reveal. Avoid alcohol during collection (it reduces kidney uric acid excretion) and maintain normal hydration.

At-Home Testing Options

Emerging point-of-care devices enable home monitoring similar to glucose testing for diabetes. These finger-prick devices provide results within minutes.

Dr. Perlmutter recommends the UASure at-home test kit for regular monitoring, suggesting testing each morning before eating with a target reading of 5.5 mg/dL or lower. This approach allows you to track how dietary changes affect your levels over time.

Home testing kits like Jinfiniti’s AgingSOS offer convenience but shouldn’t replace professional medical evaluation when needed. Use it as a monitoring tool between regular checkups.

Understanding Your Test Results

Reference ranges on lab reports can mislead if you don’t understand what “normal” actually means.

Standard Reference Ranges

Laboratory reference ranges typically show:

GenderStandard Range (mg/dL)Alternative Range (µmol/L)
Males2.5-7.0 or 4.0-8.6208-400
Females1.5-6.0 or 3.0-7.1155-400

Mayo Clinic Laboratory sets reference values for males ages 13 and above at 2.7-6.1 mg/dL. These ranges vary slightly among laboratories.

More importantly, they were derived primarily based on gout risk, the point where uric acid begins crystallizing in joints and blood vessels.

The Optimal Level Debate

A significant gap exists between laboratory “normal” ranges and optimal health targets.

Dr. Perlmutter strongly advocates for more stringent targets. “The optimal level is below 5.5, so it’s significantly lower [than 7 mg/dL],” he states. “The cardiometabolic issues begin at 5.5.”

The traditional ranges relate to gout, the point above 7 mg/dL where uric acid precipitates into crystals. But metabolic dysfunction starts well before crystals form.

At Jinfiniti Precision Medicine, founder Dr. Jin-Xiong She explains the importance of this distinction: “We include uric acid in our AgingSOS panels because it serves as an early warning system for metabolic dysfunction. When we see levels creeping above 5.5 mg/dL, even if still within the laboratory reference range, we know cellular metabolism is already being affected. This allows us to intervene before diseases like diabetes or cardiovascular problems develop.”

Dr. Giovanni Desideri and colleagues, writing in European Heart Journal, advocate that “a threshold value < 6.0 mg/dL (< 360 µmol/L) seems to better identify true ‘healthy subjects’ and should reasonably be considered for all subjects.”4

This represents a paradigm shift toward preventive medicine focused on optimal rather than merely “normal” values.

What High Levels Mean

Hyperuricemia is clinically defined as levels exceeding 6.8 mg/dL, the saturation point where urate becomes supersaturated at normal body temperature. Mayo Clinic defines it as greater than 6.0 mg/dL in women and 7.0 mg/dL in men.

A high uric acid level can result from:

  • Overproduction: Diet high in purines, rapid cell turnover (cancer, chemotherapy), genetic factors, or fructose consumption
  • Underexcretion: Impaired kidney function, dehydration, certain medications (diuretics, low-dose aspirin), or metabolic conditions

About 14.6% of US adults (approximately 32.5 million people) have hyperuricemia, though most remain asymptomatic.

What Low Levels Mean

While high levels receive most attention, a low uric acid level can also indicate problems. Ranges below 2.0 mg/dL may suggest:

  • Wilson’s disease (genetic copper metabolism disorder)
  • Fanconi syndrome (kidney tubule dysfunction)
  • Certain medications
  • Low-purine diet combined with high fluid intake

Recent research proposes the concept of “dysuricemia,” recognizing that both excessively high and low levels represent pathological states. At physiological concentrations around 5 mg/dL, uric acid demonstrates antioxidant effects by scavenging free radicals. Above 5.5-6.0 mg/dL, it promotes inflammation and cellular damage.

A low uric acid level may seem harmless, but extremely low values can indicate underlying health conditions requiring medical attention.

🧬 MORE BIOMARKER TESTING

When Should You Get a Uric Acid Test?

Healthcare providers order uric acid tests under specific circumstances:

  • You have unexplained joint pain, particularly sudden severe pain with redness and swelling in your big toe. Recurrent attacks of joint inflammation warrant testing even if previous tests were normal (levels can drop during acute flares).
  • Your doctor monitors you during chemotherapy or radiation. Rapid cell turnover releases large amounts of purines, sometimes causing dangerous spikes requiring intervention.
  • You experience recurrent kidney stones. About 10-15% of kidney stones contain uric acid, and testing helps determine if elevated levels contribute to stone formation.
  • You’re assessing cardiovascular or metabolic risk. Given emerging research on uric acid’s role in heart disease, diabetes, and metabolic syndrome, progressive practitioners include it in comprehensive health assessments.
  • You’re investigating symptoms like blood in urine, frequent urination, sharp back or side pain, or unexplained fatigue that might indicate kidney dysfunction.
  • You have conditions associated with altered uric acid levels: chronic kidney disease, diabetes, hypertension, or metabolic syndrome.

Testing makes particular sense if you’re focused on longevity and healthy aging since uric acid provides early warning of metabolic dysfunction before disease develops.

How to Prepare for the Test

Blood tests generally require no special preparation. You can eat and drink normally before testing.

Certain medications affect results and should be reported to your healthcare provider:

  • Aspirin and other salicylates
  • Ibuprofen and NSAIDs
  • Diuretics (water pills)
  • Niacin supplements
  • Gout medications (allopurinol, probenecid)
  • Some blood pressure medications

Don’t stop prescribed medications without consulting your doctor. Simply inform the provider so they can interpret results appropriately.

For 24-hour urine collection, avoid alcohol during the collection period since it reduces kidney excretion of uric acid. Maintain your normal diet and hydration unless instructed otherwise.

The blood draw itself follows standard venipuncture procedure. After sterilizing the site, the provider wraps an elastic band around your arm to fill veins, inserts a needle to draw blood into vials, then removes the band and needle and applies pressure with a bandage. Minor bruising may occur but typically resolves quickly.

What Affects Uric Acid Levels?

Multiple factors influence your test results beyond underlying health conditions.

Diet and Fructose

Fructose stands out as the primary dietary driver of elevated uric acid. Unlike glucose, fructose metabolism uniquely generates uric acid inside cells through a process that depletes cellular energy (ATP).

Dr. Perlmutter emphasizes this connection: “Uric acid is not just the cause of gout; it is intricately linked with the processes involved in weight gain, fat accumulation.”

Major dietary sources that raise uric acid:

  • High-fructose corn syrup in sodas and processed foods (a single can of regular soda contains about 23 grams of fructose)
  • Table sugar/sucrose (50% fructose content)
  • Fruit juice in large amounts
  • Red meat and organ meats (liver, kidney)
  • Certain seafood (anchovies, sardines, mussels, scallops)
  • Some vegetables (asparagus, spinach)
  • Beer and other alcoholic beverages

Alcohol is particularly problematic because it both increases uric acid production and decreases kidney excretion.

The impact of diet on NAD+ levels and cellular health connects to uric acid metabolism since both involve how your body processes nutrients for energy.

Medications and Supplements

Many common medications affect uric acid levels:

Medications that increase levels:

  • Diuretics (especially thiazides)
  • Low-dose aspirin
  • Niacin
  • Cyclosporine
  • Levodopa

Medications that decrease levels:

  • Allopurinol
  • Febuxostat
  • Probenecid
  • Losartan
  • High-dose vitamin C

Always inform your healthcare provider about all medications and supplements before testing. The effect doesn’t necessarily mean you should stop the medication, just that results should be interpreted in that context.

Medical Conditions

Various health conditions alter uric acid metabolism:

Conditions that increase levels:

  • Chronic kidney disease
  • Diabetes
  • Metabolic syndrome
  • Hypertension
  • Psoriasis
  • Hypothyroidism
  • Certain cancers
  • Obesity

Conditions that decrease levels:

  • Liver disease
  • Wilson’s disease
  • Fanconi syndrome
  • SIADH (syndrome of inappropriate antidiuretic hormone)

Dehydration temporarily concentrates uric acid in blood. Strenuous exercise can cause transient elevations through muscle breakdown and dehydration.

Understanding these factors helps distinguish between concerning chronic elevations and temporary fluctuations. This connects to broader patterns of oxidative stress and metabolic dysfunction that affect multiple body systems.

The Role of Uric Acid Testing in Gout Management

For those with diagnosed gout, uric acid testing guides treatment decisions.

The 2020 American College of Rheumatology guidelines establish a treat-to-target approach with specific recommendations10:

Treatment targets:

  • Standard goal: Below 6 mg/dL for most gout patients
  • Severe disease goal: Below 5 mg/dL for patients with tophi (visible uric acid deposits)
  • Serial monitoring: Regular testing to guide medication dose adjustments

The test isn’t definitive for diagnosing gout, though. Only analyzing joint fluid for monosodium urate crystals conclusively confirms the condition. Synovial fluid analysis using polarized light microscopy shows the characteristic needle-shaped, negatively birefringent crystals.

Key testing considerations for gout:

  • Up to 39% of gout patients show normal uric acid during acute attacks
  • Levels drop temporarily as crystals precipitate from blood into joints
  • Repeat testing or joint fluid analysis may be needed if clinical suspicion remains high
  • Regular monitoring after starting treatment ensures medication effectiveness

Despite clear guidelines, evidence shows delivery of gout care remains suboptimal. A 2015 study found that among Americans with gout receiving urate-lowering therapy, only a minority achieved the target level below 6 mg/dL11. Inadequate dose titration and poor adherence contribute to this treatment gap.

Current Research and Uric Acid’s Dual Nature

Recent research reveals uric acid’s paradoxical properties. At concentrations around 5 mg/dL, it demonstrates protective antioxidant effects by scavenging free radicals. Above 5.5-6.0 mg/dL, it promotes cellular senescence, inflammation, and oxidative damage.

Key findings from genetic studies:

Sophisticated genetic studies using Mendelian randomization (examining genetic variants affecting uric acid levels) have yielded mixed results on causality. Several studies found no direct causal relationship between elevated uric acid and risks of diabetes, coronary heart disease, or stroke.

“The only phenotypes that were causally associated with [hyperuricemia] were gout and kidney disease,” according to a 2024 review. Yet clinical and epidemiological studies consistently link hyperuricemia with cardiovascular disease, fatty liver, hypertension, insulin resistance, and obesity.

This suggests uric acid may be a marker of underlying metabolic dysfunction even if not always the direct cause.

Promising intervention trials:

Clinical trials examining whether lowering uric acid improves outcomes show promise in specific populations. A 2022 meta-analysis of febuxostat (a urate-lowering medication) in chronic kidney disease patients demonstrated significant benefits12:

  • Serum uric acid decreased by 146 µmol/L
  • Kidney function (estimated glomerular filtration rate) improved by 3.21 mL/min
  • Serum creatinine decreased by 15.27 µmol/L
  • Serum urea nitrogen fell by 2.37 mmol/L

This emerging understanding parallels research on cellular senescence and aging, where multiple interconnected processes contribute to metabolic dysfunction rather than single causes.

Interpreting Results: Beyond the Numbers

Your test results tell a story beyond the number on the report.

When treatment may not be needed:

A single elevated reading doesn’t automatically warrant treatment if you have no symptoms or risk factors. The 2020 ACR guidelines conditionally recommend against treating asymptomatic hyperuricemia even with comorbid cardiovascular disease, kidney disease, or hypertension.

Uncertainty remains about whether treating isolated elevation prevents future complications.

When proactive intervention makes sense:

If you’re focused on optimal health and longevity rather than just disease prevention, targeting levels below 5.5 mg/dL makes sense based on current research. This proactive approach aligns with precision medicine principles, addressing dysfunction before disease develops.

What to consider when reviewing your results:

  • Serial measurements provide more value than single readings
  • Trending upward over time signals worsening metabolic function
  • Your full clinical picture matters: family history, cardiovascular risk factors, kidney function, diet quality
  • Other biomarkers of aging provide context

Uric acid represents one piece of the metabolic health puzzle. The comprehensive assessment matters.

That’s why Jinfiniti includes uric acid alongside 27 other biomarkers in the AgingSOS Advanced Panel, providing the full metabolic context needed for truly personalized health optimization.

Test Uric Acid With Jinfiniti’s AgingSOS Panel

Jinfiniti’s AgingSOS Advanced Panel measures uric acid alongside rare biomarkers not routinely tested elsewhere, including intracellular NAD+ and klotho (the longevity protein).

What the comprehensive panel includes:

  • 28 total biomarkers covering multiple health systems
  • Inflammation status markers
  • Oxidative stress measurements
  • Cellular senescence indicators
  • Metabolic health metrics
  • Cardiovascular risk factors

The panel detects issues years before symptoms appear, allowing early intervention. Each test includes a free consultation to review results and develop a personalized optimization plan.

Convenient testing options:

  • Mobile phlebotomy available for at-home blood collection
  • CLIA-certified laboratory processing
  • Results typically within 1-2 weeks
  • Personalized interpretation and recommendations

The TAO approach in action:

The testing philosophy follows Jinfiniti’s TAO approach: Test to establish baseline, Act with targeted interventions based on results, and Optimize through continuous monitoring and adjustment.

Rather than treating individual biomarkers in isolation, the comprehensive panel reveals how systems interact. Your uric acid level makes more sense when viewed alongside inflammation markers, kidney function, metabolic indicators, and cellular health measurements.

Referenced Sources

  1. Zhang, W.-Z. Why Does Hyperuricemia Not Necessarily Induce Gout?Biomolecules vol. 11 280 https://doi.org/10.3390/biom11020280 (2021).
  2. Leiszler, M., Poddar, S. & Fletcher, A. Clinical inquiry. Are serum uric acid levels always elevated in acute gout? Journal of Family Practice 60 10, 618–20 (2011).
  3. Singh, G., Lingala, B. & Mithal, A. Gout and Hyperuricaemia in the USA: Prevalence and Trends. Rheumatology vol. 58 2177–2180 https://doi.org/10.1093/rheumatology/kez196 (2019).
  4. Desideri, G. et al. Is it time to revise the normal range of serum uric acid levels? European Review for Medical and Pharmacological Sciences 18 9, 1295–306 (2014).
  5. Sun, Q. et al. Association Between Serum Uric Acid and Non-Alcoholic Fatty Liver Disease: An Updated Systematic Review and Meta-Analysis. Clinical Epidemiology vol. Volume 15 683–693 https://doi.org/10.2147/clep.s403314 (2023).
  6. Du, L. et al. Hyperuricemia and Its Related Diseases: Mechanisms and Advances in Therapy. Signal Transduction and Targeted Therapy vol. 9 https://doi.org/10.1038/s41392-024-01916-y (2024).
  7. Obermayr, R. P. et al.Elevated Uric Acid Increases the Risk for Kidney Disease. Journal of the American Society of Nephrology vol. 19 2407–2413 https://doi.org/10.1681/asn.2008010080 (2008).
  8. Johnson, R. J. et al. Uric Acid and Chronic Kidney Disease: Which Is Chasing Which?Nephrology Dialysis Transplantation vol. 28 2221–2228 https://doi.org/10.1093/ndt/gft029 (2013).
  9. Zhu, P., Liu, Y., Han, L., Xu, G. & Ran, J. Serum Uric Acid Is Associated with Incident Chronic Kidney Disease in Middle-Aged Populations: A Meta-Analysis of 15 Cohort Studies. PLoS ONE vol. 9 e100801 https://doi.org/10.1371/journal.pone.0100801 (2014).
  10. FitzGerald, J. D. et al. 2020 American College of Rheumatology Guideline for the Management of Gout. Arthritis & Rheumatology vol. 72 879–895 https://doi.org/10.1002/art.41247 (2020).
  11. Juraschek, S. P., Kovell, L. C., Miller, E. R. & Gelber, A. C. Gout, Urate‐Lowering Therapy, and Uric Acid Levels Among Adults in the United States. Arthritis Care & Research vol. 67 588–592 https://doi.org/10.1002/acr.22469 (2015).
  12. Zheng, Y. & Sun, J. Febuxostat Improves Uric Acid Levels and Renal Function in Patients with Chronic Kidney Disease and Hyperuricemia: A Meta-Analysis. Applied Bionics and Biomechanics vol. 2022 1–7 https://doi.org/10.1155/2022/9704862 (2022).
A nurse preparing an older man for a CRP blood test.

C-Reactive Protein (CRP) Levels: Normal, High and When to Test

C-reactive protein is produced by your body whenever there is inflammation. It’s an acute phase protein, which means it increases quickly in response to a problem and then subsides once the issue is resolved.

By knowing your CRP, you get an idea of sub-clinical inflammation that’s silently undermining your cardiovascular system. The difference between 0.5 mg/L and 3.5 mg/L could be years of healthy life.

What You Should Know

  • CRP below 1.0 mg/L indicates low cardiovascular risk, while levels above 3.0 mg/L signal high risk
  • Your liver produces CRP within 6 to 8 hours of detecting inflammation anywhere in your body
  • Diet changes and weight loss can reduce CRP levels by 30-40% in just weeks
  • Testing CRP alongside cholesterol provides a more complete picture of heart disease risk than cholesterol alone

What is C-Reactive Protein?

C-reactive protein is a ring-shaped molecule your liver manufactures in response to inflammatory signals. When cells detect injury, infection, or chronic stress, they release chemical messengers called cytokines.

Interleukin-6 (IL-6) is the primary trigger for CRP production. Your liver can ramp up CRP synthesis up to 1,000-fold within 48 hours of receiving these distress signals.

CRP binds to damaged cells and certain bacteria, marking them for removal by your immune system. This tagging process activates the complement system, a cascade of proteins that destroys invaders and clears cellular debris.

Why CRP Levels Matter for Your Health

Research over three decades has shown that atherosclerosis (the plaque buildup behind most heart attacks and strokes) is fundamentally an inflammatory disease. CRP doesn’t just reflect this inflammation; it actively participates in the disease process.

High CRP levels correlate with increased risk of heart attacks, strokes, and early death from cardiovascular causes. A 30-year study following nearly 28,000 initially healthy women found that CRP was the strongest predictor of cardiovascular events[1].

Women with the highest CRP levels had a 70% increased risk of major cardiovascular events compared to those with the lowest levels. This surpassed the predictive value of both LDL cholesterol (36% increased risk) and lipoprotein(a) (33% increased risk).

Large-scale meta-analyses confirm that each three-fold higher CRP concentration associates with significantly increased risks for coronary heart disease, ischemic stroke, and vascular mortality[2].

The Inflammation Connection

Dr. Paul Ridker, director of the Center for Cardiovascular Disease Prevention at Brigham and Women’s Hospital, explains the significance: “We’ve known for 30 years that inflammation and hyperlipidemia conspire with each other to really drive atherosclerotic disease. What’s changed is, we now have both a reliable biomarker and therapeutic proof of principle that we can target inflammation per se and lower cardiovascular event rates.”

CRP directly harms blood vessels by reducing nitric oxide availability[3]. This impairs normal vessel dilation and increases arterial stiffness, creating conditions where oxidative stress and plaque instability flourish.

Your body produces CRP through a complex signaling pathway. Fat tissue (adipocytes) releases IL-6, which travels to your liver and activates transcription factors that switch on CRP gene expression.

Comprehensive Health Assessment

Test your hs-CRP with 27 other longevity markers.

Jinfiniti AgingSOS green gradient background

Normal CRP Ranges (What the Numbers Mean)

The American Heart Association and CDC established standardized risk categories for interpreting CRP results:

  • Low risk: Less than 1.0 mg/L
  • Average risk: 1.0 to 3.0 mg/L
  • High risk: Above 3.0 mg/L

Most healthy adults have CRP concentrations between 0.8 and 3.0 mg/L. Women typically show slightly higher baseline levels than men.

Values above 10 mg/L usually indicate acute infection or illness rather than chronic cardiovascular inflammation. If your test shows CRP above 10 mg/L, your doctor should retest after two weeks to rule out temporary spikes from infections.

The difference between standard CRP and high-sensitivity CRP (hs-CRP) testing matters. Standard CRP measures levels from 8 to 1,000 mg/L for detecting acute infections. High-sensitivity CRP detects much lower concentrations (0.3 to 10 mg/L), making it suitable for cardiovascular risk assessment.

What Causes High CRP Levels?

Your CRP levels reflect the total inflammatory burden your body carries. Multiple factors can push these numbers higher, from extra body weight to chronic infections.

Understanding what drives your CRP up helps you target interventions effectively.

Lifestyle Factors That Raise CRP

Several modifiable lifestyle factors push CRP higher:

  • Excess body weight: People with obesity show 3 to 4 times higher odds of having CRP above 2 mg/L compared to those at healthy weights[4]. Every pound of excess fat tissue produces IL-6, creating a feedback loop where inflammation promotes fat storage and fat storage amplifies inflammation.
  • Smoking: Current smokers have about 2 to 2.5 times higher odds of elevated CRP compared to nonsmokers, with the effect being strongest in people with lower body weight[5].
  • Physical inactivity: Sedentary individuals consistently show higher CRP than those who exercise regularly, even after accounting for body weight differences[6]. Movement matters for keeping inflammation in check.

Health Conditions Linked to Elevated CRP

Various health conditions drive CRP higher:

  • Metabolic dysfunction: High triglycerides, elevated LDL cholesterol, diabetes, and hypertension all associate with increased CRP concentrations[7].
  • Chronic inflammatory conditions: Rheumatoid arthritis, inflammatory bowel disease, and psoriasis naturally elevate CRP as part of the disease process. Autoimmune disorders create persistent immune activation that keeps CRP chronically high[8].
  • Infections: Both acute and chronic infections trigger CRP production as your body fights off pathogens[9]. This is why doctors often order CRP tests to monitor bacterial infections and their response to antibiotics.
  • Cellular aging: Damaged cells that should die accumulate instead, releasing inflammatory chemicals that stimulate CRP production.

When Should You Get a CRP Blood Test?

The 2019 ACC/AHA guidelines recommend considering hs-CRP testing in people at intermediate cardiovascular risk (7.5% to 20% 10-year risk). When hs-CRP measures 2 mg/L or higher, it supports more intensive preventive interventions.

Two measurements taken about two weeks apart provide more reliable results than a single test. Your CRP can fluctuate based on recent infections, injuries, or stress, so averaging two readings captures your true baseline.

Testing makes the most sense when results will actually change your treatment plan. If you’re already taking statins and following heart-healthy habits, knowing your CRP may not alter your approach.

Who Benefits Most from Testing

Certain groups gain the most actionable information from CRP testing:

  • People with intermediate cardiovascular risk: If traditional risk calculators place you in a gray zone where treatment decisions feel uncertain, CRP can tip the scales.
  • Those with metabolic syndrome or prediabetes: CRP predicts progression from prediabetes to full diabetes and helps identify who needs more aggressive lifestyle intervention.
  • Anyone with unexplained symptoms: Chronic fatigue, joint pain, or other signs suggesting hidden inflammation benefit from baseline CRP measurement. This establishes a starting point for tracking whether interventions work.

Dr. Jin-Xiong She, founder of Jinfiniti Precision Medicine, emphasizes the importance of comprehensive testing: “Measuring CRP alongside other biomarkers like NAD+ levels and oxidative stress markers gives us a complete picture of cellular health. When we see elevated CRP, we’re not just treating a number. We’re addressing the root causes of accelerated aging at the cellular level.”

🧬 MORE BIOMARKERS

How to Lower Your CRP Levels

Reducing CRP requires addressing its upstream causes. Multiple approaches work, often more powerfully in combination than alone.

The beauty of CRP as a marker is that you can retest after interventions to see if your efforts are working.

Diet Changes That Work

Mediterranean-style eating patterns show the most consistent anti-inflammatory effects. A randomized trial in people with newly diagnosed type 2 diabetes found CRP fell by 37% after one year on a Mediterranean diet, while remaining unchanged on a low-fat diet[10].

The components that produce the strongest effects include:

  • Daily vegetables: At least 2 servings per day
  • Fresh fruit: 3 pieces daily
  • Fish and seafood: At least 3 times weekly
  • Olive oil: Your primary fat source provides anti-inflammatory polyphenols
  • Whole food fiber: Lowers CRP more effectively than fiber supplements
  • Omega-3 fatty acids: From fish, these reduce inflammatory signaling through multiple pathways

Limiting refined carbohydrates and added sugars helps. These foods spike blood sugar and insulin, which activates inflammatory pathways and increases fat accumulation.

🧬 Learn more about anti-aging foods that fight inflammation.

Exercise and Weight Management

Regular physical activity reduces CRP even without weight loss, though the combination works best. Research shows meaningful results:

  • Fitness improvements of 5 to 15% in VO₂max: Produced nearly 30% CRP reduction in a year-long study of previously sedentary postmenopausal women[11]
  • Exercising more than 195 minutes per week: Achieved significantly greater CRP reductions than exercising less
  • Weight loss through caloric restriction: People who lost more than 2% body fat showed significant CRP decreases, with greater fat loss producing larger reductions

The combination of exercise plus caloric restriction works better than either alone. Studies show this combined approach effectively decreased CRP, IL-6, and TNF-α in overweight adults with active lifestyles[12].

Getting Your CRP Tested

Your doctor can order either standard CRP or high-sensitivity CRP (hs-CRP) through routine blood work. For cardiovascular risk assessment, request hs-CRP specifically since it measures the lower concentrations relevant for heart disease prediction.

Testing details:

  • No preparation needed: Fasting or non-fasting states both work fine for hs-CRP measurement
  • Quick results: Typically return within a few days
  • Context matters: Your doctor will interpret them alongside your other risk factors, not in isolation

Recommended testing frequency depends on your cardiovascular risk profile:

  • Average-risk individuals: Every 3 to 5 years starting at age 20
  • High-risk people: Annual or more frequent monitoring

Comprehensive biomarker panels like AgingSOS measure CRP alongside other aging biomarkers including NAD+ levels, senescence markers, and oxidative stress indicators. This approach identifies multiple targets for intervention rather than focusing on inflammation alone.

Referenced Sources

  1. Ridker PM, Moorthy MV, Cook NR, Rifai N, Lee IM, Buring JE. Inflammation, Cholesterol, Lipoprotein(a), and 30-Year Cardiovascular Outcomes in Women. Massachusetts Medical Society; 2024. https://doi.org/10.1056/nejmoa2405182
  2. C-reactive protein concentration and risk of coronary heart disease, stroke, and mortality: an individual participant meta-analysis. Elsevier BV; 2010. https://doi.org/10.1016/s0140-6736(09)61717-7
  3. Kirkgöz K. C-Reactive Protein in Atherosclerosis—More than a Biomarker, but not Just a Culprit. IMR Press; 2023. https://doi.org/10.31083/j.rcm2410297
  4. Ray KK, Reuter SB, Dalbeler A, Faurby MD, Letnar G, Mathisen J, et al. Factors associated with elevated high-sensitivity C-reactive protein levels in individuals with atherosclerotic cardiovascular disease in the USA and the UK. Oxford University Press (OUP); 2025. https://doi.org/10.1093/eurjpc/zwaf609
  5. O’Loughlin J, Lambert M, Karp I, McGrath J, Gray-Donald K, Barnett T, et al. Association between cigarette smoking and C-reactive protein in a representative, population-based sample of adolescents. Oxford University Press (OUP); 2008. https://doi.org/10.1080/14622200801901997
  6. Esteghamati A, Morteza A, Khalilzadeh O, Anvari M, Noshad S, Zandieh A, et al. Physical Inactivity Is Correlated with Levels of Quantitative C-reactive Protein in Serum, Independent of Obesity: Results of the National Surveillance of Risk Factors of Non-communicable Diseases in Iran. Springer Science and Business Media LLC; 2012. https://doi.org/10.3329/jhpn.v30i1.11278
  7. Miller M, Zhan M, Havas S. High Attributable Risk of Elevated C-Reactive Protein Level to Conventional Coronary Heart Disease Risk Factors. American Medical Association (AMA); 2005. https://doi.org/10.1001/archinte.165.18.2063
  8. Banait T, Wanjari A, Danade V, Banait S, Jain J. Role of High-Sensitivity C-reactive Protein (Hs-CRP) in Non-communicable Diseases: A Review. Springer Science and Business Media LLC; 2022. https://doi.org/10.7759/cureus.30225
  9. Sproston NR, Ashworth JJ. Role of C-Reactive Protein at Sites of Inflammation and Infection. Frontiers Media SA; 2018. https://doi.org/10.3389/fimmu.2018.00754
  10. Maiorino MI, Bellastella G, Petrizzo M, Scappaticcio L, Giugliano D, Esposito K. Anti-inflammatory Effect of Mediterranean Diet in Type 2 Diabetes Is Durable: 8-Year Follow-up of a Controlled Trial. American Diabetes Association; 2016. https://doi.org/10.2337/dc15-2356
  11. Campbell PT, Campbell KL, Wener MH, Wood BL, Potter JD, McTiernan A, et al. A Yearlong Exercise Intervention Decreases CRP among Obese Postmenopausal Women. Ovid Technologies (Wolters Kluwer Health); 2009. https://doi.org/10.1249/mss.0b013e31819c7feb
  12. Liu Y, Hong F, Lebaka VR, Mohammed A, Ji L, Zhang Y, et al. Calorie Restriction With Exercise Intervention Improves Inflammatory Response in Overweight and Obese Adults: A Systematic Review and Meta-Analysis. Frontiers Media SA; 2021. https://doi.org/10.3389/fphys.2021.754731

Account Access

Welcome back

Continue your health journey with a secure login.