
Secure • Private • Science-backed
A woman compares her body age to her chronological age

What Does Body Age Mean and Can You Actually Lower It?

You’ve probably come across it somewhere: a gym scale that spits out a “metabolic age,” a wellness quiz that tells you your body is 43 when your actual age is 37, or an app that promises to calculate your “real age” from a few health inputs. Most people notice the number, feel vaguely curious or vaguely alarmed, and move on without really understanding what it represents.

Body age — also called biological age — is a genuinely useful concept. The problem is that most of the tools that introduce people to it are measuring something much simpler than what the science actually describes.

The real version is worth understanding, because it’s considerably more specific — and more useful — than what those quizzes deliver.

The Short Summary

  • Body age reflects how fast your cells are actually aging, not how long you’ve been alive.
  • Most consumer body age calculators compare your health metrics to population averages — they’re not measuring cellular aging directly.
  • The biomarkers most closely linked to true biological aging include DNA methylation patterns, telomere length, chronic inflammatory load, and intracellular NAD+ levels.
  • Body age can diverge from chronological age in both directions, and several of the markers driving that gap are directly measurable and addressable.

CLIA-Certified Blood Panel

48 biomarkers that reveal your cellular age from home.

Jinfiniti AgingSOS green gradient background

Body Age Is Not What Most Calculators Are Measuring

There’s a real concept hiding inside most body age tools. But what those tools actually calculate is a different, much blunter thing.

Chronological Age vs. Body Age

Chronological age is the number of years you’ve been alive. It’s also the number that shows up as a primary risk factor in most clinical guidelines for chronic disease. That correlation is real — the longer you’ve been alive, the more accumulated cellular damage you’re likely to carry.

But it’s an average, not a certainty. Two people born the same year can be in meaningfully different cellular condition. Same genetic background, similar lifestyle choices, and one of them is functioning five years ahead of their age on the inside. The other is behind. Chronological age can’t tell you which one you are.

Body age — also called biological or physiological age — reflects the actual condition of your cells and tissues. It accounts for accumulated cellular damage, DNA expression patterns, genetic factors, how well your metabolic systems are running, and a range of other things a birthday can’t capture. It’s closer to what’s actually happening in your body right now.

What Most Body Age Tools Actually Do

The majority of body age calculators — from gym scales to wellness apps to some online “biological age” tests — work by comparing your health metrics against population averages for your age group. If your blood pressure, cholesterol, BMI, or resting heart rate sit above the average for your demographic, your body age score comes back older. Below average, and it comes back younger.

This isn’t useless. Risk factor awareness matters. But comparing your numbers to a population average is not the same thing as measuring how fast your cells are actually aging. Two people with identical risk factor scores can have meaningfully different biological ages at the cellular level. That’s why researchers have spent decades developing more specific measurement tools.

If persistent fatigue or low energy has you questioning whether your standard labs are giving you the full picture, there are specific biomarkers that standard blood tests routinely miss.

What’s Actually Happening Inside Your Cells

Real biological aging shows up at the molecular level: chemical marks accumulating on DNA, protective caps wearing down at the ends of chromosomes, inflammatory signals building in tissue, cellular energy systems losing efficiency. These are the mechanisms behind the aging process, and they’re what precision measurement actually tracks.

DNA Methylation and the Epigenetic Clock

Every time your cells divide, small chemical compounds called methyl groups attach to specific sites on your DNA. This process — DNA methylation — doesn’t alter your genetic sequence. What it does is change how genes are expressed, turning some on and some off. Over time, those methylation patterns shift in ways that correlate strongly with aging.

Researchers have used this to build what are called epigenetic clocks: models that estimate biological age from methylation data collected at hundreds or thousands of genomic sites. The best-known include the Horvath clock, PhenoAge, and GrimAge.

A 2022 review in Ageing Research Reviews concluded that these clocks correlate with morbidity, mortality, and age-related disease risk, and that they respond measurably to lifestyle interventions.[1]

Epigenetic clocks are currently the most validated single-marker approach to estimating biological age.

Telomere Length and Cellular Wear

Telomeres are the protective sequences at the ends of chromosomes — think of the plastic tips on shoelaces. Each time a cell divides, those tips get slightly shorter. When they get too short, the cell either stops dividing or initiates a stress response.

Shorter telomeres track with higher rates of age-related disease and earlier mortality. A 2021 review in Frontiers in Genetics found that telomere length is most informative when used alongside other biomarkers rather than as a standalone measure — as a single data point, it gives only a rough estimate of aging rate.[2]

No single marker tells the whole story. Multi-marker approaches consistently outperform single tests in research on biological age, and this is a good example of why.

Inflammation and Cellular Senescence

As cells age, some stop dividing but don’t die. These senescent cells, sometimes called “zombie cells,” don’t just go quiet. They secrete a mix of inflammatory proteins called the senescence-associated secretory phenotype (SASP) that can push neighboring cells toward the same state. The result is a kind of chronic, low-grade systemic inflammation researchers call “inflammaging.”

A 2023 review in Signal Transduction and Targeted Therapy describes inflammaging as one of the core drivers of biological aging, with direct connections to neurodegeneration, cardiovascular disease, and metabolic decline. The accumulation of senescent cells and the inflammatory load they produce is one of the clearest signs that body age is pulling ahead of chronological age.[3]

NAD+ Decline and Cellular Energy

NAD+ (nicotinamide adenine dinucleotide) is a molecule your cells rely on to produce energy, repair DNA, and regulate hundreds of metabolic processes. It declines steadily with age, with measurable drops often starting in the 30s.

That decline matters because NAD+ is involved in several biological aging pathways simultaneously. Lower NAD+ means less capacity for mitochondrial energy production, slower DNA repair, and upregulated inflammatory signaling.

A systematic review covering 147 studies in Experimental Gerontology found that declining NAD+ levels track closely with age-related degenerative processes, and that restoring those levels produces measurable effects in both preclinical and early clinical research.[4]

What makes NAD+ worth particular attention here is that it’s directly measurable. Unlike some aging biomarkers that require tissue biopsy or complex genomic analysis, intracellular NAD+ can be assessed from a blood sample — a clear readout of where that specific pathway stands.

If you want context on how mitochondrial supplements factor into cellular energy production, that’s a useful place to start.

How Body Age Is Actually Measured

The gap between a gym scale readout and a clinical biological age assessment is significant. Here’s what more precise measurement actually involves.

Epigenetic Clock Testing

Dedicated epigenetic age tests analyze DNA methylation patterns from a blood or saliva sample, then run the data through an established clock algorithm to generate a biological age estimate. These tests are more expensive than standard bloodwork, and predictive accuracy varies by which model is used.

A 2025 review in Frontiers in Cardiovascular Medicine notes that advances in omics technologies and biomarker research are improving the precision of biological aging assessments, with integration of multiple data streams producing more accurate and useful results than any single marker alone.[5]

Blood Biomarker Panels

Comprehensive blood panels that include inflammatory cytokines, senescence markers, NAD+ levels, longevity proteins like Klotho, and metabolic indicators give a multi-system picture of where biological aging actually stands. The value comes from looking across pathways — not just one.

A panel that measures only one or two markers will miss most of what’s driving body age. The hallmarks of aging interact with each other. Mitochondrial dysfunction drives NAD+ depletion. Cellular senescence amplifies inflammatory load. Inflammaging suppresses NAD+ metabolism. A single data point doesn’t give you an accurate picture.

What Makes a Biomarker Worth Measuring

Researchers use fairly specific criteria to evaluate aging biomarkers: they should predict health outcomes better than chronological age alone, reflect the actual mechanisms of aging rather than secondary effects of disease, be measurable repeatedly without harm, and respond to interventions in a trackable way.

Biomarkers that meet these criteria — including epigenetic methylation patterns and intracellular NAD+ — are the ones that generate useful information.

Understanding how to test NAD+ levels is a reasonable first step for anyone starting to explore their own cellular picture.

What Affects Your Body Age — and How to Improve It

The factors that drive body age aren’t abstract — they operate directly on the cellular mechanisms described above. Here’s what the research actually supports, and how to improve your body age across each lever.

How to Improve Your Body Age

Exercise

  • Regular physical activity supports telomere maintenance and lowers systemic inflammatory markers.
  • Resistance training improves body composition, helps preserve muscle mass, and supports NAD+ metabolic efficiency.
  • Regular exercise at moderate intensity — around 150 minutes per week — shows measurable effects on epigenetic aging patterns in clinical studies.

Sleep quality

  • Chronic sleep disruption is one of the fastest accelerants of epigenetic aging in the literature.
  • Poor sleep elevates inflammatory cytokines, which compounds senescent cell accumulation over time.
  • Consistent, restorative sleep is one of the few lifestyle choices that moves multiple aging pathways at once.

Diet and metabolic health

  • A balanced diet low in processed foods and refined sugars and high in vitamins and minerals reduces body fat and lowers chronic inflammatory load directly.
  • Caloric restriction and intermittent fasting show effects on NAD+ metabolism and cellular autophagy — the process by which cells clear out damaged components.
  • Blood sugar dysregulation accelerates glycation damage independently of other risk factors, adding measurable years to biological age on its own.

Stress management

  • Prolonged psychological stress correlates with accelerated telomere shortening and elevated senescence markers.
  • Chronic cortisol elevation suppresses NAD+-dependent repair mechanisms over time.
  • Exercise, sleep, and mindfulness all show overlapping effects on inflammatory and epigenetic aging markers — managing stress and managing body age are the same project.

NAD+ support

  • NAD+ can be measured directly, which means it’s one area where you can verify whether an intervention is actually working rather than assuming it is.
  • Unlike most lifestyle interventions, targeted NAD+ precursor supplementation allows you to track a specific molecular readout before and after — not just how you feel.

Why Measuring Before Acting Matters

Most people try things and hope for improvement. That’s reasonable as far as it goes — but it doesn’t tell you which pathways are actually depleted in your particular biology.

Someone with measurably low NAD+ and normal inflammatory markers has a different cellular picture from someone with elevated senescence markers and adequate NAD+. The right approach for each is different. Without a baseline, you’re applying a generic strategy to a specific problem — and you won’t know whether it worked.

🧬 RELATED READING

Getting a Clearer Picture of Your Body Age

The question people are really asking when they encounter body age calculators is: is my body holding up the way it should be? The frustration isn’t with the question. It’s that most available tools aren’t built to actually answer it.

A longevity panel like AgingSOS that includes NAD+, senescence markers, inflammatory cytokines, Klotho, and metabolic indicators doesn’t just return a number. It shows which specific systems need attention, which are functioning within range, and where to start.

“Most people come to us after they’ve already tried the obvious answers,” says Dr. Jin-Xiong She, founder of Jinfiniti Precision Medicine. “What body age really means at the cellular level is whether your systems are being maintained, or are slowly losing ground. Testing gives you that answer. Without it, you’re managing your health without knowing which problem you’re actually solving.”

Body age as a concept only becomes useful when you can measure the things behind it. A quiz score doesn’t change anything. Knowing your NAD+ is suboptimal, your inflammatory markers are elevated, or your Klotho is low — that gives you somewhere to start.

Frequently Asked Questions

What Is the Difference Between Body Age and Biological Age?

The terms are used interchangeably in most contexts. Body age and biological age both refer to how your cells and tissues are functioning compared to chronological age norms. “Body age” tends to appear in consumer-facing tools (gym scales, apps), while “biological age” is more common in clinical and research settings. Same concept, different context.

Can Body Age Be Lower Than Your Chronological Age?

Yes, and it happens more than people expect. People with consistently healthy habits, well-maintained NAD+ levels, low chronic stress, and good sleep regularly show biological ages below their chronological age on panel testing. The relationship between how long you’ve lived and how fast you’ve aged is not fixed.

What Is a Normal Body Age?

There’s no single universal standard. Biological age assessments compare your markers to reference ranges built from population data. The specific number matters less than whether your key markers are trending in the right direction — and whether the interventions you’re making are actually moving them.

Can You Reverse Your Body Age?

The evidence supports slowing the rate of biological aging and, in some cases, improving specific markers meaningfully. “Reversing” is probably stronger language than most clinical research warrants. Epigenetic clocks have shown responsiveness to lifestyle and supplementation interventions in controlled studies.

What Is the Most Accurate Way to Measure Body Age?

Epigenetic clock testing is currently the most validated single approach. In practice, multi-marker blood panels that include NAD+, inflammatory cytokines, senescence markers, and longevity proteins like Klotho give a more complete and useful picture than any single test. The goal isn’t a single number — it’s understanding which systems are on track and which need attention.

  1. Duan R, Fu Q, Sun Y, Li Q. Epigenetic clock: A promising biomarker and practical tool in aging. Elsevier BV; 2022. https://doi.org/10.1016/j.arr.2022.101743
  2. Vaiserman A, Krasnienkov D. Telomere Length as a Marker of Biological Age: State-of-the-Art, Open Issues, and Future Perspectives. Frontiers Media SA; 2021. https://doi.org/10.3389/fgene.2020.630186
  3. Li X, Li C, Zhang W, Wang Y, Qian P, Huang H. Inflammation and aging: signaling pathways and intervention therapies. Springer Science and Business Media LLC; 2023. https://doi.org/10.1038/s41392-023-01502-8
  4. Braidy N, Liu Y. NAD+ therapy in age-related degenerative disorders: A benefit/risk analysis. Elsevier BV; 2020. https://doi.org/10.1016/j.exger.2020.110831
  5. Sanada F, Hayashi S, Morishita R. Targeting the hallmarks of aging: mechanisms and therapeutic opportunities. Frontiers Media SA; 2025. https://doi.org/10.3389/fcvm.2025.1631578
A man with chronic fatigue who is tired all the time

Tired All the Time? 7 Causes of Fatigue Blood Tests Miss

You did everything right. You booked the appointment. You sat through the blood draw. You waited a week. And then the result came back: everything looks normal.

That word — normal — should have been a relief. Instead, for a lot of people, it’s quietly devastating. Because you still feel unexplained fatigue all the time. You wake up tired, drag yourself through the day, and can’t figure out why. Your doctor has no new answers, and you’re starting to wonder if it’s all in your head.

It isn’t. And the most likely explanation isn’t that nothing is wrong — it’s that standard blood tests may have missed what’s actually making you feel tired all the time.

The Short Summary

  • Standard blood panels screen for disease, not for whether your cells are producing energy efficiently
  • Several common causes of persistent fatigue fall within “normal” reference ranges but below the threshold needed for you to feel well
  • Some causes — like sleep apnea, depression, and chronic stress — are entirely invisible to blood tests
  • NAD+ (nicotinamide adenine dinucleotide), a key molecule in cellular energy production, isn’t measured by any standard panel

CLIA-Certified Blood Panel

The panel that goes deeper than standard blood tests.

Jinfiniti AgingSOS green gradient background

What Standard Blood Tests Actually Check

Before going further, it’s worth understanding what a routine fatigue workup is actually built to do — because that context changes how you read a “normal” result.

The standard panel most doctors order includes a Complete Blood Count (CBC), a Comprehensive Metabolic Panel (CMP), thyroid-stimulating hormone (TSH), ferritin, vitamin B12, vitamin D, and sometimes HbA1c (a three-month average of blood sugar levels). Together, these tests are good at catching overt disease: anemia, hypothyroidism, diabetes, kidney or liver dysfunction, and nutritional deficiencies that have progressed to clinical levels.

The Standard Fatigue Panel

TestWhat It Screens For
CBCAnemia, infection, blood disorders
CMPBlood sugar, kidney and liver function, electrolytes
TSHThyroid disease
FerritinIron-deficiency anemia
Vitamin B12B12 deficiency anemia
Vitamin DSevere deficiency
HbA1cDiabetes and prediabetes

This is a solid starting point. But it’s a disease-detection toolkit, not a cellular function assessment.

What “Normal” Actually Means

A “normal” result means your values fall within a statistical reference range — typically derived from the middle 95% of a large population. That range is deliberately wide. Someone at the bottom of the normal range for ferritin and someone at the top both receive the same “normal” result, but they may feel very different.

Normal doesn’t mean optimal. For many people, the gap between those two things is exactly where their fatigue lives.

7 Causes of Tiredness Standard Blood Tests Miss

Standard panels catch a real but limited slice of the reasons people feel chronically depleted. Here are the causes that consistently fall through.

The first four tend to show up in blood work — just not in a way that flags as a problem. The last three don’t reliably appear on standard blood tests at all.

1. Low Ferritin

Ferritin is a protein that stores iron in your body. Most labs flag ferritin as abnormal only when it drops below 12–15 ng/mL — but research shows that many people experience significant fatigue when ferritin falls below 30–50 ng/mL, even when their CBC looks fine and they don’t technically have anemia. The cells aren’t getting enough oxygen for efficient energy production. The test says normal; the person feels drained.[1]

If you haven’t been given your actual ferritin number — just told it’s “fine” — it’s worth asking.

2. Subclinical Thyroid Dysfunction

TSH, the standard thyroid test, measures a signal hormone from the pituitary gland. It’s a useful screen, but it doesn’t tell you how much active thyroid hormone your cells are actually receiving. Free T3 — the form of thyroid hormone that directly fuels cellular metabolism — can be low-normal while TSH looks completely unremarkable. This pattern, sometimes called subclinical or cellular hypothyroidism, is a recognized but frequently overlooked contributor to fatigue, brain fog, and cold intolerance.

A full thyroid panel that includes Free T3 and Free T4 gives a more complete picture than TSH alone.

3. Vitamin D and Magnesium Deficiency

Both are measured in serum — meaning the amount circulating in your bloodstream — which may not reflect what’s actually available inside your cells. Someone can test technically “normal” while their tissues are functionally deficient.

Vitamin D plays a role in mitochondrial function (the process your cells use to generate energy), and low levels are strongly associated with fatigue and muscle weakness.[2]

Magnesium is a required cofactor for more than 300 enzymatic reactions, many of them directly involved in energy metabolism. Serum magnesium in the lower third of the reference range often signals a functional deficit, even when it isn’t flagged.[3]

4. Early Insulin Resistance

HbA1c and fasting glucose are designed to detect diabetes and prediabetes — conditions that develop after years of blood sugar dysregulation. But early insulin resistance, where cells are becoming less responsive to insulin and struggling to use glucose for energy efficiently, can drive significant afternoon fatigue and brain fog years before those numbers shift. Fasting insulin is a more sensitive early marker, but it isn’t part of a standard fatigue panel.

If your energy reliably crashes after meals or in the mid-afternoon, this is worth raising with your clinician.

5. Sleep Apnea, Depression, and Chronic Stress

These three causes have something important in common: a standard blood test isn’t the right tool to find them. They’re not subclinical versions of things the test measures — they’re outside what the test is designed to see.

Sleep apnea affects an estimated 26% of adults between ages 30 and 70, and up to 80% of cases go undiagnosed. The mechanism is straightforward: breathing repeatedly pauses during sleep, preventing the deep restorative sleep your body needs.

Someone with sleep apnea can spend eight hours in bed and wake up as exhausted as when they went to sleep. It’s diagnosed through a sleep study, not blood work. Classic warning signs include waking unrefreshed, snoring, morning headaches, or a partner who has noticed pauses in your breathing.

Depression and anxiety cause genuine physical fatigue, not just low mood. The exhaustion is physiologically real, tied to impaired energy metabolism and disrupted sleep architecture, and it won’t appear on a CBC or CMP. If persistent tiredness comes alongside loss of motivation, a flat or anxious mood, or difficulty finding enjoyment in things you used to enjoy, it’s worth raising as a primary cause — not an afterthought.

Chronic stress operates similarly. Sustained high cortisol disrupts sleep quality and drains energy reserves over time. A 24-hour cortisol test (typically saliva or urine) can reveal patterns that a single-point blood draw misses, but this is rarely included in a standard workup.[4]

6. Chronic Fatigue Syndrome and Fibromyalgia

Both conditions are clinical diagnoses made after ruling other causes out — no standard blood test diagnoses either. In Chronic Fatigue Syndrome (also called ME/CFS, or myalgic encephalomyelitis), the hallmark is profound exhaustion that doesn’t improve with rest and worsens after physical or mental activity.

In fibromyalgia, widespread musculoskeletal pain and fatigue are the defining features. When a panel comes back completely normal and the fatigue is still there, these diagnoses deserve serious consideration.

The absence of blood test findings isn’t reassurance in these cases. It’s the limit of what the test can tell you.

7. Low NAD+

NAD+ (nicotinamide adenine dinucleotide) is a coenzyme found in every cell in your body. It’s the central molecule in the process that converts food into ATP — adenosine triphosphate, the form of energy your cells actually run on. Without adequate NAD+, that conversion becomes inefficient. Cells produce less energy. You feel it.

Research published in EMBO Molecular Medicine establishes that NAD+ depletion is directly implicated in a range of age-related conditions — and that NAD+ levels decline measurably with age, often beginning in the 30s.[5]

A separate study mapping real-world NAD+ levels across age and gender found that decline tracks closely with the energy and recovery symptoms people commonly report as they age.[6]

No standard blood panel includes intracellular NAD+ — the NAD+ inside your cells, where it actually does its work. That means even a complete workup can come back entirely normal while your cellular energy machinery is running well below capacity.

As Dr. Jin-Xiong She, founder of Jinfiniti Precision Medicine and researcher with over 400 peer-reviewed publications, puts it: “Standard blood tests were designed to find what’s wrong. What they can’t tell you is whether your cells are generating the energy they’re capable of. That’s a different question entirely — and for many patients with persistent fatigue, it’s the right one to ask.”

The common signs of NAD+ deficiency — fatigue that isn’t resolved by sleep, brain fog, slower recovery from exercise or stress, and disrupted sleep — look identical to “everything is normal” fatigue. Because to a standard panel, it is.

What to Check Next

The goal here isn’t to run every possible test at once. It’s to work through the most likely causes in a logical order, so you’re not flying blind and not spending money on tests that won’t move the needle.

There’s a meaningful difference between testing everything and testing the right things in the right sequence.

Step 1: Review the Standard Blood Panel

Not all routine panels include ferritin, Free T3, vitamin D, HbA1c, and fasting insulin. Ask for your actual numbers — not just “normal/abnormal” — and look at where they fall within the range. Ask specifically about Free T3 if thyroid function was tested.

Step 2: Consider What the Standard Panel Can’t Catch

CauseWhat to Do
Sleep apneaAsk about a home sleep study if you wake unrefreshed or snore
Depression / anxietyRaise it with your clinician as a possible primary cause
Chronic stressAsk about 24-hour cortisol testing if stress is sustained
CFS / fibromyalgiaDiscuss diagnostic criteria if fatigue has persisted over 6 months

Step 3: Expand Your Diagnostic Search

If conventional labs are clear and the causes above don’t fit your picture, the next logical step is measuring NAD+ — directly. Jinfiniti’s Intracellular NAD® Test is an at-home finger-prick test with CLIA-certified results in about one week. It measures the NAD+ inside your cells, not just in plasma — which is where function actually happens.

Based on clinical research, optimal intracellular NAD+ falls between 40–100 μM. Most adults who haven’t been supplementing test below that range. In a clinical trial of Jinfiniti’s Vitality↑® NAD+ Booster, 85% of participants reached optimal NAD+ levels within four weeks, with an average doubling of intracellular NAD+. If you’re still tired after 8 hours of sleep and every standard test has come back clean, this is where the answer is most likely waiting.

For a broader view of cellular health, the AgingSOS® Advanced Panel includes NAD+ alongside 27 additional biomarkers — inflammation markers, senescence indicators, cardiovascular risk factors, and more — that don’t appear in a standard workup but can meaningfully clarify what’s driving persistent fatigue.

🧬 RELATED READING

Frequently Asked Questions

Can blood tests be normal and still miss the cause of fatigue?

Yes, consistently. Standard blood panels are built to detect disease — conditions where something is clinically abnormal. Many causes of persistent fatigue, including suboptimal ferritin, early insulin resistance, sleep apnea, depression, and low NAD+ levels, either fall within normal reference ranges or require a different type of test entirely. A normal result means the most common diseases were ruled out, not that your cells are producing energy efficiently.

What blood tests should I ask for if I’m always tired?

Start by confirming your standard panel was complete — CBC, CMP, TSH with Free T3, ferritin (with the actual number), vitamin D, B12, and HbA1c. If those are normal, ask about fasting insulin for early insulin resistance, high-sensitivity CRP for chronic inflammation, and a 24-hour cortisol test if chronic stress is a factor. If all of that comes back clear, intracellular NAD+ testing is a logical next step. Talk with your clinician about what makes sense given your specific symptoms and history.

What is NAD+ and why isn’t it on standard blood panels?

NAD+ is a coenzyme that your cells use to convert food into usable energy (ATP). It declines with age and is central to how efficiently your mitochondria — your cells’ energy generators — function. It isn’t included on standard panels partly because the consumer testing infrastructure for it is relatively new, and partly because conventional medicine has historically focused on disease markers rather than functional cellular health markers. Intracellular NAD+ testing is now available as an at-home test through specialized labs.

How do I test my NAD+ levels?

Jinfiniti offers an at-home Intracellular NAD® Test that uses a simple finger-prick blood collection. The sample is processed in a CLIA-certified lab, with results typically available within one week. Results include a personalized dosing recommendation if supplementation is indicated.

How long does it take to improve energy levels after addressing NAD+ deficiency?

In clinical trials of Jinfiniti’s Vitality↑® NAD+ Booster, 85% of participants reached optimal NAD+ levels within four weeks. Many people report noticeable improvements in energy and sleep quality within that window. Individual results vary based on baseline levels, age, and other factors — which is why retesting at 4–6 weeks helps confirm the intervention is working and guides any dosage adjustments.

Should I be concerned if my fatigue has lasted several months?

Yes — persistent fatigue lasting six months or more, especially fatigue that doesn’t improve with rest or worsens after activity, warrants a thorough evaluation. This symptom pattern is associated with conditions like ME/CFS that require clinical assessment. Talk with your doctor about the full picture of your symptoms, not just the blood work.

  1. Martens K, DeLoughery TG. Sex, lies, and iron deficiency: a call to change ferritin reference ranges. American Society of Hematology; 2023. https://doi.org/10.1182/hematology.2023000494
  2. Di Molfetta IV, Bordoni L, Gabbianelli R, Sagratini G, Alessandroni L. Vitamin D and Its Role on the Fatigue Mitigation: A Narrative Review. MDPI AG; 2024. https://doi.org/10.3390/nu16020221
  3. Kothari M, Wanjari A, Shaikh SM, Tantia P, Waghmare BV, Parepalli A, et al. A Comprehensive Review on Understanding Magnesium Disorders: Pathophysiology, Clinical Manifestations, and Management Strategies. Springer Science and Business Media LLC; 2024. https://doi.org/10.7759/cureus.68385
  4. Hirotsu C, Tufik S, Andersen ML. Interactions between sleep, stress, and metabolism: From physiological to pathological conditions. Georg Thieme Verlag KG; 2015. https://doi.org/10.1016/j.slsci.2015.09.002
  5. Zapata-Pérez R, Wanders RJA, van Karnebeek CDM, Houtkooper RH. NAD+ homeostasis in human health and disease. Springer Science and Business Media LLC; 2021. https://doi.org/10.15252/emmm.202113943
  6. Wang P, Chen M, Hou Y, Luan J, Liu R, Chen L, et al. Fingerstick blood assay maps real-world NAD+ disparity across gender and age. Wiley; 2023. https://doi.org/10.1111/acel.13965
Dark circles under the eyes caused by vitamin deficiency

Can a Vitamin Deficiency Cause Dark Circles Under the Eyes?

You’ve tried sleeping more. You’ve tried the expensive eye creams. You’ve convinced yourself it’s just genetics, or aging, or the fact that you’ve been staring at screens since 2008. And still, the dark circles under the eyes are there every morning.

For a lot of people, that explanation is frustrating precisely because it’s incomplete. Sleep deprivation is the story we tell, but persistent dark circles — the kind that stick around even when you’re well-rested — can be a visible signal of something happening beneath the skin.

Specifically, certain vitamin and mineral deficiencies have been clinically linked to periorbital hyperpigmentation (the medical term for dark discoloration under the eyes), and the mechanisms are real, if still being studied.

The short answer to which deficiency is most to blame isn’t simple. But it’s worth knowing.

The Short Summary

  • Persistent dark circles that don’t improve with sleep may be pointing to a vitamin or mineral deficiency rather than a lifestyle issue.
  • Iron deficiency is the most clinically documented nutritional cause, present in roughly half of patients with periorbital hyperpigmentation in some studies.
  • Vitamins B12, K, C, and D are each associated with dark circles — but through different mechanisms, and with varying levels of research support.
  • The most reliable path forward is testing your nutrient levels rather than guessing which supplement to add.

CLIA-Certified Blood Panel

Uncover deficiencies with a complete blood test from home.

Jinfiniti AgingSOS green gradient background

Why the Skin Under Your Eyes Is So Fragile

Before jumping to deficiencies, it helps to understand what makes this particular area of your face so sensitive to internal changes.

The skin beneath the eyes is among the thinnest on the entire body — significantly thinner than skin on the cheeks or forehead. It has very little subcutaneous fat to buffer what lies underneath, and the capillary network directly beneath it is dense.

When circulation is compromised, oxygenation is low, or collagen is depleted, the result is visible: dilated blood vessels, pooled blood, and increased pigmentation all show up more easily here than anywhere else on the face.

What Makes Periorbital Skin So Vulnerable

A 2019 clinical assessment published in Clinical, Cosmetic and Investigational Dermatology confirmed that under-eye dark circles correlate with measurably thinner skin, higher hemoglobin index (a marker of vascular prominence), and a higher melanin index — all pointing to both vascular and pigmentary contributors rather than just one single cause.[1]

That’s the important thing to know: dark circles are rarely due to one thing alone. Which means identifying the most correctable cause matters more than defaulting to the nearest eye cream.

Vitamin and Mineral Deficiencies Linked to Dark Circles Under the Eyes

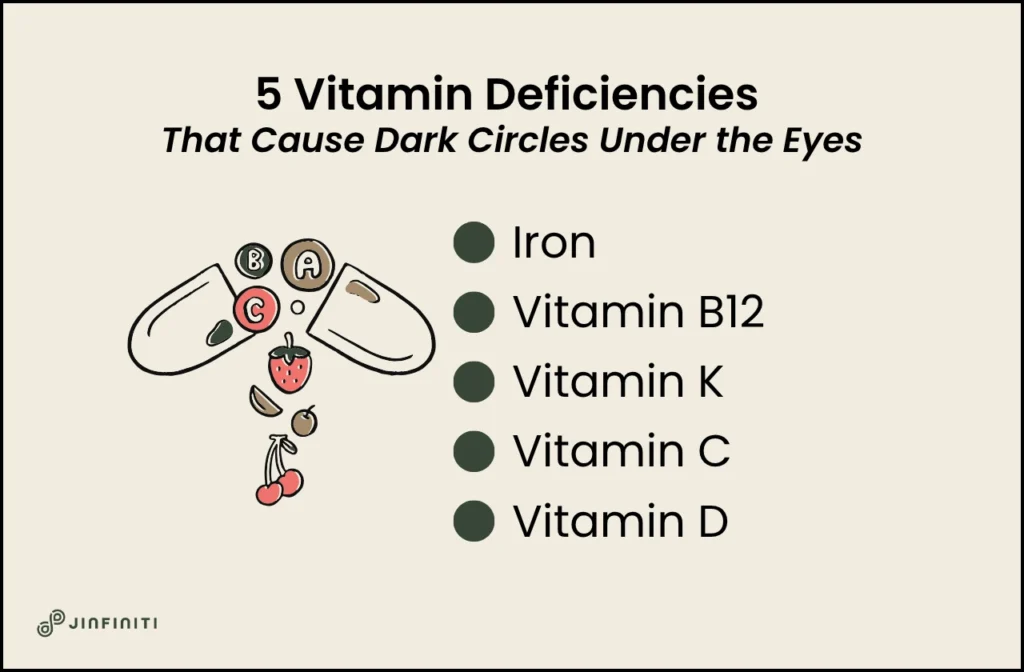
Infographic showing vitamin deficiencies that cause dark circles under the eyes

The research on nutritional causes of periorbital hyperpigmentation is still catching up to how common the condition actually is. Still, several deficiencies have meaningful clinical and mechanistic support.

1. Iron: The Strongest Clinical Link

Iron is essential for producing hemoglobin — the protein in red blood cells that carries oxygen to every tissue in your body, including the delicate skin around your eyes. When iron levels are low, tissues don’t receive adequate oxygen, small blood vessels dilate to compensate, and skin becomes paler overall. Under thin periorbital skin, that combination makes dark underlying vessels far more visible.

The clinical data here is more robust than for any other nutrient. A 2014 study of 200 patients with periorbital hyperpigmentation found that 50% had iron deficiency anemia — and many of those patients reported that their dark circles improved significantly once the anemia was treated. Iron deficiency is worth ruling out early, particularly in women during reproductive years, vegetarians and vegans, and anyone with heavy menstrual periods.[2]

One important nuance: iron deficiency anemia is distinct from simply having low-normal iron stores. Standard blood panels may not catch early functional iron depletion. A full iron panel — including ferritin — gives a more complete picture.

2. Vitamin B12: Pigmentation and Skin Cell Renewal

Vitamin B12 plays a central role in red blood cell production, nerve health, and the renewal of skin cells. When B12 is deficient, the skin can lose its normal turnover rate and develop increased pigmentation — including in the periorbital area.

A cross-sectional study of patients with periorbital pigmentation found a significant association between dark circles and low B12 levels, noting that B12 supplementation could serve as an adjunctive treatment in affected patients.[3]

The connection makes mechanistic sense: slowed cell turnover allows pigmented cells to accumulate, and decreased red blood cell production compounds the oxygenation problem.

B12 deficiency is particularly common in vegans, older adults (absorption decreases with age), and people taking metformin long-term. It’s also worth noting that niac — a form of vitamin B3 — has separately been studied for its effects on skin pigmentation and barrier function, though its relationship to periorbital hyperpigmentation specifically is still emerging.

3. Vitamin K: Blood Pooling Beneath the Eyes

Vitamin K is perhaps the most specifically targeted nutrient when it comes to dark circles. It plays a key role in blood clotting and vascular integrity — and when K levels are low, blood is more prone to pooling in the small capillaries beneath the eyes rather than clearing efficiently.

A study on topical application of phytonadione (vitamin K), retinol, and vitamins C and E found that the combination, applied twice daily, produced meaningful reductions in dark circle intensity — with vitamin K’s vascular effects considered a key mechanism.[4]

While this was a topical study rather than a supplementation trial, it supports the idea that vitamin K status has a direct bearing on periorbital blood dynamics.

Vitamin K comes in two main dietary forms: K1 (found in leafy greens) and K2 (found in fermented foods and animal products). K2 in its MK-7 form stays active in the body significantly longer than other forms — a relevant distinction when evaluating whether supplementation would be meaningful.

4. Vitamin C: Collagen and Capillary Strength

Vitamin C is required for collagen synthesis — the structural protein that gives skin its thickness and resilience. Under the eyes, adequate collagen is what prevents the vascular network from showing through. When vitamin C is deficient, periorbital skin thins and capillary walls weaken, making blood vessels more visible and more prone to minor leakage.

The direct evidence linking vitamin C deficiency to dark circles is still emerging rather than definitive. The mechanistic case is plausible and supported by vitamin C’s well-established role in skin biology — but direct clinical trials isolating vitamin C deficiency as a cause are limited.

5. Vitamin D: An Association Worth Monitoring

Low vitamin D has been noted more frequently in women over 40 with persistent dark circles, and some clinical observation suggests a possible connection. The mechanism isn’t fully established — vitamin D receptors are present in skin tissue and vitamin D plays a role in skin cell differentiation, but the direct periorbital link hasn’t been proven in controlled trials.

This is an area where the evidence is still insufficient for confident claims. What can be said: widespread vitamin D deficiency affects an estimated 50 to 70% of adults, and addressing it has enough supporting evidence across other health domains that testing is reasonable regardless of whether dark circles are your primary concern.[5]

Dark Circles Are Multifactorial and One Fix Rarely Works

A woman with dark circles under her eyes

Here’s where the picture gets more honest. Even in studies focused specifically on nutritional causes, periorbital hyperpigmentation is consistently described as multifactorial — meaning genetics, chronic sun exposure, allergies, vascular anatomy, hormonal changes, and nutritional gaps all interact.

One study found that family history was positive in over 60% of patients with the condition, meaning some degree of structural predisposition is common.[2]

This doesn’t mean nutrition doesn’t matter. It means that correcting a deficiency will help more for some people than others, and that addressing underlying inflammation alongside specific nutrient gaps gives a more complete picture than targeting any single variable.

If your dark circles appeared or worsened over time, rather than being a lifelong constant, that’s a better signal that an internal cause — including nutrient deficiency — is playing a role.

How to Know If a Deficiency Is Causing Dark Circles

The difference between guessing and knowing is a blood test.

Most standard panels include hemoglobin and basic B12 — but they often miss ferritin (the storage form of iron that depletes before anemia becomes clinically apparent), detailed vitamin D levels, or comprehensive micronutrient profiles.

If you suspect a deficiency is contributing to what you’re seeing, asking specifically for a full iron panel with ferritin, serum B12, 25-hydroxyvitamin D, and a comprehensive metabolic panel gives you a more useful starting point than standard routine labs.

For a broader picture of where your nutrient status actually stands, at-home testing panels have made comprehensive biomarker assessment significantly more accessible — without requiring a specialist referral for each individual marker.

“A visible symptom like dark circles is almost always downstream of something measurable,” says Dr. Jin-Xiong She, founder of Jinfiniti Precision Medicine. “The question we always ask is: what is actually driving this? You don’t fix the symptom without understanding the root cause — and you don’t find the root cause without measuring.”

The AgingSOS® Advanced Panel measures 28 biomarkers including full nutrient status, inflammatory markers, and cellular health indicators — giving a comprehensive baseline that goes beyond what standard blood work typically captures. For those who want to understand the full picture before making any supplementation decisions, it’s a more useful starting point than addressing one nutrient at a time.

What to Do Once You Know the Cause

Identifying the deficiency is step one. What comes next depends on what you find — and a conversation with your clinician before starting any supplementation is always the right first move.

DeficiencyDietary SourcesSupplementation Notes
IronRed meat, lentils, spinach, fortified cerealsSupplement only with confirmed deficiency; iron overload is also problematic
Vitamin B12Meat, fish, eggs, dairyParticularly important for vegans, older adults, metformin users
Vitamin KLeafy greens (K1), fermented foods, animal products (K2)K2 (MK-7 form) has superior bioavailability and longer activity
Vitamin CCitrus, bell peppers, strawberries, broccoliDietary priority first; topical forms also studied for periorbital use
Vitamin DSunlight, fatty fish, fortified foodsPair with K2 for proper calcium metabolism; absorption varies widely

Vitamins D3 and K2 are a particularly well-studied combination — D3 supports calcium absorption, while K2 directs that calcium appropriately to bones rather than soft tissues. Taking them together is mechanistically sound, and products pairing both in bioavailable forms address two common deficiencies with one approach.

If mineral gaps are part of the picture, absorption quality matters as much as dose. Chelated mineral forms — bound to amino acids for better uptake — are significantly more bioavailable than standard mineral salts, and dual-form magnesium (glycinate plus malate) addresses both sleep quality and cellular energy support simultaneously.

Frequently Asked Questions

Which vitamin deficiency is most commonly linked to dark circles?

Iron deficiency has the strongest clinical evidence, appearing in roughly half of patients with periorbital hyperpigmentation in published studies. Vitamin B12 deficiency has the next strongest association, particularly through its effect on skin pigmentation and red blood cell production. Vitamins K, C, and D each have plausible mechanistic links, though the direct clinical evidence is more limited.

Can taking supplements fix dark circles?

Supplements can help if a documented deficiency is the underlying cause. They’re unlikely to produce visible change if the root cause is structural (thin skin, genetics, anatomical shadowing) or primarily vascular without a nutritional driver. Testing before supplementing is the most reliable path to knowing whether it’s worth trying.

How long does it take for dark circles to improve once a deficiency is treated?

This varies by deficiency and severity. Iron deficiency anemia typically takes 6–8 weeks of treatment before hemoglobin levels normalize meaningfully — visible skin changes may follow. B12 replenishment timelines depend on the severity and form of supplementation. Realistic expectation: several months of consistent treatment before drawing conclusions.

Are dark circles always caused by a vitamin deficiency?

No. Dark circles are multifactorial, and nutritional deficiency is one of several possible causes. Genetics, aging, skin thinning, vascular anatomy, allergies, and chronic sun exposure all contribute in different proportions for different people. If your dark circles have been present since childhood or run in your family, a structural or genetic component is more likely. If they appeared or worsened over time, an internal cause — including nutrition — deserves investigation.

What blood tests should I ask for if I suspect a nutritional deficiency?

Ask your clinician for a complete blood count (CBC), a full iron panel including serum ferritin, serum B12, 25-hydroxyvitamin D, and a comprehensive metabolic panel. These go beyond what most routine labs include and give a more complete picture of nutrient status. If you want a broader baseline assessment, comprehensive biomarker panels can measure many of these simultaneously alongside inflammatory and metabolic markers.

  1. Mac-Mary S, Zornoza Solinis I, Predine O, Sainthillier JM, Sladen C, Bell M, et al. Identification Of Three Key Factors Contributing To The Aetiology Of Dark Circles By Clinical And Instrumental Assessments Of The Infraorbital Region. Informa UK Limited; 2019. https://doi.org/10.2147/ccid.s217956
  2. Sheth P, Shah H, Dave J. Periorbital hyperpigmentation: A study of its prevalence, common causative factors and its association with personal habits and other disorders. Medknow; 2014. https://doi.org/10.4103/0019-5154.127675
  3. Rana S, Mendiratta V, Jassi R, Chander R. Study of causative factors and clinical patterns of periorbital pigmentation. Medknow; 2019. https://doi.org/10.4103/idoj.idoj_158_18
  4. Mitsuishi T, Shimoda T, Mitsui Y, Kuriyama Y, Kawana S. The effects of topical application of phytonadione, retinol and vitamins C and E on infraorbital dark circles and wrinkles of the lower eyelids. Wiley; 2004. https://doi.org/10.1111/j.1473-2130.2004.00070.x
  5. Cui A, Zhang T, Xiao P, Fan Z, Wang H, Zhuang Y. Global and regional prevalence of vitamin D deficiency in population-based studies from 2000 to 2022: A pooled analysis of 7.9 million participants. Frontiers Media SA; 2023. https://doi.org/10.3389/fnut.2023.1070808
A woman prepares a heart-healthy meal for reducing ApoB levels.

How to Reduce ApoB Levels: Diet, Lifestyle & Supplements

Your ApoB came back elevated. Maybe your doctor flagged it. Maybe you ordered a panel yourself and the number surprised you — especially if your LDL looked unremarkable. Either way, you’re in the right place.

The question you probably have now is the one this article will answer: what actually reduces ApoB, and what order should you tackle it in? The solution is less of a checklist than it is dependent on why your ApoB is high. Two people can have the same ApoB number but have completely different causes — and what works best for one will do little for the other.

What You Should Know

  • ApoB counts every dangerous particle, including LDL, VLDL, and remnant cholesterol — one ApoB per particle, no exceptions.
  • You can have a “normal” LDL and still have high ApoB, meaning standard testing may underestimate your cardiovascular risk.
  • Diet, exercise, and targeted supplementation can meaningfully lower ApoB — but the most effective approach depends on what’s driving your levels.
  • Testing ApoB before and after intervention is the only way to know if what you’re doing is working.

Metabolic Support for Elevated ApoB

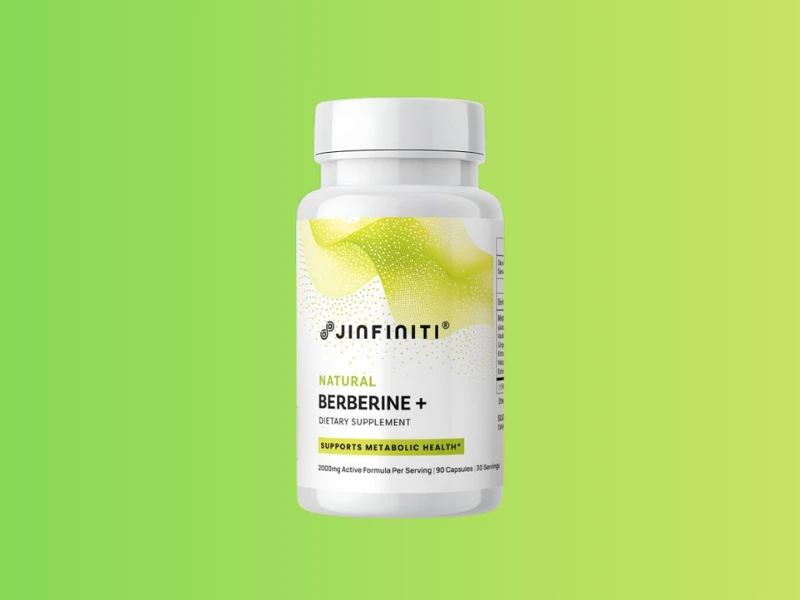
Berberine is clinically shown to lower ApoB, LDL, and triglycerides.

Natural Berberine+ product mockup

What Is ApoB and Why Does It Matter More Than LDL?

Every atherogenic lipoprotein particle — LDL, VLDL, IDL, and remnant cholesterol — carries exactly one molecule of apolipoprotein B on its surface. This means ApoB functions as a direct particle count: the higher your ApoB, the more particles are available to penetrate arterial walls and accelerate plaque buildup.

LDL-C, by contrast, estimates the total cholesterol mass inside LDL particles. That’s a different number, and in a meaningful subset of people, a misleading one. Someone with many small, dense LDL particles can have a normal LDL-C but a high ApoB — and carry substantially more cardiovascular disease risk than their standard results suggest.

A 2025 systematic review in the Journal of Clinical Lipidology, which compiled 15 discordance studies involving 593,354 participants, found that ApoB outperformed LDL-C as a predictor of atherosclerotic cardiovascular disease in every comparison — 9 out of 9 studies.[1]

A 2024 consensus statement published in Circulation reinforced this, noting that in patients where ApoB and LDL-C diverge, only ApoB reliably predicts adverse cardiovascular events.[2]

Despite this evidence, ApoB still isn’t part of standard routine bloodwork for most people. Which means a lot of risk goes undetected.

What’s a Healthy ApoB Level?

ApoB is measured in mg/dL. Based on clinical trial data and expert consensus:

  • Below 80 mg/dL — general population target, associated with lower cardiovascular risk
  • Below 70 mg/dL — recommended for high-risk individuals
  • Below 60 mg/dL — target for very high-risk patients, such as those with existing cardiovascular disease or familial hypercholesterolemia

The National Lipid Association’s Expert Consensus on ApoB supports these thresholds and recommends ApoB measurement not only at baseline but also in patients already on lipid-lowering therapy, where it can identify residual risk that LDL-C misses.[3]

If you haven’t had your ApoB tested, it’s included in Jinfiniti’s AgingSOS panels alongside a broader set of cardiovascular and metabolic biomarkers — which is a more useful context for interpreting the number anyway.

You can learn more about what ApoB testing measures and why it matters before deciding which panel makes sense for you.

What Causes High ApoB Levels?

Before reaching for interventions, it helps to understand what’s actually driving your number. Elevated ApoB has two distinct metabolic profiles, and they respond best to different approaches.

Triglyceride-Driven Elevation (VLDL-Heavy)

When insulin resistance is present, the liver overproduces VLDL particles — which are loaded with triglycerides and each carry one ApoB molecule. More VLDL means more ApoB, even before LDL is considered. This pattern typically shows up as elevated triglycerides alongside high ApoB.

The encouraging news: this type of elevation tends to respond strongly to lifestyle changes. Sugar restriction, reduced alcohol intake, regular exercise, and even modest weight loss can lower VLDL production — and bring ApoB down with it.

LDL Particle-Driven Elevation

Some people have normal or low triglycerides but still carry a high number of LDL particles, reflected in elevated ApoB. This pattern is more influenced by genetics, saturated fat intake, and the composition of dietary fat. It can persist even in people who eat reasonably well and exercise regularly.

Both drivers can coexist. Knowing which is dominant — or whether it’s both — is an argument for testing rather than guessing.

Diet Changes That Lower ApoB

Dietary interventions are the foundation of ApoB management. The most effective changes aren’t about eating less — they’re about shifting the composition of what you eat.

Reduce Saturated Fat and Refined Carbohydrates

Saturated fat raises LDL particle number. Refined carbohydrates and added sugars increase VLDL production by driving insulin resistance. Both push ApoB in the wrong direction.[4]

Research indicates that replacing just 5% of calories from saturated fat with polyunsaturated fat can reduce ApoB by approximately 10%. One underrated swap: replacing unfiltered coffee (French press, espresso) with filtered coffee. Unfiltered coffee contains cafestol and kahweol, compounds that measurably raise both LDL-C and ApoB.[5]

Add Soluble Fiber

Soluble fiber forms a gel in the digestive tract that binds to bile acids and dietary cholesterol, reducing their absorption and prompting the liver to pull more LDL particles from circulation. Oats, barley, beans, lentils, and psyllium husk are the most well-studied sources. Supplemental psyllium at doses of 10–25g/day has been shown to produce meaningful reductions in LDL-C, with likely downstream effects on ApoB.[6]

Increase Omega-3 Fatty Acids

High-dose EPA/DHA — typically 2–4 grams daily — reduces VLDL production in the liver, which is particularly useful in triglyceride-driven ApoB elevation. Fatty fish (salmon, mackerel, sardines) are the food sources with the strongest evidence. For people who don’t eat fish regularly, a quality fish oil supplement provides a consistent dose.[7]

Plant Sterols and Stanols

Plant sterols block cholesterol absorption in the small intestine. A 2014 research review found that up to 3 grams of plant sterols daily can reduce LDL cholesterol levels by roughly 12%. Fortified foods and supplements are the practical sources, since the amounts found in unfortified plant foods are too small to meaningfully affect levels.[8]

Lifestyle Changes With Measurable Impact

Here are some lifestyle changes that have the most impact on lowering your ApoB.

Aerobic Exercise and Resistance Training

Aerobic exercise improves insulin sensitivity, which lowers the VLDL overproduction that drives triglyceride-rich ApoB elevation. Resistance training improves body composition and metabolic function through a different pathway. Both contribute, and the research supports combining them rather than prioritizing one.

High-intensity interval training shows the strongest effect per session in small trials, but consistency over time matters more than intensity. Moderate aerobic activity for at least 12 weeks produces the most consistently replicated ApoB reductions in clinical data.[9]

Weight Loss, Particularly Visceral Fat

Visceral fat — the kind that accumulates around abdominal organs — is metabolically active in ways that subcutaneous fat isn’t. It promotes insulin resistance, increases VLDL production, and drives systemic inflammation that compounds cardiovascular risk. Losing visceral fat, even in modest amounts, has outsized effects on triglycerides and ApoB compared to the same amount of fat lost from elsewhere.[10]

Sleep and Stress

Sleep deprivation worsens insulin sensitivity and disrupts lipid metabolism. Chronic stress elevates cortisol, which over time contributes to insulin resistance and dyslipidemia. Neither of these is a primary lever for ApoB reduction, but both compound the effects of other risk factors — and addressing them makes dietary and exercise interventions work better.[11]

Supplements With Evidence for Lowering ApoB

Supplements don’t replace diet and lifestyle changes. When the foundation is solid, certain supplements can add meaningful reductions on top of it.

Berberine

Berberine activates AMPK — the body’s master metabolic switch — which suppresses the liver’s production of ApoB-containing lipoproteins. It functions through a mechanism similar to metformin, though without the prescription requirement.

A 2023 meta-analysis pooled 18 randomized controlled trials involving 1,788 participants and found that berberine produced significant reductions in ApoB (−0.25 g/L), LDL cholesterol, total cholesterol, and triglycerides. No serious adverse events were reported across the included studies.[12]

The mechanism matters here. Berberine lowers ApoB by reducing the number of particles the liver produces — which is the same upstream target as pharmaceutical lipid-lowering agents. That’s different from simply blocking cholesterol absorption.

Jinfiniti’s Natural Berberine+ combines 1,200mg of high-potency berberine (95%) with a MetabolicAid blend — astragalus, panax notoginseng, ginger, cinnamon, and artichoke leaf — along with black pepper extract for significantly improved absorption. If you’re looking to include berberine as part of a cardiovascular support protocol, see our guide to choosing a berberine supplement for a breakdown of what to look for in a quality formula.

As Dr. Jin-Xiong She, founder of Jinfiniti and researcher behind the company’s supplement formulations, has noted: “Berberine’s ability to activate AMPK means it’s working at a metabolic level — not just masking numbers, but addressing the underlying processes that drive particle overproduction.”

Omega-3 Supplements

If dietary omega-3 intake is inconsistent, supplementing with EPA/DHA at 2–4 grams daily is a practical way to achieve the doses associated with VLDL and ApoB reduction. Quality and purity vary significantly between products — look for third-party testing and triglyceride form for better absorption.

Niacin and Plant Sterol Supplements

Niacin (vitamin B3) can reduce ApoB by 15–25% at therapeutic doses, but it requires medical supervision due to side effects and interactions. Plant sterol supplements offer a more accessible option with a more modest effect size. Red yeast rice deserves an honest note: it contains monacolin K, which functions like a natural statin, but the quality and monacolin content of commercially available products is inconsistently regulated. It may work — the regulatory complexity around it is worth understanding before using it.[13]

When to Consider Medication

Lifestyle changes and supplements can meaningfully lower ApoB, but for some people — particularly those with familial hypercholesterolemia, existing cardiovascular disease, or persistently high levels despite intervention — medication is often necessary and appropriate.

Statins reduce ApoB by 19–42% depending on dose and agent. Ezetimibe blocks intestinal cholesterol absorption and adds further reduction when combined with a statin. PCSK9 inhibitors, typically reserved for high-risk patients who don’t respond adequately to first-line treatment, can achieve 40–56% ApoB reductions.[14]

These aren’t signs of failure. ApoB has a meaningful genetic component, and for many people, medication is the most effective tool available. Your clinician is the right person to evaluate when that threshold has been reached.

🧬 RELATED READING

  • Turmeric’s anti-inflammatory effects may extend to lipid health. Here’s what the research says about turmeric and cholesterol.
  • Niacin is one of the most potent natural tools for improving lipid profiles but carries risks. Read the evidence on niacin for cholesterol before using it.
  • Creatine has an underappreciated relationship with cardiovascular markers. See what the data shows on creatine and cholesterol.

The Case for Measuring ApoB Before and After Intervening

All of the above — the dietary changes, the exercise, the supplements — works best when you can actually see whether it’s working. Without a baseline, you’re making decisions without data. Without follow-up testing, you have no way to know if your ApoB responded, plateaued, or needs a different approach.

ApoB is available through most commercial laboratories and is included in Jinfiniti’s AgingSOS® Advanced Panel, which also measures 27 additional biomarkers — including inflammatory markers, heart health indicators, and the longevity protein Klotho.

For those managing cardiovascular health risk as part of a broader longevity protocol, having ApoB in context with other markers gives you a much clearer picture of where to prioritize. The approach that’s most likely to produce durable results is the one that’s least common: measure first, intervene precisely, then measure again to see what moved.

Frequently Asked Questions

How long does it take to lower ApoB?

Meaningful dietary changes typically produce measurable ApoB reductions within 6–12 weeks. Berberine trials in the clinical literature have run for as short as 4 weeks with measurable effects. Medication produces faster reductions, often within 4–8 weeks. The timeline depends heavily on what’s driving elevation in the first place — people with triglyceride-driven ApoB often see faster dietary responses than those with LDL particle-driven elevation.

Can you lower ApoB levels without medication?

Yes, in many cases. Diet, exercise, and targeted supplementation can produce clinically meaningful ApoB reductions — particularly in people whose elevation is primarily driven by insulin resistance, high triglycerides, or dietary factors. For some individuals, especially those with genetic predisposition or very high baseline levels, medication is also needed to reach target ranges. It depends on where you’re starting and what your risk level is.

Is ApoB the same as LDL?

No. LDL-C measures the total cholesterol mass inside LDL particles. ApoB counts the number of all atherogenic particles, including LDL, VLDL, IDL, and remnant cholesterol. They often correlate, but not always — particularly in people with insulin resistance, high triglycerides, or low-HDL patterns. When they diverge, ApoB is the more accurate predictor of cardiovascular risk.

What foods raise ApoB the most?

Saturated fats (red meat, butter, full-fat dairy, tropical oils) raise LDL particle number and ApoB. Refined carbohydrates, added sugars, and alcohol raise VLDL production and contribute to ApoB through the triglyceride pathway. Unfiltered coffee — French press, espresso — contains compounds that measurably raise ApoB and is often overlooked. Trans fats, where still present in processed foods, are also significant contributors.

How often should I test my ApoB?

If you’re actively working to lower your ApoB through diet, lifestyle, or supplementation, retesting every 3–4 months gives you enough time to see a real response. Once levels are stable and within your target range, annual testing is generally sufficient. If you start a new intervention — a supplement, a medication, or a significant dietary change — retesting after 8–12 weeks helps confirm whether it’s working.

  • Sehayek D, Cole J, Björnson E, Wilkins JT, Mortensen MB, Dufresne L, et al. ApoB, LDL-C, and non-HDL-C as markers of cardiovascular risk. Elsevier BV; 2025. https://doi.org/10.1016/j.jacl.2025.05.024
  • De Oliveira-Gomes D, Joshi PH, Peterson ED, Rohatgi A, Khera A, Navar AM. Apolipoprotein B: Bridging the Gap Between Evidence and Clinical Practice. Ovid Technologies (Wolters Kluwer Health); 2024. https://doi.org/10.1161/circulationaha.124.068885
  • Soffer DE, Marston NA, Maki KC, Jacobson TA, Bittner VA, Peña JM, et al. Role of apolipoprotein B in the clinical management of cardiovascular risk in adults: An Expert Clinical Consensus from the National Lipid Association. Elsevier BV; 2024. https://doi.org/10.1016/j.jacl.2024.08.013
  • Kim S, Shin MJ, Krauss RM. Dietary Management of Atherogenic Dyslipidemia. Springer Science and Business Media LLC; 2025. https://doi.org/10.1007/s11883-025-01335-6
  • Siri-Tarino PW, Chiu S, Bergeron N, Krauss RM. Saturated Fats Versus Polyunsaturated Fats Versus Carbohydrates for Cardiovascular Disease Prevention and Treatment. Annual Reviews; 2015. https://doi.org/10.1146/annurev-nutr-071714-034449
  • Anderson JW, Allgood LD, Lawrence A, Altringer LA, Jerdack GR, Hengehold DA, et al. Cholesterol-lowering effects of psyllium intake adjunctive to diet therapy in men and women with hypercholesterolemia: meta-analysis of 8 controlled trials. Elsevier BV; 2000. https://doi.org/10.1093/ajcn/71.2.472
  • Oscarsson J, Hurt-Camejo E. Omega-3 fatty acids eicosapentaenoic acid and docosahexaenoic acid and their mechanisms of action on apolipoprotein B-containing lipoproteins in humans: a review. Springer Science and Business Media LLC; 2017. https://doi.org/10.1186/s12944-017-0541-3
  • Afshin A, Micha R, Khatibzadeh S, Mozaffarian D. Consumption of nuts and legumes and risk of incident ischemic heart disease, stroke, and diabetes: a systematic review and meta-analysis. Elsevier BV; 2014. https://doi.org/10.3945/ajcn.113.076901
  • Sellami M, Almuraikhy S, Anwardeen N, Nizamuddin PB, Othman H, Alathba N, et al. Effects of 8 weeks of moderate physical training on body composition, lipid profile, inflammatory markers, and physical activity in middle aged females. Frontiers Media SA; 2026. https://doi.org/10.3389/fendo.2025.1734772
  • Riches FM, Watts GF, Hua J, Stewart GR, Naoumova RP, Barrett PHR. Reduction in Visceral Adipose Tissue Is Associated with Improvement in Apolipoprotein B-100 Metabolism in Obese Men. The Endocrine Society; 1999. https://doi.org/10.1210/jcem.84.8.5925
  • Mesarwi O, Polak J, Jun J, Polotsky VY. Sleep Disorders and the Development of Insulin Resistance and Obesity. Elsevier BV; 2013. https://doi.org/10.1016/j.ecl.2013.05.001
  • Blais JE, Huang X, Zhao JV. Overall and Sex-Specific Effect of Berberine for the Treatment of Dyslipidemia in Adults: A Systematic Review and Meta-Analysis of Randomized Placebo-Controlled Trials. Springer Science and Business Media LLC; 2023. https://doi.org/10.1007/s40265-023-01841-4
  • Korneva VA, Kuznetsova TY, Julius U. Modern Approaches to Lower Lipoprotein(a) Concentrations and Consequences for Cardiovascular Diseases. MDPI AG; 2021. https://doi.org/10.3390/biomedicines9091271
  • Jacobson TA. Opening a New Lipid “Apo-thecary”: Incorporating Apolipoproteins as Potential Risk Factors and Treatment Targets to Reduce Cardiovascular Risk. Elsevier BV; 2011. https://doi.org/10.4065/mcp.2011.0128
A woman still feels tired after 8 hours of sleep

Why You’re Still Tired After 8 Hours of Sleep

You went to bed at a reasonable hour. You didn’t drink. You got a full eight hours. And you still woke up feeling like you hadn’t slept at all.

If that sounds familiar, you’re not doing something wrong. You’re running into something that a lot of health content glosses over: the difference between sleeping and actually recovering. Duration is only half of the equation. What happens inside your cells during those eight hours — whether your body can actually use that time to restore itself — is the half most people never hear about.

That gap between sleeping and recovering is where a lot of persistent morning fatigue lives. And for many people, especially those in their 30s, 40s, and 50s, it has less to do with habits than with cellular energy.

What You Should Know

  • Sleep duration and sleep quality are different problems — 8 hours in bed doesn’t guarantee 8 hours of restoration.
  • Sleep apnea affects roughly 30 million Americans and is one of the most common causes of non-restorative sleep.
  • Alcohol, caffeine, and circadian misalignment can fragment sleep significantly without reducing total hours.
  • NAD+ levels decline naturally and are directly linked to the biological clock that governs how restorative your sleep actually is.

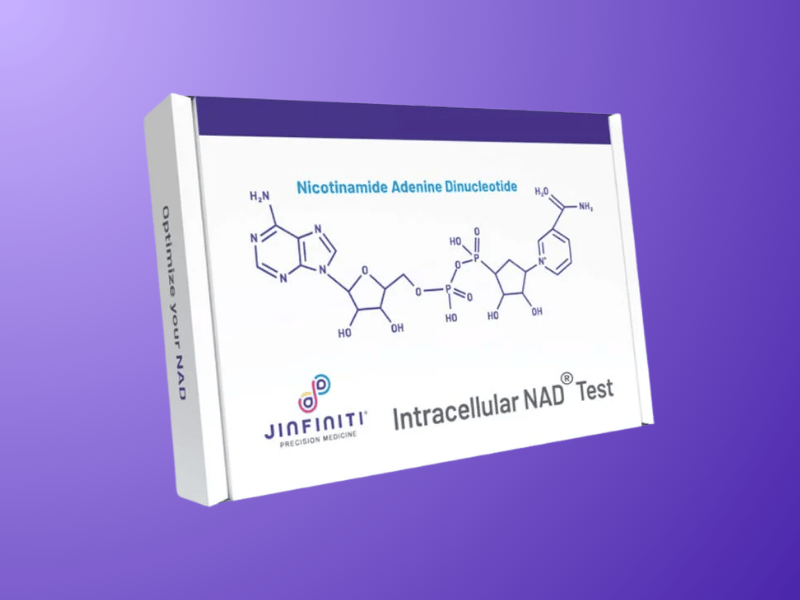
CLIA-Certified NAD Test Kit

Waking up tired? Measure the cellular energy your bloodwork misses.

Jinfiniti Intracellular NAD Test on purple background

Sleeping Eight Hours and Recovering Are Not the Same Thing

Most adults need somewhere between seven to nine hours of sleep, and that range comes from decades of research on what duration supports normal cognitive and physical function.

But getting enough sleep — hitting that number consistently — doesn’t guarantee you’ll feel rested. What the recommendation doesn’t capture is the quality of what’s happening while you’re there.

Sleep isn’t a single state. It’s a sequence of distinct stages — light sleep, deep slow-wave sleep, and REM — that your brain cycles through roughly every 90 minutes.

Each sleep stage serves a different function:

  • Deep sleep is where your body repairs tissue, consolidates memory, and clears metabolic waste from the brain.
  • REM is where emotional processing and certain types of learning happen. You need both, in sufficient quantity, to wake up feeling restored.

The catch is that these stages can be disrupted in ways you’d never notice. A brief arousal — lasting seconds — is enough to knock you out of deep sleep and restart the cycle. Do that dozens of times a night and you’ve technically slept eight hours while getting very little of the sleep your body actually needed. That’s a form of sleep deprivation even without a reduction in total hours.

Why Sleep Quality Isn’t Just About Sleep Habits

Sleep hygiene — consistent bedtimes, dark rooms, no screens before bed — matters, but it targets the conditions around sleep rather than the mechanisms inside it. You can do everything right environmentally and still have fragmented, unrestorative sleep if something is interrupting your cycles at a biological level. Restorative sleep isn’t just about when you go to bed — it’s about what your body can actually accomplish once you’re there.

Research from the American Academy of Sleep Medicine puts roughly one in three adults in the category of non-restorative sleep — meaning they wake feeling unrefreshed despite logging adequate hours. And a large study in the JAMA Network found that 27% of adults reported daytime sleepiness despite averaging 7.5 to 8.2 hours of sleep per night.

The problem, in most of those cases, is what’s happening during sleep — not how long it lasts. Magnesium plays a meaningful sleep supporting role here, particularly magnesium glycinate, which supports the transition into deeper sleep stages for some people. But magnesium is a piece of a larger picture.

Common Reasons You’re Still Tired After 8 Hours of Sleep

Exhausted woman holding her head

Once you understand that sleep quality and sleep duration are different problems, the next question is: what’s actually disrupting yours? Several possibilities are worth working through in order, because some are more common — and more correctable — than others.

1. Sleep Apnea

Estimated to affect nearly 30 million Americans, most of whom are undiagnosed. The airway collapses repeatedly during sleep, and the brain wakes the body just long enough to restore breathing — often without any conscious memory of it. Those micro-arousals produce fragmented sleep, dramatically reducing time in deep restorative stages and leaving people exhausted regardless of time in bed. Loud snoring, morning headaches, and waking with a dry mouth are common signals worth discussing with a clinician.

2. Circadian Misalignment

Your internal clock is programmed to a specific sleep window based on your chronotype. If you’re a natural night owl sleeping from 10 PM to 6 AM to meet a work schedule, your body may be spending the first several hours trying to enter sleep it isn’t biologically ready for yet. The sleep you do get is less efficient — not because you slept less, but because the timing was off.

3. Alcohol and Caffeine

Alcohol helps people fall asleep faster but significantly disrupts REM in the second half of the night. Caffeine has a half-life of around five to seven hours, meaning an afternoon coffee is still circulating through your system at midnight — blunting deep sleep even if you fall asleep without difficulty.

4. Chronic Stress and Elevated Cortisol

Mental hypervigilance at night is a real physiological state. Sustained stress keeps the nervous system in a lower-level alert mode that makes deep sleep harder to achieve and easier to interrupt. This is often the hardest category to address because it requires more than a behavioral change.

5. Underlying Medical Conditions

Iron deficiency, hypothyroidism, depression, and anemia can all impair sleep quality and produce daytime fatigue that looks like a sleep problem. Certain sleep disorders — including restless legs syndrome and hypersomnia — can also leave people exhausted despite logging adequate hours, and often go undiagnosed for years. If the basics aren’t explaining your fatigue, a standard panel with your clinician is a sensible next step.

If you’ve worked through this list and still feel tired after a full night in bed — or if you’ve already had these ruled out — there’s a less commonly explored explanation worth understanding.

When the Problem Runs Deeper Than Sleep Itself

Here’s a useful distinction: most of the causes above explain why sleep gets interrupted. But there’s a separate question — one that gets less attention — about whether your cells have the fuel to carry out recovery in the first place, even when sleep isn’t interrupted.

Sleep is metabolically active. During deep sleep, your brain clears metabolic waste, your cells repair DNA, and your mitochondria — the energy-producing structures in every cell — do some of their most important work. That work requires energy. And energy, at the cellular level, requires NAD+.

NAD+ and the Cellular Machinery Behind Sleep Recovery

NAD+ — nicotinamide adenine dinucleotide, a molecule your cells use to convert food into usable energy — doesn’t just power your waking hours. It’s directly woven into the biological mechanism that governs your circadian clock.

Research published in Science showed that intracellular NAD+ levels cycle with a 24-hour rhythm, driven by the circadian clock itself — specifically through CLOCK and BMAL1, two proteins that act as the master timekeepers of your biology. Those clock proteins regulate NAMPT, an enzyme that controls NAD+ production. And SIRT1 — an NAD+-dependent enzyme — feeds back into the clock, helping to maintain its precision.

Translation: NAD+ and your circadian clock are in a continuous feedback loop. Each depends on the other to function properly. When NAD+ levels are adequate, the clock runs with fidelity, sleep cycles are well-organized, and overnight repair happens efficiently. When NAD+ falls, that loop weakens — and with it, the restorative quality of sleep.

The problem is that NAD+ levels decline naturally with age, often beginning in the 30s and dropping by roughly 50% by the 60s. Poor sleep accelerates that decline. Chronic stress does too. The result, for many people in middle age, is a cycle: declining NAD+ disrupts sleep quality, and poor sleep further depletes NAD+.

The Circadian Clock–NAD+ Feedback Loop, Simply Explained

Your body’s master clock — housed in a region of the brain called the suprachiasmatic nucleus — keeps time using a cycle of proteins that switch each other on and off across a 24-hour period. SIRT1, which requires NAD+ to function, is one of the key regulators of that switching. A 2013 study published in Cell found that SIRT1 activity in the brain activates the transcription of BMAL1 and CLOCK — the two foundational proteins of the circadian loop — and that this activity declines with age as NAD+ falls.

In older animals, dampened BMAL1 activity was associated with disrupted activity patterns and a reduced ability to adapt to schedule changes. When NAD+ was restored through supplementation, those rhythms recovered toward younger patterns.

None of this means NAD+ is the only answer to morning fatigue. It’s one mechanism in a complex system. But it’s a mechanism that’s measurable — which matters.

How to Tell If Your Fatigue Is Sleep-Based

Sleep-based fatigue typically responds to improvements in sleep conditions. You fix the sleep apnea, cut the alcohol, get consistent about your sleep schedule — and the morning grogginess lifts over a few weeks.

Cellular fatigue is stickier. The hallmark of NAD+ deficiency is fatigue that persists despite consistently adequate sleep — exhaustion that isn’t explained by what you did the night before. Other signals in this category include:

  • Brain fog in the morning that doesn’t fully clear, even after coffee
  • Energy that improves slightly through the day but never fully rebounds
  • Slower recovery from exercise, stress, or illness than you’d expect
  • The sense that you used to bounce back faster — and no longer do

This pattern is consistent across patients who come in having already addressed the obvious factors. The sleep hygiene is fine. The bloodwork is normal. And they’re still dragging. That’s often a sign we need to look one level deeper.

What Standard Bloodwork Won’t Show You

A standard CBC, metabolic panel, or even a thyroid screen won’t tell you your intracellular NAD+ levels. That measurement requires a specific test — one that captures NAD+ inside the cells themselves, rather than in blood serum.

“Most people are surprised to learn that their cellular energy status is entirely invisible on a standard health panel,” says Dr. Jin-Xiong She, founder of Jinfiniti Precision Medicine. “NAD+ deficiency can be significant enough to explain persistent fatigue and sleep disruption while showing up on absolutely nothing that a standard doctor’s visit would catch.”

Jinfiniti’s Intracellular NAD® Test — the first consumer test of its kind — measures NAD+ inside cells using an at-home finger-prick collection, processed in a CLIA-certified lab with results in about a week. It’s the only way to know whether NAD+ deficiency is a factor in your fatigue, rather than assuming it either is or isn’t.

🧬 MORE SLEEP INSIGHTS

What Can Actually Help You Sleep Better?

Addressing morning fatigue effectively means working through causes in order, not adding interventions at random.

If you want to sleep better and haven’t been consistent about the basics, that’s the first place to look:

  • A fixed sleep and wake time, including weekends — your body’s clock responds to consistency
  • A cool, dark, quiet sleep environment
  • No alcohol within two to three hours of bed
  • Caffeine cutoff by early afternoon (1–2 PM is a reasonable default for most people)
  • Magnesium glycinate in the evening, which some people find meaningfully supports sleep depth

If you suspect sleep apnea — particularly if you snore, wake with headaches, or feel unrefreshed regardless of hours — talk to your clinician about a sleep study before doing much else. It’s one of the most common and most underdiagnosed causes of non-restorative sleep.

Beyond Sleep Hygiene: When Better Sleep Habits Aren’t Enough

Once the basics are solid and fatigue persists, measuring your intracellular NAD+ levels is the logical next step. If levels come back below the optimal range (40–100 μM), targeted supplementation is worth considering.

In a clinical trial of 26 adults aged 35–65, participants taking Jinfiniti’s Vitality↑® NAD+ Booster reached optimal NAD+ levels in 85% of cases within four weeks, with an average doubling of intracellular NAD+. Many reported improvements in energy and sleep quality within that window.

A few things to keep in mind:

  • Improvements in energy are often noticeable within two to four weeks; sleep quality tends to follow on a similar timeline
  • If NAD+ levels are low but energy doesn’t fully rebound after optimization, hormones, thyroid function, or sleep architecture are usually the next place to investigate
  • Talk with your clinician before starting any new supplement protocol, particularly if you’re managing chronic conditions or taking medications

For more on how to test your NAD+ levels and what the results actually mean, and on how NAD+ supplementation affects sleep quality specifically, both of those are worth reading alongside this one.

Eight hours of sleep should mean something. When it doesn’t, that’s not a personality problem or a discipline failure — it’s a signal worth investigating with some precision.

Better sleep starts with addressing the obvious: sleep apnea, circadian timing, alcohol. But for a meaningful percentage of people who’ve already handled the obvious, the root is cellular. It can be measured. And when it’s addressed in the right order, the results tend to be real.

Frequently Asked Questions

Why am I still tired after 8 hours of sleep?

Usually it’s a sleep quality issue — sleep apnea, circadian misalignment, alcohol, or chronic stress — rather than insufficient hours. If those have been addressed and fatigue persists, declining intracellular NAD+ levels are worth investigating.

Is it normal to wake up tired after a full night of sleep?

It’s common, but it shouldn’t be accepted as normal. It typically signals that something is disrupting sleep quality, or that cellular energy production is insufficient to support overnight repair.

Why am I so tired in the morning even when I sleep enough?

Morning-specific fatigue often points to disrupted deep sleep — the phase where most physical restoration happens — which can be fragmented by sleep apnea, alcohol, or circadian misalignment without you realizing it.

Can oversleeping make you more tired?

Yes — regularly sleeping over nine hours can disrupt circadian timing and leave you feeling groggier than a shorter, better-timed sleep. If long sleep still leaves you exhausted, the more likely explanation is a quality issue, not a quantity one.

Why do I dream too much and wake up tired?

High dream activity usually means more time in REM at the expense of deep slow-wave sleep, often driven by alcohol, stress, or sleep fragmentation. It’s worth raising alongside other fatigue symptoms when speaking to a clinician.

Could low NAD+ levels be why I wake up tired?

Possibly, particularly if you’re over 35 and other explanations have been ruled out. NAD+ is integral to the circadian clock machinery that governs sleep quality, and testing intracellular levels is the only way to know whether it’s a factor.

How do I know if my fatigue is cellular rather than sleep-related?

Sleep-based fatigue typically improves once you address the obvious disruptors. Cellular fatigue is stickier — it persists despite consistently adequate sleep and doesn’t respond to behavioral changes alone.

  • Nakahata, Y., Sahar, S., Astarita, G., Kaluzova, M., & Sassone-Corsi, P. (2009). Circadian control of the NAD+ salvage pathway by CLOCK-SIRT1. Science, 324(5927), 654–657. https://doi.org/10.1126/science.1170803
  • Levine, D. C., et al. (2020). NAD+ controls circadian reprogramming through PER2 nuclear translocation to counter aging. Cell, 180(4), 682–701. https://doi.org/10.1016/j.cell.2020.01.037
  • Satoh, A., et al. (2013). SIRT1 mediates central circadian control in the SCN by a mechanism that decays with aging. Cell, 153(7), 1448–1460. https://doi.org/10.1016/j.cell.2013.05.027
  • Dement, W. C., & Vaughan, C. (2025). Vitamin B3 ameliorates sleep duration and quality in clinical and pre-clinical studies. PMC Review. https://pmc.ncbi.nlm.nih.gov/articles/PMC12195990/
  • Roth, T. (2009). Slow wave sleep: Does it matter? Journal of Clinical Sleep Medicine, 5(2 Suppl), S4–S5.
  • Fernandez-Mendoza, J., et al. (2023). Prevalence of excessive daytime sleepiness in the general population: A systematic review and meta-analysis. JAMA Network Open, 6(3), e2254268. https://doi.org/10.1001/jamanetworkopen.2022.54268
Mitochondrial health supplements on display

The Best Supplements for Mitochondrial Health in 2026

What You Should Know

  • Mitochondria produce ATP, the energy molecule every cell in your body depends on — when they decline, so does your energy, recovery, and cognitive function.
  • The supplements with the strongest evidence for mitochondrial support include NAD+ precursors, CoQ10, Urolithin A, PQQ, alpha-lipoic acid, and acetyl-L-carnitine — each working through different mechanisms.
  • NAD+ is the single most important upstream driver of mitochondrial health, and it declines measurably with age.
  • Testing exists to measure where your mitochondria actually stand, so you’re not supplementing blindly.

You’ve probably been told your labs look fine. Normal thyroid, normal iron, nothing that jumps out. But you’re still tired — the kind of tired that sleep doesn’t fix — and your recovery from workouts, illness, or stress takes longer than it used to.

That’s not necessarily a sign that something is wrong with your bloodwork. It may be a sign that something is happening at a level standard panels don’t measure: inside your cells, in the tiny organelles responsible for producing nearly all of your body’s energy.

Mitochondrial decline is measurable, starts earlier than most people expect — often in your 30s and 40s — and is one of the most underappreciated drivers of fatigue, cognitive slowdown, and accelerated aging. The good news is that a growing body of research points to specific supplements, lifestyle habits, and tests that can genuinely support mitochondrial function.

This guide covers all of them, with honest evidence appraisals for each.


CLIA-Certified NAD Test Kit

Is NAD+ your mitochondrial bottleneck? Find out from home.

Jinfiniti Intracellular NAD Test on purple background

Why Mitochondrial Decline Matters — And When It Starts

Mitochondria do much more than produce energy. They regulate inflammation, control when cells live or die, and manage the DNA repair processes that keep you healthy as you age. Their decline isn’t just about feeling tired — it contributes to insulin resistance, cardiovascular disease, cognitive decline, and accelerated cellular aging.

This happens through two compounding failures. First, mitochondria produce less ATP (adenosine triphosphate) as their electron transport chain becomes less efficient. Second, the cleanup systems that remove damaged mitochondria — mitophagy — slow down with age, leaving dysfunctional organelles in place where they generate more oxidative stress. High-energy organs feel this first: the brain, the heart, and skeletal muscle.

The Role of NAD+ as the Upstream Driver

NAD+ (nicotinamide adenine dinucleotide) sits at the center of mitochondrial function. It’s the critical electron carrier in the mitochondrial respiratory chain, and it activates the sirtuin proteins — SIRT1 and SIRT3 — that regulate mitochondrial biogenesis, stress response, and quality control. A 2025 review in npj Metabolic Health and Disease describes NAD+ as essential to virtually every aspect of mitochondrial homeostasis, from energy production to mitophagy to antioxidant defense.[1]

The problem: NAD+ levels decline with age — measurably and significantly. By middle age, many people have half the intracellular NAD+ they had in their 20s. That decline tracks closely with the symptoms most people write off as “just getting older.”

Signs Your Mitochondria May Need Support

Not all of these point definitively to mitochondrial dysfunction — but they’re worth paying attention to, especially when multiple appear together:

  • Persistent fatigue not explained by sleep, stress, or bloodwork
  • Slower recovery from exercise, illness, or stress
  • Brain fog, difficulty concentrating, or cognitive slowdown
  • Muscle weakness or loss of exercise tolerance
  • Increased sensitivity to cold or temperature changes
  • Multiple-system symptoms without a clear diagnosis

The Best Supplements for Mitochondrial Health

What follows isn’t a “take everything on this list” approach. It’s organized by mechanism — how each supplement actually supports mitochondria — with the strength of evidence called out honestly for each.

1. NAD+ Precursors (NMN and NR): Fuel for the Whole System

If there’s a single intervention that addresses mitochondrial health at the root level, NAD+ repletion is the closest candidate. NMN (nicotinamide mononucleotide) and NR (nicotinamide riboside) are both precursors that raise intracellular NAD+, which in turn activates sirtuins, improves electron transport chain function, and supports the mitophagy systems that clear out damaged mitochondria.

Research published in Cell Death & Disease demonstrated that NMN supplementation improved mitochondrial stress response in Alzheimer’s disease models, reducing protein aggregation and restoring mitochondrial quality control.[2]

A randomized controlled trial of NR supplementation found significant increases in NAD+ levels and improvements in long-COVID cognitive symptoms — notably, a condition characterized by mitochondrial dysfunction.[3]

Dosing: 250–500 mg NMN or NR daily; effectiveness varies by individual, which is why testing matters.

“NAD+ testing before and during supplementation changes everything,” says Dr. Jin-Xiong She, founder of Jinfiniti Precision Medicine. “Most people assume they’re absorbing what they’re taking. What the data actually shows is that a meaningful percentage aren’t reaching optimal levels — and without measuring, you have no way to know.”

Optimal intracellular NAD+ has been defined as 40–100 μM. Below 40 is suboptimal; below 20 is severely deficient. 85% of participants taking Vitality↑® NAD+ Booster reached optimal NAD+ levels within four weeks in a clinical setting — a result that single-ingredient precursors haven’t matched in head-to-head comparisons.

2. CoQ10: The Electron Transport Chain Essential

CoQ10 (coenzyme Q10) is concentrated in the tissues that demand the most energy — the heart, kidneys, and liver — and sits directly inside the mitochondrial electron transport chain, where it shuttles electrons between protein complexes to generate ATP. Without adequate CoQ10, that chain becomes inefficient and generates more oxidative stress as a byproduct.

Clinical trials summarized in a review on mitochondrial dysfunction and chronic disease confirm CoQ10’s role in supporting ATP production and protecting mitochondrial membranes from oxidative damage.[4]

There’s a particularly important caveat for anyone on statins: these medications can reduce CoQ10 levels by up to 40%, leaving mitochondrial function significantly impaired in people who are already managing cardiovascular risk.[5]

Two forms are available: ubiquinone (the oxidized form) and ubiquinol (the reduced, active form). Ubiquinol is better absorbed, particularly in adults over 50 whose conversion capacity has declined.

Dosing: 100–300 mg daily with a fat-containing meal. Ubiquinol preferred for older adults.

3. Urolithin A: The Mitophagy Activator

Damaged mitochondria that aren’t cleared accumulate inside cells and generate chronic oxidative stress. Urolithin A (UA) addresses this directly — it activates the PINK1 and Parkin proteins that tag worn-out mitochondria for recycling, improving the efficiency of the cellular cleanup system.

Research published in JAMA Network Open found that urolithin A supplementation improved muscle endurance in adults over 65 — a population with consistently poor mitophagy efficiency — even without exercise, improving fatigue resistance over four months. A separate study in iScience showed UA restored mitochondrial structure and function in aging and heart failure models.[6][7]

Worth being honest about: UA research in humans is still relatively early-stage compared to CoQ10 or creatine. The mechanistic data is compelling, but larger long-term human trials are still underway. It’s also worth noting that UA isn’t reliably produced from diet — it’s a byproduct of gut bacteria acting on ellagitannins from pomegranates and berries, and many people’s gut microbiome can’t produce it efficiently. Supplementation is the more predictable route. UA is included in Jinfiniti’s RejuvenAid alongside other cellular protection compounds.

Dosing: 500–1,000 mg daily.

4. PQQ: Triggering New Mitochondria

Most supplements on this list support the mitochondria you already have. PQQ (pyrroloquinoline quinone) is notable because it’s one of the few compounds with human evidence for actually stimulating the creation of new mitochondria — the process called mitochondrial biogenesis, regulated by the PGC-1α pathway.

PQQ activates NRF-1, NRF-2, and TFAM — the transcription factors that drive mitochondrial DNA replication and protein expression. Research in the Journal of the American College of Nutrition confirmed PQQ increases mitochondrial density through these mechanisms. It also reduces inflammation by inhibiting the NLRP3 inflammasome — the same pathway that contributes to both mitochondrial dysfunction and chronic inflammatory disease.[8]

Dosing: 10–20 mg daily. Often paired with CoQ10 for complementary effects.

5. Alpha-Lipoic Acid (ALA): Antioxidant for the Energy Chain

Alpha-lipoic acid functions as a cofactor for two key mitochondrial enzyme complexes — pyruvate dehydrogenase and alpha-ketoglutarate dehydrogenase — that are essential to the Krebs cycle. It also regenerates other antioxidants, including vitamin E and glutathione, which protect mitochondrial membranes from the oxidative byproducts of energy production.

What sets ALA apart from other antioxidants is that it crosses the blood-brain barrier, providing mitochondrial support in neurons — cells that are particularly energy-intensive and vulnerable to mitochondrial decline. A review in Antioxidants (Basel, Switzerland) confirmed ALA reduces free radical damage, improves mitochondrial function, and strengthens antioxidant defenses in multiple tissue types.[9]

Two forms exist: R-lipoic acid (the natural form) and the synthetic R/S mixture. R-ALA is approximately twice as bioavailable and is the better choice despite the higher cost.

Dosing: 300–600 mg daily. R-ALA preferred.

6. Acetyl-L-Carnitine (ALCAR): Fatty Acid Fuel Delivery

Mitochondria can’t burn long-chain fatty acids for fuel without carnitine — it’s the shuttle that transports them across the mitochondrial membrane. Acetyl-L-carnitine (ALCAR) is the acetylated form, which has better brain penetration and provides the additional benefit of acetyl groups for acetylcholine synthesis.

This matters most during states when fat is the primary fuel: fasting, low-carb eating, or endurance exercise. A randomized controlled trial on centenarians found significant reductions in physical and mental fatigue after L-carnitine supplementation — a result consistent with improving mitochondrial fuel delivery in tissues where carnitine status had likely declined.[10]

ALCAR is part of the RejuvenAid formula alongside L-ergothioneine and other cellular protection compounds.

Dosing: 1,500–3,000 mg daily; one dose approximately an hour before exercise if used for performance.

6. Senolytics: Clearing the Problem at the Source

Senescent cells — the “zombie” cells that have stopped dividing but refuse to die — accumulate dysfunctional mitochondria and secrete a chronic inflammatory signal that degrades the tissue around them. Clearing these cells addresses mitochondrial dysfunction from a different angle: not by boosting energy production, but by removing the burden of cells that are actively disrupting the cellular environment.[11]

Fisetinis the most potent natural senolytic identified to date. Quercetin has both senolytic and anti-inflammatory properties, and research consistently shows the two compounds work synergistically. Bromelain, included in Jinfiniti’s SenoAid, improves absorption.[12]

Dosing: Can be taken daily or via “pulse dosing” (2–3 consecutive days per week). Quercetin 1,000 mg + Fisetin 100–200 mg.

7. Magnesium, B Vitamins, and Vitamin D: The Foundation Layer

These don’t generate the same excitement as NMN or Urolithin A, but here’s the honest reality: if you’re deficient in any of them, nothing else on this list works as well as it should.

Magnesium is required for over 300 enzymatic reactions, including several steps in the Krebs cycle that produce ATP. It’s also rapidly depleted by oxidative stress — meaning the people who need it most are often the ones who have the least. Glycinate and malate are the most bioavailable forms. For sleep specifically, magnesium glycinate is particularly well-supported.[13]

B vitamins — particularly B1 (thiamine), B2 (riboflavin), and B3 (niacinamide) — have direct roles in the electron transport chain and ATP synthesis. Niacinamide specifically is a direct NAD+ precursor, contributing to the same pathway that NMN and NR support.[14]

Vitamin D receptors are found in mitochondrial membranes, and deficiency impairs ATP production and mitochondrial respiration. Roughly 70% of adults are deficient. Vitamin D3 is best combined with K2 (MK-7 form) to ensure calcium is directed into bones rather than arterial walls.[15]

Dosing: Magnesium 300–400 mg (glycinate or malate); Vitamin D3 2,000–5,000 IU with K2 100 mcg; B vitamins best from a quality B complex or as individual supplements.

8. L-Ergothioneine: The Mitochondria-Specific Antioxidant

This one doesn’t get much coverage outside specialized longevity circles, but the mechanism is worth understanding. L-ergothioneine is an amino acid with its own dedicated mitochondrial transporter — meaning the body has evolved a specific system for concentrating it in high-energy tissues. It’s naturally found in mushrooms, but not at levels achievable from diet alone.

Emerging research suggests L-ergothioneine protects mitochondrial DNA and membranes from oxidative damage specifically in high-demand tissues like the heart, brain, and liver. Larger human trials are still underway, so the evidence is early-stage — but the mechanistic specificity is compelling. It’s included in the RejuvenAid formula alongside Urolithin A and ALCAR.[16]

Lifestyle Habits That Genuinely Support Mitochondrial Health

Supplements work better alongside lifestyle — and for some people, these interventions move the needle more than anything they’re taking.

Exercise — Especially HIIT

Physical activity is the most evidence-backed intervention for mitochondrial biogenesis. High-intensity interval training (HIIT) in particular triggers PGC-1α activation — the same pathway PQQ targets — stimulating the creation of new mitochondria. Even moderate walking improves mitochondrial efficiency over time. You don’t need an extreme protocol; you need consistency and, periodically, intensity.[17]

Fasting and Time-Restricted Eating

Going without food for 12–16 hours activates AMPK — the cellular energy sensor — which in turn triggers both autophagy and mitophagy. This is one of the most direct ways to promote mitochondrial cleanup through lifestyle. Time-restricted eating (eating within an 8–10 hour window) achieves this without extended fasting.[18]

Sauna and Cold Exposure

Heat stress activates heat shock proteins that protect mitochondria from oxidative damage, and regular sauna use has been linked to improved mitochondrial biogenesis. Cold exposure activates brown adipose tissue, which is exceptionally mitochondria-dense, and may stimulate mitochondrial production in other tissues as well.[19][20]

Sleep

Most mitochondrial repair happens during sleep. Inadequate sleep increases oxidative stress, impairs the cellular cleanup systems, and accelerates mitochondrial dysfunction — and those effects compound over time. Seven to nine hours isn’t a lifestyle preference; it’s metabolic maintenance.[21]

Diet

A diet that limits ultra-processed foods and refined sugar reduces the oxidative burden your mitochondria have to manage. Omega-3 fatty acids maintain mitochondrial membrane integrity. Polyphenol-rich foods — berries, dark leafy greens, cruciferous vegetables — support the antioxidant systems that protect mitochondrial DNA.[22]

🧬 MORE MITOCHONDRIA READS

Should You Test for Mitochondrial Dysfunction?

Supplementing blindly is the norm — but it doesn’t have to be. Two tests are worth knowing about, and they serve different purposes.

If you’re focused on NAD+ optimization — which covers the largest group of people reading this — the Intracellular NAD® Test is the most practical place to start. It measures NAD+ inside your cells (not just in plasma), using a simple at-home finger-prick kit with CLIA-certified results. Optimal range is 40–100 μM. Below that, you have a measurable deficiency that precursor supplementation can address. Above it, you know your current approach is working. Without this number, you’re adjusting dosage by feel.

If you suspect true mitochondrial dysfunction — multiple unexplained symptoms affecting different organ systems, a family history of mitochondrial disease, or persistent decline that doesn’t respond to conventional approaches — a MitoSwab test is worth discussing with your clinician. It’s a non-invasive cheek swab that measures the activity of Complex I, Complex IV, and citrate synthase (overall mitochondrial content) in buccal cells, with an 84% correlation to the traditional gold standard of muscle biopsy. It’s designed as a diagnostic tool for dysfunction, not a longevity optimization metric — but for people with complex presentations, it provides data that can meaningfully change the conversation with a specialist.

Frequently Asked Questions

What are the signs of poor mitochondrial health?

Persistent fatigue unrelated to sleep or stress, slow recovery from exercise or illness, brain fog, muscle weakness, and temperature intolerance are common signals. When multiple symptoms affect different organ systems without a clear diagnosis, mitochondrial dysfunction is worth investigating. Talk with your clinician about whether testing is appropriate.

Which supplement is most important for mitochondrial function?

NAD+ precursors (NMN or NR) have the broadest and most mechanistically central effect — NAD+ is involved in virtually every aspect of mitochondrial function. CoQ10 is a close second and is often deficient in older adults and statin users. That said, the right priority depends on your individual baseline; testing NAD+ levels first gives you a more accurate starting point.

Can you improve mitochondrial function without supplements?

Yes, meaningfully. HIIT exercise, time-restricted eating, adequate sleep, and reducing dietary oxidative burden all support mitochondrial function through mechanisms independent of supplementation. The evidence for exercise in particular is as strong as anything in the supplement literature.

How long does it take for mitochondrial supplements to work?

NAD+ precursors produce measurable changes in intracellular NAD+ within two to four weeks in most people. CoQ10 benefits in cardiac tissue are typically studied over 12-week periods. Results vary by individual, baseline status, and whether lifestyle factors are being addressed simultaneously.

What’s the difference between primary mitochondrial disease and age-related mitochondrial decline?

Primary mitochondrial disease is a genetic condition — mutations in mitochondrial or nuclear DNA that directly impair mitochondrial function, often presenting from birth or early childhood. Age-related mitochondrial decline is a gradual process affecting most adults, driven by NAD+ depletion, oxidative damage accumulation, and slowing of mitophagy. The two are very different in severity, mechanism, and appropriate intervention. Most people reading this are dealing with the latter.

Is CoQ10 or NMN better for mitochondria?

They work through different mechanisms and aren’t really comparable. NMN supports the NAD+ system that regulates mitochondrial quality control and biogenesis. CoQ10 works directly in the electron transport chain to support ATP production. Both have strong evidence; both address different parts of the same system. If you can only pick one, test your NAD+ levels first — that will tell you whether the upstream NAD+ pathway is the priority.

Referenced Sources

  1. Yusri K, Jose S, Vermeulen KS, Tan TCM, Sorrentino V. The role of NAD+ metabolism and its modulation of mitochondria in aging and disease. Springer Science and Business Media LLC; 2025. https://doi.org/10.1038/s44324-025-00067-0
  2. Xiong X, Hou J, Zheng Y, Jiang T, Zhao X, Cai J, et al. NAD+-boosting agent nicotinamide mononucleotide potently improves mitochondria stress response in Alzheimer’s disease via ATF4-dependent mitochondrial UPR. Springer Science and Business Media LLC; 2024. https://doi.org/10.1038/s41419-024-07062-1
  3. Wu CY, Reynolds WC, Abril I, McManus AJ, Brenner C, González-Irizarry G, et al. Effects of nicotinamide riboside on NAD+ levels, cognition, and symptom recovery in long-COVID: a randomized controlled trial. Elsevier BV; 2025. https://doi.org/10.1016/j.eclinm.2025.103633
  4. Nicolson G. Mitochondrial Dysfunction and Chronic Disease: Treatment With Natural Supplements. Integrative Medicine. 2014;13(4):35–43.
  5. Deichmann R, Lavie C, Andrews S. Coenzyme q10 and statin-induced mitochondrial dysfunction. Ochsner Journal. 2010;10(1):16–21.
  6. Liu S, D’Amico D, Shankland E, Bhayana S, Garcia JM, Aebischer P, et al. Effect of Urolithin A Supplementation on Muscle Endurance and Mitochondrial Health in Older Adults. American Medical Association (AMA); 2022. https://doi.org/10.1001/jamanetworkopen.2021.44279
  7. Liu S, Faitg J, Tissot C, Konstantopoulos D, Laws R, Bourdier G, et al. Urolithin A provides cardioprotection and mitochondrial quality enhancement preclinically and improves human cardiovascular health biomarkers. Elsevier BV; 2025. https://doi.org/10.1016/j.isci.2025.111814
  8. Hwang PS, Machek SB, Cardaci TD, Wilburn DT, Kim CS, Suezaki ES, et al. Effects of Pyrroloquinoline Quinone (PQQ) Supplementation on Aerobic Exercise Performance and Indices of Mitochondrial Biogenesis in Untrained Men. Informa UK Limited; 2019. https://doi.org/10.1080/07315724.2019.1705203
  9. Superti F, Russo R. Alpha-Lipoic Acid: Biological Mechanisms and Health Benefits. MDPI AG; 2024. https://doi.org/10.3390/antiox13101228
  10. Malaguarnera M, Cammalleri L, Gargante MP, Vacante M, Colonna V, Motta M. l-Carnitine treatment reduces severity of physical and mental fatigue and increases cognitive functions in centenarians: a randomized and controlled clinical trial. Elsevier BV; 2007. https://doi.org/10.1093/ajcn/86.5.1738
  11. Chapman J, Fielder E, Passos JF. Mitochondrial dysfunction and cell senescence: deciphering a complex relationship. Wiley; 2019. https://doi.org/10.1002/1873-3468.13498
  12. Deepika, Maurya PK. Health Benefits of Quercetin in Age-Related Diseases. MDPI AG; 2022. https://doi.org/10.3390/molecules27082498
  13. Fatima G, Dzupina A, B Alhmadi H, Magomedova A, Siddiqui Z, Mehdi A, et al. Magnesium Matters: A Comprehensive Review of Its Vital Role in Health and Diseases. Springer Science and Business Media LLC; 2024. https://doi.org/10.7759/cureus.71392
  14. Depeint F, Bruce WR, Shangari N, Mehta R, O’Brien PJ. Mitochondrial function and toxicity: Role of the B vitamin family on mitochondrial energy metabolism. Elsevier BV; 2006. https://doi.org/10.1016/j.cbi.2006.04.014
  15. Ricca C, Aillon A, Bergandi L, Alotto D, Castagnoli C, Silvagno F. Vitamin D Receptor Is Necessary for Mitochondrial Function and Cell Health. MDPI AG; 2018. https://doi.org/10.3390/ijms19061672
  16. Gede AMMI, Gu Q, Phukhatmuen P, Xiong J, Zhang S, Yi M, et al. Advances and prospects of ergothioneine in the treatment of cognitive frailty. Informa UK Limited; 2025. https://doi.org/10.1080/07853890.2025.2555742
  17. Torma F, Gombos Z, Jokai M, Takeda M, Mimura T, Radak Z. High intensity interval training and molecular adaptive response of skeletal muscle. Elsevier BV; 2019. https://doi.org/10.1016/j.smhs.2019.08.003
  18. Wilhelmi de Toledo F, Grundler F, Sirtori CR, Ruscica M. Unravelling the health effects of fasting: a long road from obesity treatment to healthy life span increase and improved cognition. Informa UK Limited; 2020. https://doi.org/10.1080/07853890.2020.1770849
  19. Polla BS, Kantengwa S, François D, Salvioli S, Franceschi C, Marsac C, et al. Mitochondria are selective targets for the protective effects of heat shock against oxidative injury. Proceedings of the National Academy of Sciences; 1996. https://doi.org/10.1073/pnas.93.13.6458
  20. Huo C, Song Z, Yin J, Zhu Y, Miao X, Qian H, et al. Effect of Acute Cold Exposure on Energy Metabolism and Activity of Brown Adipose Tissue in Humans: A Systematic Review and Meta-Analysis. Frontiers Media SA; 2022. https://doi.org/10.3389/fphys.2022.917084
  21. Richardson RB, Mailloux RJ. Mitochondria Need Their Sleep: Redox, Bioenergetics, and Temperature Regulation of Circadian Rhythms and the Role of Cysteine-Mediated Redox Signaling, Uncoupling Proteins, and Substrate Cycles. MDPI AG; 2023. https://doi.org/10.3390/antiox12030674
  22. Do LH, Da Costa RT, Solesio ME. Effects of nutrients and diet on mitochondrial dysfunction: An opportunity for therapeutic approaches in human disease. Elsevier BV; 2025. https://doi.org/10.1016/j.biopha.2025.118493
NAD dosage featured image - NAD supplements falling against blue background

NAD Dosage Per Day: Optimal Amounts, Timing, and Frequency

NAD+ (nicotinamide adenine dinucleotide) is a coenzyme your cells use to produce energy, repair DNA, and stay healthy as you age.

Most NAD dosage guides hand you a milligram number and call it a day. The problem is that number comes from population averages, and your cells don’t care about averages.

Two people the same age taking the same NAD+ supplement can land in completely different places. One reaches optimal cellular levels in four weeks. The other barely moves the needle.

This guide covers research-backed dose ranges for every form of NAD+ supplementation — plus the one step most people skip that makes the difference between guessing and actually knowing.

Always consult a healthcare provider before starting any new supplement regimen.

What You Should Know

  • NAD+ dosage ranges vary widely by form, from 250–900mg daily for oral supplements to 500–1,500mg per IV session
  • NAD+ declines between your 20s and your 50s, which means older adults typically need more to reach the same result
  • IV and injection therapies deliver NAD+ directly into the bloodstream but face real limitations when it comes to raising levels inside your cells
  • The only way to confirm a dose is working is to measure your actual intracellular NAD+ levels before and after supplementation

CLIA-Certified NAD Test Kit

Test your NAD+ levels from home. Find the right dosage for you.

Jinfiniti Intracellular NAD Test on purple background

NAD Dosage Chart

This dosage chart covers research-based ranges for each form of NAD+ supplementation. These are starting points, not prescriptions — where you land in a given range should reflect your baseline levels, age, health goals, and how your body responds.

FormTypical Dose RangeFrequency
NMN (oral)250–900mgOnce or twice daily
NR (oral)250–500mgOnce or twice daily
Niacinamide/NAM (oral)250–900mgOnce or twice daily
NAD IV Therapy500–1,500mg per sessionWeekly to monthly
NAD Subcutaneous Injection50–200mg per injection2–3x per week

One number that matters more than any of these ranges: your intracellular NAD+ target. That’s covered below.

The Smarter Way to Dose NAD+

Choosing a dose without knowing your baseline is like adjusting a medication without a blood test. Your NAD+ levels are specific to you — your age, genetics, inflammation load, and lifestyle all shape where you start and how you respond to supplementation.

Jinfiniti’s Intracellular NAD® Test measures NAD+ inside your actual cells — the only measurement that tells you what’s happening where it counts. The at-home, finger-prick test is CLIA-certified, returns results in about a week, and includes personalized dosage recommendations based on where your levels actually land.

Test. Know. Dose right.

NAD Dosage Per Day: What Research Shows

Human trials show that NAD precursors can raise NAD+ levels across a fairly wide dose range. The doses in the table above are based on that research.

  • NMN (nicotinamide mononucleotide): A systematic review of randomized controlled trials found human NMN doses ranged from 150 to 1,200 mg per day, with no major adverse effects reported. Studies using 250 to 900 mg per day showed meaningful increases in blood NAD+ levels. A separate review in Translational Medicine also found that 250 to 900 mg consistently raised NAD+, with larger doses producing bigger increases.[1][2]
  • NR (nicotinamide riboside): In a randomized, double-blind, placebo-controlled trial in adults ages 55 to 79, 500 mg twice daily for six weeks raised NAD+ levels in peripheral blood mononuclear cells by about 60%. In a separate open-label trial, doses from 250 to 2,000 mg per day doubled whole blood NAD+ on average, with no clinically meaningful safety issues reported.[3][4]
  • Niacinamide (NAM): Clinical research shows niacinamide is generally well tolerated at doses up to 3 grams per day, even with longer-term use. A single 900 mg dose, which matches the adult tolerable upper limit, measurably increased blood NAD+ levels within hours in healthy adults.[5][6]

What these studies cannot tell you is whether your current NAD+ level is low, normal, or already optimal. That is where testing becomes useful.

NAD daily dosage chart

Why the Right Dose Is Different for Everyone

The ranges in the table above come from clinical studies on groups of people. Your optimal dose of NAD supplements depends on factors that no group average can account for.

Factors That Affect How Much You Need

Age is the most consistent predictor. NAD+ levels by age follow a predictable decline — by your 50s, you typically have about half the intracellular NAD+ you had at 20. Older adults generally need higher doses to move the needle.

Beyond age, a few other factors shape your individual requirements:

  • CD38 enzyme activity: CD38 is an enzyme that breaks down NAD+. It rises with age and inflammation, actively depleting NAD+ stores. Higher CD38 activity means you may need more supplementation just to maintain levels.[7]
  • Genetics: Variations in genes like NAMPT — which helps convert nicotinamide into NMN — affect how efficiently your body processes precursors. Some people convert more easily than others.[8]
  • Stress and exercise: Intense training, chronic stress, and certain health conditions all increase your body’s NAD+ demand, raising the effective dose you need to see results.[9]

Choosing the Right NAD+ Form

The form you take matters as much as the dose. Each type of NAD therapy has a different absorption mechanism, a different body of evidence behind it, and a different track record for actually raising intracellular NAD+ levels.

Oral Supplements: NMN, NR, and Niacinamide

Oral NAD+ precursors are the most studied and most practical route for healthy aging support and long-term use. NMN (nicotinamide mononucleotide) and NR (nicotinamide riboside) are the two most researched options — both are direct precursors that your body converts into NAD+ inside cells.

Niacinamide (also called nicotinamide or NAM) is the most basic building block. It requires more conversion steps, but it’s well-tolerated at higher doses and meaningfully raises NAD+ levels when dosed appropriately.

Single-ingredient supplements raise NAD+ to a point. But clinical data on NAD boosters consistently shows that multi-ingredient formulas — ones that support NAD+ production through multiple metabolic pathways simultaneously — outperform standalone precursors for reaching and maintaining optimal intracellular levels.

NAD IV Therapy

IV therapy delivers 500–1,500mg per session directly into the bloodstream, typically over two to four hours in a clinical setting. Sessions are spaced weekly to monthly depending on the protocol.

The important caveat: NAD+ is a large molecule, too large to cross cell membranes intact. When it’s delivered intravenously, circulating blood levels rise temporarily — but intracellular levels, the measure that actually reflects what your cells have access to, may not follow. As Dr. Eric Verdin, President of the Buck Institute for Research on Aging, has noted, “NAD+ is too big to enter cells and is mostly broken down into nicotinamide when injected.”

IV therapy is expensive ($300–800 per session), time-consuming, and lacks the controlled trial evidence that oral precursors have behind them. For a full breakdown of how the two approaches compare, see NAD injections vs. oral supplements.

Subcutaneous NAD+ Injections

The typical NAD+ injection dosage per day ranges from 50–200mg per dose, administered two to three times per week. Subcutaneous (under the skin) injections bypass digestion and deliver NAD+ directly into tissue near the bloodstream.

The intracellular limitation applies here too. Clinical data shows that even at daily high doses, subcutaneous injections lag behind a well-formulated oral multi-pathway supplement when it comes to reaching the 40–100μM intracellular target. Injections require medical supervision, carry more logistical complexity, and cost significantly more than oral options over time.

What “Optimal” NAD+ Levels Actually Means

Here’s the piece most dosage guides leave out entirely. A milligram dose is not your goal. An intracellular level is — and that level is the most direct measure of your cellular health.

Dr. Jin-Xiong She, founder of Jinfiniti Precision Medicine and a genomic researcher with over 400 peer-reviewed publications, established the following clinical framework based on intracellular NAD+ measurements across thousands of patients:

LevelIntracellular NAD+ Range
Too High>100μM
Optimal40–100μM
Suboptimal30–40μM
Deficient20–30μM
Severely Deficient0–20μM

“The goal isn’t a specific milligram dose — it’s reaching and sustaining the optimal intracellular range,” says Dr. She. “Two people can take the same supplement at the same dose and end up in very different places. Testing is the only way to know.”

Levels above 100μM appear to offer no additional benefit and may carry risk. Levels below 40μM mean your cells aren’t getting what they need — regardless of which supplement you’re taking or how consistently you take it.

How to Find Your Right Dose

The most reliable approach to NAD+ dosing is a simple two-step process.

Step 1: Test Your Baseline

Test before you start supplementing. This tells you exactly where your levels sit before any intervention. Learn more about what how to test your NAD+ levels involves and what to look for in a reliable test.

A standard blood panel won’t give you this information. Intracellular NAD+ testing specifically measures the NAD+ inside your cells — which is what governs energy production, DNA repair, and the cellular processes that drive your overall health.

Step 2: Start Supplementing and Retest at 3–4 Weeks

A standard starting point with the Vitality NAD+ Booster is two scoops or two lozenges daily (2,000mg of the multi-ingredient formula), split between morning and evening. Retest at three to four weeks.

If levels are still below 40μM, a modest dose increase is typically the next step. If levels land above 100μM, pulling back slightly makes sense. The goal is to find the lowest effective dose that keeps you in the 40–100μM range consistently.

For a detailed look at what to expect from that process, see NMN before and after results.

When to Take NAD+ for Best Results

Timing doesn’t override dose — but it does matter for consistency and comfort.

Morning vs. Evening

Splitting your dose between morning and evening works best for most people. A morning serving aligns with your body’s natural energy production cycle and supports daytime focus and stamina. The evening serving supports overnight cellular repair processes.

If you notice any mild energizing effect from NAD+ supplementation, keep the evening dose earlier in the day rather than close to bedtime. Most people tolerate the split schedule without issue.

Signs Your Dose Needs Adjusting

Subjective experience is useful, but it’s not a substitute for a retest. Persistent fatigue, brain fog, and poor mental clarity are among the most reliable signs that your levels haven’t reached the optimal range yet. That said, there are specific patterns worth paying attention to between testing windows.

  • Fatigue persists after four weeks: Levels may still be suboptimal. A dose increase and retest is the right next step.
  • Energy improves and then plateaus: Common signal that you’ve moved into the suboptimal range but haven’t reached optimal yet.
  • Sleep quality isn’t improving: Poor sleep is one of the most consistent signs of low intracellular NAD+. If this isn’t shifting, your dose may need adjusting.
  • No subjective change at all: Don’t increase dose based on feel alone. Test first — some people feel little change even as levels move meaningfully, while others notice improvements before their numbers confirm it.

The retesting window of three to four weeks gives your cells enough time to respond to a changed dose before you draw conclusions.

When Dose Isn’t the Whole Story

A single NAD+ precursor can help, but it may not be enough to get people into the optimal range.

In a functional medicine clinic comparison, 12 patients took a standalone precursor from another brand and tested intracellular NAD+ before and after using Jinfiniti’s CLIA-certified NAD Test. Their levels rose, but none reached the 40 μM optimal threshold.

The same 12 patients then switched to Vitality NAD+ Booster, and all of them reached optimal intracellular NAD+ levels.

The difference is the multi-pathway formula. Vitality pairs NMN and niacinamide, which feed NAD+ through different precursor routes, with creatine monohydrate and D-ribose, which help support cellular energy use.

That pattern also showed up in Jinfiniti’s clinical testing of 26 adults ages 35 to 65. After taking 2,000 mg daily for four weeks, 85% reached optimal intracellular NAD+ levels and NAD+ doubled on average. Vitality is also the only oral NAD+ supplement with clinical data showing stronger intracellular results than subcutaneous NAD+ injections at a much lower cost.

Frequently Asked Questions

What is the best time of day to take NAD supplements?

Morning is the most practical time for most people, since NAD+ supports cellular energy production and some users notice a mild energizing effect. Splitting the daily dose between morning and evening tends to work better than a single serving — the morning dose supports daytime function, while the evening dose supports overnight cellular repair.

How often should you take NAD+?

Daily dosing is the standard for oral NAD+ supplements. Levels need consistent replenishment to stay in the optimal range, and skipping days allows them to drift back down. For IV therapy, sessions are typically spaced weekly to monthly. Subcutaneous injections are usually administered two to three times per week.

What is the best way to take NAD?

Oral supplementation is the most practical and well-evidenced approach for long-term use. Powder and lozenges are the two main formats — powder is easy to adjust by the scoop, while lozenges use sublingual absorption to bypass digestion for faster delivery. IV and injection routes are available but come with higher cost, greater inconvenience, and real limitations around intracellular effectiveness.

How much NAD injection should I take?

The typical subcutaneous NAD+ injection dosage per day is 50–200mg, administered two to three times per week. Loading protocols may use 100–200mg daily for seven to ten days before stepping to a maintenance frequency. IV NAD+ therapy typically runs 500–1,500mg per session. All injection and IV protocols should be overseen by a healthcare provider.

Is NAD therapy safe? What are the side effects?

Oral NAD+ supplements have a strong safety profile across clinical research. The most commonly reported side effects are mild and temporary — occasional nausea, flushing, or light stomach discomfort, particularly when starting at higher doses. IV and injection therapies carry a higher risk of side effects including chest tightness, headache, and nausea, and should only be administered under medical supervision.

Referenced Sources

  1. Wen J, Syed B, Kim S, Shehabat M, Ansari U, Razick DI, et al. Improved Physical Performance Parameters in Patients Taking Nicotinamide Mononucleotide (NMN): A Systematic Review of Randomized Control Trials. Springer Science and Business Media LLC; 2024. https://doi.org/10.7759/cureus.65961
  2. Liao G, Xie Y, Peng H, Li T, Zou X, Yue F, et al. Advancements in NMN biotherapy and research updates in the field of digestive system diseases. Springer Science and Business Media LLC; 2024. https://doi.org/10.1186/s12967-024-05614-9
  3. Biţă A, Scorei IR, Ciocîlteu MV, Nicolaescu OE, Pîrvu AS, Bejenaru LE, et al. Nicotinamide Riboside, a Promising Vitamin B3 Derivative for Healthy Aging and Longevity: Current Research and Perspectives. MDPI AG; 2023. https://doi.org/10.3390/molecules28166078
  4. Airhart SE, Shireman LM, Risler LJ, Anderson GD, Nagana Gowda GA, Raftery D, et al. An open-label, non-randomized study of the pharmacokinetics of the nutritional supplement nicotinamide riboside (NR) and its effects on blood NAD+ levels in healthy volunteers. Public Library of Science (PLoS); 2017. https://doi.org/10.1371/journal.pone.0186459
  5. Hwang E, Song S. Possible Adverse Effects of High-Dose Nicotinamide: Mechanisms and Safety Assessment. MDPI AG; 2020. https://doi.org/10.3390/biom10050687
  6. Ito TK, Sato T, Takanashi Y, Tamannaa Z, Kitamoto T, Odagiri K, et al. A single oral supplementation of nicotinamide within the daily tolerable upper level increases blood NAD+ levels in healthy subjects. Elsevier BV; 2021. https://doi.org/10.1016/j.tma.2021.09.001
  7. Camacho-Pereira J, Tarragó MG, Chini CCS, Nin V, Escande C, Warner GM, et al. CD38 Dictates Age-Related NAD Decline and Mitochondrial Dysfunction through an SIRT3-Dependent Mechanism. Elsevier BV; 2016. https://doi.org/10.1016/j.cmet.2016.05.006
  8. Zhang W, Ren H, Chen W, Hu B, Feng C, Li P, et al. Nicotinamide phosphoribosyltransferase in NAD+ metabolism: physiological and pathophysiological implications. Springer Science and Business Media LLC; 2025. https://doi.org/10.1038/s41420-025-02672-w
  9. Conlon NJ. The Role of NAD+ in Regenerative Medicine. Ovid Technologies (Wolters Kluwer Health); 2021. https://doi.org/10.1097/prs.0000000000009673
NAD Injection Side Effects

NAD Injections Side Effects: Common Reactions and Red Flags

NAD injections (and NAD IV therapies) are marketed as a fast track to higher NAD+, but the delivery method can come with a very specific kind of discomfort. Think cramping, nausea, flushing, and a “this is intense” sensation that often improves as soon as the infusion slows or stops.

This guide breaks down what side effects are common, what’s a red flag, and how to lower risk if you choose to proceed. The big idea is simple: test your NAD+ level first, because the safest intervention is the one you actually need.

What You Should Know

  • Most NAD injection side effects are dose and timeframe related, and improve when dosing slows.
  • Chest pressure, rapid heartbeat, or severe nausea are common reasons clinics reduce infusion rate.
  • Injections and IVs add procedure risks (infection, vein irritation) that oral options avoid.
  • Testing your baseline NAD level helps you pick the safest, most effective next step.

CLIA-Certified NAD Test Kit

Test your cellular NAD+ levels from home.

Jinfiniti Intracellular NAD Test on purple background

What Counts as an “NAD Injection” (and Why Side Effects Vary)

People use “NAD injections” to mean a few different things, and the side effects can look different depending on the route.

SubQ vs IM vs IV: three routes, three experiences

  • SubQ (subcutaneous): injected into the fatty layer under the skin. Often described as “less dramatic” than an IV, but still capable of causing nausea, flushing, or fatigue.
  • IM (intramuscular): injected into muscle. Tends to sting more at the site and can leave soreness.
  • IV (intravenous): infused into a vein over time. This route is most associated with infusion related symptoms like cramping and chest pressure.

If you want a broader primer on the pros, cons, and costs, see our NAD injections guide.

NAD+ vs NAD precursors (why the molecule matters)

NAD+ is a large molecule, and human data suggests it can be rapidly processed in the bloodstream during IV infusion.[1]

Oral supplements usually use precursors (building blocks) like NMN and NR that your cells convert into NAD+. That difference helps explain why oral strategies often feel gentler day to day.

To see how NMN and NR compare, read NMN and NR compared.

Common NAD Injection Side Effects (and How to Manage Them)

Most side effects fall into two buckets: infusion related symptoms (often speed dependent) and local injection site reactions.

Common side effects

Side effectWhen it shows upWhy it happens (plain English)What may helpWhen to stop and seek care
Nausea or stomach crampsDuring IV, especially faster ratesSmooth muscle and autonomic response to rapid infusionSlow the infusion, sip water, restPersistent vomiting, severe pain, dehydration
Chest pressure or tightnessDuring IVSensation often linked to rate and physiologic stress responseSlow or pause infusionChest pain, shortness of breath, fainting
Rapid heartbeat or “wired” feelingDuring IVStress response, rate sensitivitySlow infusion, deep breathing, monitoringPalpitations with dizziness or chest pain
Flushing or warmthDuring or shortly afterBlood vessel responsePause, cool room, hydrationSwelling of lips/face, hives, wheezing
HeadacheSame dayDehydration, blood pressure changes, stress responseFluids, restWorst headache of your life, neuro symptoms
Fatigue the next day6–24 hoursStress load, sleep disruption, hydration shiftsPrioritize sleep, electrolytesSevere weakness, confusion
Injection site soreness0–48 hoursLocal tissue irritationWarm compress, gentle movementSpreading redness, pus, fever
BruisingSame daySmall blood vessel injuryPressure after injection, avoid heavy liftingLarge expanding bruise, severe pain

A real world tolerability review of NAD+ IV reported that people commonly experienced moderate to severe gastrointestinal symptoms, increased heart rate, and chest pressure during infusion.[2]

One line from the paper captures what clinics see in practice:

“Participants that received NAD+ IV reported moderate to severe gastrointestinal symptoms, increased heart rate, and chest pressure.” (Frontiers, 2026) Symptoms resolved when the infusion ended.

Managing infusion discomfort

Clinics often adjust side effects by adjusting rate, dose, and monitoring.

  • Start lower than your ego wants. The goal is tolerability first.
  • Ask about infusion speed. Faster infusions tend to feel rougher.
  • Hydrate before and after. Dehydration makes everything louder.
  • Track symptoms in real time. If nausea spikes, tell the clinician immediately.

Here’s a useful mental rule: if the plan relies on “push through it,” the plan needs editing.

Managing injection site reactions

For SubQ or IM shots, local discomfort is common.

  • Keep the area clean and avoid scratching.
  • Use a warm compress for soreness.
  • Watch for spreading redness, warmth, or drainage.

If you develop fever, expanding redness, or increasing pain, treat it like an urgent medical issue.

Adverse Reactions and Red Flags: When to Stop

A little discomfort is one thing. A true adverse reaction is another.

Seek urgent medical care if you have

  • Chest pain, shortness of breath, fainting, or confusion
  • Swelling of the lips, tongue, or face
  • Hives, wheezing, or trouble breathing
  • High fever or rapidly worsening injection site redness
  • Severe one sided leg swelling or calf pain (possible clot)

If you have any cardiac history, clotting risk, or complex medical conditions, do not treat NAD injections like a casual wellness add on.

Infographic showing the most common NAD injections side effects with a warning

Procedure Risks That Aren’t “NAD Side Effects”

Even if the NAD itself were perfectly tolerated, injections and IVs come with their own risks.

Infection risk is about technique

Safe injection practice depends on sterile technique. CDC guidance emphasizes using aseptic technique and a new sterile syringe and needle for each injection.

If a clinic cannot clearly explain their sterile process, that’s your answer.

Compounding and quality control matter

Some clinics add ingredients to IV bags or compound products in house. The FDA has warned about adverse events associated with drug products compounded under insanitary conditions in medical office settings.

Ask directly where the product comes from and how sterility is ensured.

Vein irritation and thrombophlebitis

Any IV catheter can irritate a vein. In some cases that inflammation is tied to clot formation, a condition called thrombophlebitis.

Most people never experience this, but the risk is unique to needles and IVs.

🧬 More NAD Reading

Who Should Be Extra Cautious with NAD Injections

This is the section where “talk to your clinician” stops being boilerplate and becomes practical.

Consider extra caution if you

  • Are pregnant or breastfeeding
  • Take blood thinners or have a bleeding disorder
  • Have uncontrolled high blood pressure or unstable heart rhythm
  • Have immune suppression or a history of frequent infections
  • Have a history of severe allergies or anaphylaxis

If your clinic is willing to treat these as non issues, find a more careful clinic.

Do NAD Injections Actually Raise Intracellular NAD?

This is the part most marketing skips. Your goal is not “NAD in a bag.” Your goal is NAD inside cells.

Human data on IV NAD+ suggests it can be rapidly removed from plasma during infusion and metabolized into other compounds. That doesn’t prove injections never help, but it does mean the relationship between infusion and intracellular NAD is not guaranteed.[1]

That uncertainty is why we recommend measuring intracellular NAD directly instead of assuming.

Test First: The Simplest Way to Reduce Risk

If you don’t know your baseline, you don’t know if you’re correcting a deficiency or chasing a feeling.

Dr. She’s NAD level ranges (quick reference)

CategoryIntracellular NAD (μM)What it usually implies
Optimal40–100Generally the “target zone” for cellular support
Suboptimal30–40May benefit from a structured plan
Deficient20–30Often worth addressing intentionally
Severely deficient0–20Consider more careful follow up and retesting
Too high>100More is not always better, and may not add benefit (consider homocysteine testing with your clinician)

Dr. Jin-Xiong She, PhD, puts it simply:

“If you can’t measure your NAD, you’re guessing at both need and dose.”

To learn the practical steps, see how to test your NAD levels.

If you want a baseline plus clinical grade reporting, our Intracellular NAD® Test measures NAD from an at home finger prick sample.

Oral Supplementation: A Safer First Line for Most People

For most people, oral NAD precursor supplementation is the easiest way to start, because you can titrate slowly and stop easily.

Human safety data is stronger for oral precursors

In a randomized controlled trial, nicotinamide riboside (NR) at 2,000 mg per day for 12 weeks showed no serious adverse events and supported safety labs.[3]

A randomized, double blind trial of NMN at 1,250 mg daily for 4 weeks in healthy adults also evaluated repeated dosing safety.[4]

That doesn’t mean oral is perfect for everyone. It does mean the evidence base is clearer and the risk profile is generally simpler.

A practical upgrade: multi pathway oral support

Our Vitality ↑® NAD+ Booster combines NMN, niacinamide, creatine monohydrate, and D ribose in a multi pathway formula.

In our clinical data, 22 of 26 participants (85%) reached optimized NAD levels in 4 weeks, and average NAD levels doubled (using our intracellular NAD testing approach). (See the clinical results PDF summary in the Vitality materials.)

If you want a guide to dosing logic, our NAD dosage and frequency guide is a helpful companion.

NAD Injections vs Oral NAD: Side Effects and Safety Compared

If you’re choosing between routes, the most useful comparison is “risk and control,” not hype.

ApproachHow It WorksDownsidesDosing ControlFirst Step
NAD IVRapid infusion into bloodstreamCramping, nausea, chest pressure, heart rate changes; procedure risksInfusion rate and monitoring, but harder to self adjustTest baseline, then decide if it’s worth it
NAD injections (SubQ or IM)Bolus dose into tissueSite pain, bruising, infection riskDose size, but limited monitoringTest baseline and start conservative
Oral precursors (NMN, NR, blends)Give cells building blocksMild GI symptoms at higher doses in some peopleEasy titration and stoppingStart low, retest and adjust
Lifestyle (sleep, exercise, diet)Support NAD metabolism indirectlyTakes time, needs consistencyFully under your controlPair with testing for feedback

If you want more context, our guide on NAD injections vs oral supplements lays out the bigger picture.

A Simple Plan to Manage Side Effects and Reduce Risk

Here’s the approach we use internally because it keeps you out of guessing games.

  1. Test: Get a baseline intracellular NAD level.
  2. Act: Start with oral support first (or lifestyle foundations) unless there’s a clear clinical reason to escalate.
  3. Optimize: Retest after a few weeks and adjust dose based on data.

If you want the whole workflow in one bundle, the NAD Optimization® Starter Package pairs two NAD tests with Vitality and a consultation.

Frequently Asked Questions

Questions pop up fast with this topic. Here are the ones we see most.

Are NAD injections FDA approved?

NAD is a molecule your body makes naturally, but “NAD injection therapy” is not a single FDA approved standardized treatment the way a prescription drug is. Delivery, sourcing, and protocols vary by clinic.

How long do NAD injection side effects last?

Infusion related symptoms often calm down as soon as the infusion stops or slows. Site soreness from injections can last 1–2 days.

What’s the most common reason people feel awful during an NAD IV?

In the tolerability review, NAD+ IV was linked with GI symptoms, increased heart rate, and chest pressure, which often led to longer infusion times.

Can I do NAD shots at home?

While home administration is possible with a prescription, it requires strict adherence to sterile techniques and verified sourcing. Improper self-injection increases the risk of localized infection, vascular issues, and incorrect dosing. It is highly recommended to receive your first few doses in a clinical setting to monitor for adverse reactions.

Is oral NAD “as good” as injections?

Oral precursors have more human safety data and are easier to dose and stop. If your goal is intracellular NAD optimization, testing makes the decision much clearer.

Should I take niacin instead?

Niacin can raise NAD, but it comes with its own side effect profile (including flushing) and dosing nuance. If you’re considering it, see our niacin dosage guide.

Referenced Sources

  1. Grant R, Berg J, Mestayer R, Braidy N, Bennett J, Broom S, et al. A Pilot Study Investigating Changes in the Human Plasma and Urine NAD+ Metabolome During a 6 Hour Intravenous Infusion of NAD+. Frontiers Media SA; 2019. https://doi.org/10.3389/fnagi.2019.00257
  2. Reyna K, Heinzen G, Patel N, Ritter M, Siojo A, Legere H, et al. Intravenous infusion of nicotinamide adenine dinucleotide (NAD+) versus nicotinamide riboside (NR): a retrospective tolerability pilot study in a real-world setting. Frontiers Media SA; 2026. https://doi.org/10.3389/fragi.2026.1652582
  3. Dollerup OL, Christensen B, Svart M, Schmidt MS, Sulek K, Ringgaard S, et al. A randomized placebo-controlled clinical trial of nicotinamide riboside in obese men: safety, insulin-sensitivity, and lipid-mobilizing effects. Elsevier BV; 2018. https://doi.org/10.1093/ajcn/nqy132
  4. Fukamizu Y, Uchida Y, Shigekawa A, Sato T, Kosaka H, Sakurai T. Safety evaluation of β-nicotinamide mononucleotide oral administration in healthy adult men and women. Springer Science and Business Media LLC; 2022. https://doi.org/10.1038/s41598-022-18272-y
A patient receiving an eGFR blood test in a clinic

eGFR Blood Test: What It Means, Normal Range, and Next Steps

Reading your lab report and wondering “what does eGFR mean?” Trust us, you’re not alone. It stands for estimated glomerular filtration rate and it’s one of the primary numbers clinicians look at to understand how well your kidneys are filtering your blood.

It’s also a number that gets misunderstood quickly. eGFR is an estimate derived from your other lab values. A single “low” value does not definitively mean you have chronic kidney disease.

What You Should Know

  • eGFR is a calculated estimate of kidney filtration, not a direct measurement.
  • “Normal” depends on your age, trends over time, and whether there’s kidney damage on urine testing.
  • One low eGFR can be temporary from illness, dehydration, or medications.
  • The most helpful next test is usually a repeat eGFR plus a urine albumin-to-creatinine ratio (uACR).

CLIA-Certified Biomarker Panel

Test your eGFR with other markers of kidney function.

Jinfiniti AgingSOS green gradient background

What is eGFR in a Blood Test?

eGFR stands for estimated glomerular filtration rate, which is a way to approximate how much blood your kidneys filter each minute. The “glomeruli” are tiny filtering units inside your kidneys, and the “filtration rate” describes how efficiently they clear waste and extra fluid.

Most routine kidney panels do not “measure GFR” directly. Instead, your lab report lists an eGFR number that’s calculated from other values in your blood sample.

When people search “eGFR meaning” or “what is eGFR in blood test,” the simplest answer is this: it’s a quick snapshot of kidney filtration that helps flag reduced kidney function early.

How eGFR Is Calculated (and Why It’s an Estimate)

Your eGFR is usually calculated from serum creatinine level, plus factors like age and sex. Creatinine is a waste product made when your body uses creatine for energy, so it tends to rise when filtration slows.[1]

That calculation is useful, but it has blind spots. Anything that changes creatinine without changing filtration can nudge your eGFR up or down.

Creatinine: Helpful, but Easy to Skew

Creatinine is influenced by muscle mass, diet, supplements, and even last night’s workout. That’s why two people with the same kidney function can show different creatinine values.

If you’ve ever wondered whether supplements can confuse lab results, our guide to creatine vs creatinine breaks down what’s normal and what’s not.

CKD-EPI and the 2021 Update You May See on Your Report

Many laboratories now report eGFR using the 2021 CKD-EPI creatinine equation, which removed race from the calculation. A 2021 paper helped validate newer approaches, and some people saw their reported eGFR shift slightly after their lab switched formulas.[2]

If your report says “eGFR CKD-EPI,” it usually refers to the equation used, not a separate test.

When Cystatin C Can Make eGFR More Accurate

If creatinine is likely to mislead (very high muscle mass, low muscle mass, older age, or unusual diets), clinicians sometimes add cystatin C. Cystatin C is a protein produced by your cells at a steadier rate, and it can improve accuracy when creatinine is “noisy.”

If you want a plain-English deep dive, see our guide to cystatin C levels and normal ranges.

Infographic showing normal ranges for eGFR on a blood test

Normal eGFR Range (and Why Age Matters)

People often search “eGFR normal range” hoping for one clean cutoff. The reality is messier, because eGFR tends to decline as you get older, even in otherwise healthy adults.

Most labs flag an eGFR below 60 as “low,” but interpretation depends on your trend and whether there’s evidence of kidney damage. The National Kidney Foundation explains this age and context issue well, and even offers a handy eGFR calculator for professionals.

eGFR Test Results and Next Steps

Here’s a practical way to interpret common eGFR ranges (assuming the result is confirmed and not from an acute illness).

eGFR (mL/min/1.73m²)What it can meanWhat’s usually checked next
≥90Often normal filtrationLook for kidney damage on urine testing if there are risk factors (diabetes, high blood pressure)
60–89Mildly reduced or age-related declineRepeat labs and check urine albumin (uACR) if risk factors are present
45–59Moderately reduced filtrationConfirm persistence, check uACR, review meds, assess blood pressure and diabetes control
30–44More significant reductionSame as above, with closer follow-up and possible nephrology input
15–29Severe reductionUrgent evaluation and specialist care is common
<15Kidney failure rangeSpecialist-led care and planning is typical

That “1.73m²” is a standardized body surface area used for comparison across people, which is why eGFR is not a perfect individualized measurement.

Low eGFR: Common Causes (Not All Are Chronic Kidney Disease)

Seeing “eGFR low” on your results can feel like a siren. The key question is whether this is a one-time dip or a persistent pattern.

A single low number can happen when your body is under temporary stress, even if your kidneys are structurally fine.

Temporary Reasons eGFR Can Drop

These are some of the most common “false alarms” that can lower eGFR on a laboratory test:

  • Dehydration or poor fluid intake before the blood draw.
  • Recent vomiting, diarrhea, fever, or other acute illness.
  • Some medications, especially NSAIDs (like ibuprofen) in higher or frequent doses.
  • Intense exercise shortly before testing.
  • Recent creatine supplementation that raises creatinine without true damage in healthy people (context matters).

If any of these were true for you, repeating the test once you’re back to baseline is often more informative than spiraling over a single report.

Ongoing Causes of Reduced eGFR

When eGFR stays low, the most common long-term drivers are metabolic and vascular. The big ones include diabetes, high blood pressure, and underlying kidney diseases.

That’s one reason kidney results are often interpreted alongside blood sugar and inflammation markers, such as HbA1c and CRP.

eGFR Stages and How CKD Is Actually Diagnosed

It’s tempting to map one lab result to one diagnosis. Kidney guidelines do not work that way.

Chronic kidney disease is defined by either reduced eGFR or evidence of kidney damage that persists for at least 3 months.

Why Urine Albumin Matters as Much as eGFR

Kidney risk is staged using both eGFR and albuminuria (protein leakage into urine). A urine albumin-to-creatinine ratio (uACR) helps detect kidney damage even when eGFR is still “normal.”[3]

A urine albumin-to-creatinine ratio (uACR) is a key companion test because it changes long-term risk and follow-up decisions.

If you’re trying to connect related labs, it can also help to understand what albumin levels in blood can suggest about overall health and inflammation (even though urine albumin is the kidney-specific piece).

What To Do If Your eGFR Is Low

The best next step is usually not a supplement or a cleanse. It’s a clearer answer.

A repeat test plus the right companion labs often tells you whether you’re seeing a temporary fluctuation or a real trend.

A Simple Next-Step Checklist

  • Repeat creatinine and eGFR when you’re well hydrated and not acutely ill.
  • Add urine albumin-to-creatinine ratio (uACR) to look for kidney damage.
  • Review medications with your clinician, especially frequent NSAID use.
  • Check blood pressure and long-term glucose control (often with HbA1c).
  • Consider cystatin C if creatinine-based eGFR doesn’t fit your body type or situation.

When It’s Worth Calling a Clinician Quickly

Seek prompt medical advice if you see a rapid drop from your usual results, if your eGFR is very low, or if you have symptoms like swelling, shortness of breath, confusion, or very low urine output.

Those scenarios can signal an acute kidney problem that needs immediate evaluation.

How To Support Kidney Health (Without Guessing)

Kidney protection is mostly boring, which is good news. The habits that help are the same ones that reduce cardiovascular and metabolic risk.

Here’s what tends to matter most, based on guideline-level consensus.

  • Keep blood pressure in a healthy range and treat hypertension when present.
  • Control blood sugar if you have prediabetes or diabetes, since high glucose drives kidney damage over time.
  • Avoid frequent high-dose NSAIDs unless a clinician advises otherwise.
  • Aim for a balanced diet and adequate hydration, especially around testing.
  • Don’t “protein panic” without context. Protein targets should be personalized if CKD is confirmed.

If you’re tracking uric acid because of kidney stones or gout risk, our guide to uric acid test ranges can help you interpret that number alongside kidney function.

A Practical Perspective from Dr. Jin-Xiong She

Dr. Jin-Xiong She, PhD (genomic medicine researcher and founder of Jinfiniti), often reminds patients that kidney numbers need context.

“Your kidneys don’t wake up one morning and decide to ‘be low.’ If eGFR drops, your job is to find out whether it’s a temporary stress signal or a persistent pattern, then act on the cause.”

That’s also why Jinfiniti leans on the Test, Act, Optimize approach. You measure first, you respond based on data, and you retest to confirm what’s working.

If You Want a Bigger Health Picture

eGFR is a kidney-focused number, but it rarely exists in isolation. Blood pressure, glucose control, inflammation, and cardiovascular risk all push on kidney outcomes over time.

If you want to track kidney-relevant markers alongside a broader set of longevity biomarkers, the AgingSOS Essential Panel includes common kidney function markers like creatinine and cystatin C as part of a multi-system view.

All testing is processed through Jinfiniti’s high-complexity CLIA laboratory in Augusta, Georgia, which matters when you’re making health decisions based on lab results.

Frequently Asked Questions

What is eGFR in a blood test?

eGFR is an estimate of kidney filtration calculated from blood markers like creatinine plus age and sex.

What is a normal eGFR?

Many healthy adults fall above 90, but “normal” depends on age and whether there’s kidney damage on urine albumin testing.

Is eGFR 60 bad?

An eGFR below 60 is often flagged as low, yet CKD usually requires persistence for at least 3 months or evidence of kidney damage.

Can dehydration cause low eGFR?

Yes. Dehydration can raise creatinine temporarily, which lowers the calculated eGFR until you rehydrate and recover.

What does “eGFR CKD-EPI” mean?

It typically refers to the equation your lab used to calculate eGFR.

How often should eGFR be checked?

It depends on your risk factors and prior results. If a result is abnormal, repeating eGFR and adding uACR is a common next step.

What’s the difference between eGFR and GFR?

GFR is the concept (true filtration rate). eGFR is a calculated estimate used in routine laboratory testing.

Should I worry if creatinine is normal but eGFR is low?

Sometimes labs calculate eGFR in a way that creates borderline values, especially in older adults. Trends and urine albumin often matter more than one isolated number.

What tests help confirm chronic kidney disease?

A repeat eGFR plus urine albumin-to-creatinine ratio is foundational, along with evaluation of underlying causes.

Can you improve your eGFR levels?

Yes, especially if a low result was driven by dehydration, acute illness, or a medication effect. Long-term improvement depends on the underlying cause and risk-factor control.

Referenced Sources

  1. Mula-Abed WAS. Estimated Glomerular Filtration rate (eGFR): A Serum Creatinine-based Test for the Detection of Chronic Kidney Disease and its Impact on Clinical Practice. Oman Medical Journal; 2012. https://doi.org/10.5001/omj.2012.87
  2. Inker LA, Eneanya ND, Coresh J, Tighiouart H, Wang D, Sang Y, et al. New Creatinine- and Cystatin C–Based Equations to Estimate GFR without Race. Massachusetts Medical Society; 2021. Available from: https://doi.org/10.1056/nejmoa2102953
  3. Inoue K, Streja E, Tsujimoto T, Kobayashi H. Urinary albumin-to-creatinine ratio within normal range and all-cause or cardiovascular mortality among U.S. adults enrolled in the NHANES during 1999–2015. 2021.
Featured image showing the best at-home health test kits

The Best At-Home Health Test Kits in 2026: Full Comparison

At-home health testing got a glow-up. In 2026, the market spans everything from single-biomarker finger-prick kits to 100+ marker panels paired with dashboards, wearable integrations, and AI-assisted insights.

The important thing is that the good options don’t “do the testing” in your home. They use home-friendly collection and then send your sample to a regulated clinical lab, often a CLIA-certified laboratory in the U.S., for processing. That’s the line between a useful health signal and a glorified fortune cookie.

This guide compares the best home health test kits across three categories: comprehensive blood biomarker platforms, targeted single-purpose kits, and gut microbiome tests. You’ll also see how Jinfiniti’s AgingSOS Ultimate Panel fits as a longevity-first option processed at Jinfiniti’s high-complexity CLIA-certified lab.

Medical note: At-home tests can be powerful for screening and trend tracking. They don’t diagnose disease on their own or replace medical care.

What You Should Know

  • The most trustworthy kits send your sample to a CLIA-certified lab for analysis, not a mystery “instant” reader.
  • If you want longevity data, look for panels that include advanced aging markers, not just cholesterol and glucose.
  • Venous blood draws tend to be most precise, but high-quality capillary testing can still be useful for tracking trends.
  • The “best” kit depends on your goal: longevity, hormones, metabolic health, gut symptoms, or convenience.

Quick Picks (Best Home Tests by Goal)

  • Best longevity panel (deep aging markers): AgingSOS Ultimate Panel
  • Best for maximum biomarker breadth (big annual snapshot): Function Health
  • Best for frequent, at-home blood monitoring (convenience): SiPhox Health
  • Best all-in-one optimization bundle (data + action tools): OneTwenty
  • Best for integrating blood + DNA + wearables (data dashboard): InsideTracker
  • Best targeted tests on a budget (wide menu): Everlywell
  • Best targeted tests with clinician support: LetsGetChecked
  • Best for peer-reviewed validation focus: imaware
  • Best gut microbiome platform (actionable recommendations): Viome

Head-to-Head Comparison Table

PlatformTypical Price StyleWhat You TestSample TypeTurnaroundSupportBest For
Jinfiniti AgingSOS Ultimate PanelPer test + subscription options48 advanced longevity biomarkersBlood draw (mobile phlebotomy available)VariesExpert interpretation + consultationLongevity tracking, advanced aging markers
Function HealthAnnual membership~100 unique biomarkers, 2 rounds/yearVenous draw at labFast dashboard, notes laterClinician notes + action planBroadest blood snapshot
SiPhox HealthPer-test or membershipUp to ~60 biomarkersAt-home (finger-prick or EasyDraw upper-arm device)~1 weekDashboard + AI insightsFrequent tracking from home
OneTwentyAnnual membership tiers100+ biomarkers + wearable metricsLab draw, some at-home optionsDays to a weekCoaching + clinical support (model varies)“Done-for-you” optimization
InsideTrackerPlatform membership + add-on tests40+ biomarkersLab draw or mobile add-onDaysAction plan, strong integrationsBlood + DNA + wearables in one place
EverlywellPer testTargeted tests (30+ options)Finger-prick or saliva (varies)DaysPhysician-reviewed resultsNarrow questions, low entry cost
LetsGetCheckedPer testTargeted testsFinger-prick/saliva/urine (varies)DaysPhysician consults, treatment pathways for some testsResults plus clinical guidance
imawarePer testTargeted testsFinger-prickDaysData + limited telehealth (context dependent)Validation-forward testing
ViomePer test + subscription optionsGut microbiome, sometimes add-onsStool (and sometimes blood/saliva)WeeksFood guidance + supplements (optional)Gut-focused personalization
Tiny HealthPer test or membershipGut microbiomeStoolWeeksCoaching add-onsDeep DNA-based microbiome profile

Pricing and features can change. Treat this as a structured comparison, then confirm the exact current plan before you buy.

How We Ranked the Best At-Home Health Test Kits

We prioritized five things.

  • Lab standards: CLIA-certified lab processing when applicable, plus clear reporting.
  • Coverage: breadth of biomarkers (or depth in a specific domain like gut).
  • Sample quality: venous draw vs capillary, and how error-prone collection is.
  • Actionability: do you get next steps, not just red and green dots.
  • Support: clinician notes, consults, coaching, or treatment pathways.

Comprehensive Blood Biomarker Platforms

These are the heavy hitters. They’re designed for prevention, longevity tracking, and finding issues before you feel them.

Jinfiniti AgingSOS Ultimate Panel


CLIA-Certified Biomarker Panel

48 longevity biomarkers including NAD+ and Klotho.

Jinfiniti AgingSOS green gradient background

Most at-home platforms are built around “general wellness labs.” AgingSOS is built around aging biology. If your goal is healthspan optimization, you want markers that map to longevity mechanisms like inflammation, metabolic resilience, cardiovascular risk, oxidative stress, nutrient status, senescence signaling, and hormone balance.

At a glance

  • Panel depth: 48 advanced biomarkers designed for longevity and prevention
  • Sample: Blood draw (mobile phlebotomy available)
  • Processing: Run through Jinfiniti’s high-complexity CLIA-certified laboratory in Augusta, Georgia
  • Guidance: Free expert consultation included, plus personalized supplement and lifestyle recommendations
  • Two alternative panels at lower price points: Advanced Panel and Essential Panel

What it measures (and why that’s different):

  • Cellular resilience markers that are rarely available in mainstream DTC testing, including intracellular NAD+ and Klotho
  • Cardiovascular risk beyond basic cholesterol, including ApoB and Lp(a), plus expanded lipid fractions
  • Inflammation and senescence signaling, including multiple inflammatory cytokines and senescence markers (for example β-gal)
  • Metabolic depth, including insulin resistance and broader metabolic health markers
  • Oxidative stress and micronutrients, to help connect symptoms and performance issues to actionable drivers

Why the CLIA lab point matters:
Your sample is only as trustworthy as the lab that processes it. AgingSOS is processed inside Jinfiniti’s own high-complexity CLIA-certified lab, which is a meaningful quality signal for test performance, quality systems, and ongoing oversight.

Best for:

  • People who want a longevity-first baseline that goes beyond standard labs
  • Anyone running a serious “test, act, optimize” loop and planning to retest after interventions
  • Optimizers who want rare markers to validate whether their protocol is actually moving the needle

What to keep in mind:

  • A blood draw adds a little friction compared to mail-only kits, but it improves sample quality and expands what you can measure.
  • This is intentionally comprehensive. If you only need one answer (like vitamin D), a targeted test can cost less.

How to get more value from your results:

  • Pick one priority lever (lipids, insulin resistance, inflammation, micronutrients, hormones)
  • Make one meaningful change for 8–12 weeks
  • Retest on a schedule that matches the lever you’re pulling, then adjust

Function Health

Function Health is the “big snapshot” membership. It’s built for people who want broad, clinic-style bloodwork, twice a year, with a clean dashboard and clinician-reviewed guidance.

What you get:

  • Two rounds of testing per year, typically an annual panel around ~100 unique biomarkers plus a mid-year panel around ~60 tests
  • Coverage across heart health, hormones, thyroid, liver and kidney markers, heavy metals, nutrients, inflammation, and more

Collection experience:

  • Requires venous blood draws through partner lab locations
  • Many members report that the draw can be split into two appointments because of the number of vials

Results and interpretation:

  • Results often populate quickly in the dashboard
  • Clinician notes typically arrive later, so you get the numbers first and the narrative after

Who it’s best for:

  • People who want a wide, twice-yearly baseline and are comfortable doing in-lab blood draws
  • Anyone who prefers a dashboard and clinician notes over coaching calls and programs

Strengths:

  • Among the broadest biomarker coverage available in DTC memberships
  • Designed for longitudinal tracking so you can see trends, not just one-off values

Limitations:

  • Blood draw logistics and extra fees can add friction
  • Implementation support is lighter than coaching-heavy platforms

Tip: If you’re doing two rounds per year, plan your timing around life cycles that actually change biomarkers (training blocks, weight loss phases, diet shifts). That way your “before and after” is meaningful, not random.

SiPhox Health

SiPhox is the convenience-first option for people who want repeatable testing without living at a lab appointment desk. It’s designed around frequent cadence and at-home collection.

What you get:

  • Panels that can cover up to ~60 biomarkers, depending on the plan
  • A dashboard built for tracking trends, with wearable integrations and guided insights

Collection experience:

  • Uses at-home collection options, including a proprietary, needle-free upper-arm device (“EasyDraw”) for certain panels
  • Because at-home collection can be more error-prone, following prep and collection instructions matters more here than with venous draws

Results and interpretation:

  • Results are typically delivered in about 5–7 days
  • The platform leans into AI-assisted explanations, plus practical next steps and supplement recommendations

Who it’s best for:

  • People who want frequent trend tracking (monthly or quarterly style rhythms)
  • Anyone optimizing training, metabolism, sleep, or recovery who wants regular feedback loops

Strengths:

  • Convenience and cadence, which is what actually makes most people stick with testing
  • Often a strong value proposition when you want multiple tests per year

Limitations:

  • At-home collection can be less forgiving if you rush the process
  • If your goal is a single, ultra-deep yearly snapshot, some venous-based platforms may feel more complete

Tip: Treat it like a lab day. Hydrate, follow fasting instructions, avoid a brutal workout right before collection, and keep conditions consistent across retests.

OneTwenty (formerly Outlive.bio)

OneTwenty is the “full system” approach. Instead of stopping at results, it bundles testing with action tools like coaching, supplements, and clinical pathways.

What you get:

  • Multiple comprehensive blood panels per year (often positioned as 2–4 rounds depending on plan)
  • AI-driven insights, plus coaching support through chat
  • Personalized supplement packs and additional tools (for example, a smart scale)
  • Access to prescriptions in certain cases (for example, GLP-1s, HRT, TRT) when clinically appropriate

Collection experience:

  • Blood draws through a wide network of lab locations
  • Some plans offer at-home draw add-ons for convenience

Who it’s best for:

  • People who want “data plus execution,” not just dashboards
  • Anyone overwhelmed by biomarker results who wants a guided path from numbers to decisions

Strengths:

  • One of the most implementation-forward models in this space
  • Bundling can reduce decision fatigue because it packages testing and follow-through

Limitations:

  • It’s a newer platform, so feature sets and workflows may evolve
  • As with any bundled model, value depends on whether you’ll actually use the coaching and action tools

Tip: If you choose an all-in-one platform, commit to one measurable outcome per quarter (ApoB down, fasting insulin down, hs-CRP down, ferritin normalized). Otherwise you’re just collecting pretty graphs.

InsideTracker

InsideTracker is for the “quantified self” crowd. It shines when you already have data, or you want to combine blood testing with genetics and wearables in one ecosystem.

What you get:

  • Blood testing that typically covers 40+ biomarkers depending on the package
  • Membership options that range from uploading existing lab work to recurring in-lab testing tiers
  • An action plan oriented around nutrition, lifestyle, and supplement suggestions

Data integrations (the differentiator):

  • Optional genetic testing through InsideTracker’s kit or uploaded genetic data from consumer providers
  • Wearable integration through common platforms so labs can be interpreted in context (sleep, activity, HRV)
  • An “InnerAge” style biological age estimate, designed to translate lab patterns into something more intuitive

Who it’s best for:

  • People who want a strong analysis layer over time
  • Anyone with existing labs who wants a system to consolidate and interpret them

Strengths:

  • Excellent for integrating multiple data sources
  • Flexible entry point, from “upload only” to frequent testing

Limitations:

  • Coaching and clinical support are not the core of the product
  • Higher tiers can get expensive if you want frequent testing

Tip: If you’re using a platform like this, upload at least 12 months of labs if you have them. Trendlines reveal far more than a single measurement.

Targeted At-Home Test Kits (Lower Cost, Narrower Scope)

Targeted kits are best when you have one specific question.

Think “Is my thyroid off?” not “Give me a complete longevity map.” They tend to be cheaper, easier to collect (often finger-prick, saliva, or urine), and faster to act on. The tradeoff is you’re seeing a narrow slice of the health picture, so interpretation depends heavily on context, symptoms, and what else is going on.

If you’re new to testing, targeted kits can be a smart first step. If you’re optimizing for longevity or prevention, a comprehensive panel usually gives you better leverage.

Everlywell

Everlywell is the “big menu” brand. It’s best when you want an affordable entry point and the ability to pick from a wide range of tests without committing to a full biomarker membership.

What you can test:

  • Hormone and reproductive health panels
  • Thyroid screening
  • Cholesterol and lipid markers
  • HbA1c and diabetes screening style tests
  • Vitamin and nutrient checks
  • Additional specialty tests depending on the current catalog

Collection and processing:

  • Most kits use finger-prick blood or saliva, depending on the marker
  • Samples are processed through CLIA-certified labs and results are generally delivered in a few business days
  • Results are typically physician-reviewed, with a dashboard designed for easy interpretation

Who it’s best for:

  • People with a single goal (thyroid check, lipid check, A1c check)
  • Anyone who wants a low-friction first step into biomarkers

Strengths:

  • One of the widest test selections and lowest barriers to entry
  • User-friendly experience and straightforward ordering

Limitations and watch-outs:

  • These are generally “results plus guidance,” not full physician consultations
  • Certain test types in the industry (for example some IgG-based food sensitivity formats) are scientifically controversial, so treat them as signals for experimentation, not a medical verdict

Tip: Use targeted kits as a decision filter. If something flags, follow up with repeat testing or clinician-directed labs before making big health decisions.

LetsGetChecked

LetsGetChecked is the targeted testing pick for people who want clinical support baked in. The headline difference is that physician consultations are included, which can reduce the “Now what?” feeling after you open results.

What you can test:

  • A broad targeted menu, including hormone panels, general health markers, and STI testing

Collection and processing:

  • Kits can use finger-prick blood, saliva, or urine depending on the test
  • Samples are processed in a CLIA-certified laboratory and results are typically returned in a few days

Support model (why people choose it):

  • Physician consultations included on results
  • For certain positive STI results, treatment pathways may be available depending on the service area and clinical eligibility
  • Many users value the added nursing support layer for reassurance and follow-through

Who it’s best for:

  • People who want a targeted test but also want a clinician in the loop
  • Anyone who wants help deciding whether a result needs retesting, treatment, or deeper workup

Strengths:

  • Strong support infrastructure compared to results-only kits
  • Clinically oriented workflow that focuses on next steps

Limitations:

  • Fewer à la carte options than the biggest menu brands
  • Pricing can be higher, especially for more comprehensive targeted panels

Tip: If you’re choosing LetsGetChecked, write down your questions before you test. The consult is most valuable when you show up with context, symptoms, and goals.

imaware

imaware is the validation-forward choice. It’s known for being one of the few at-home blood testing platforms with peer-reviewed validation published in a clinical chemistry journal, which is rare in this category.

What you can test:

  • A curated set of clinically oriented tests, including testosterone, heart health panels, thyroid, vitamin D, diabetes screening, celiac disease, STI testing, and allergy-style panels

Collection and processing:

  • Typically finger-prick blood collection for many panels
  • Samples are processed through CLIA-certified and CAP-accredited labs, which adds another layer of quality signaling

Who it’s best for:

  • People who prioritize method rigor and validation over having the biggest test catalog
  • Anyone who wants targeted labs but wants to avoid the “wellness score” vibe

Strengths:

  • Strong scientific credibility relative to most consumer testing brands
  • Focused, clinical-style panels

Limitations:

  • Smaller menu than mass-market competitors
  • Less emphasis on personalized recommendations or lifestyle programming

Tip: If you care about accuracy, consistency still matters. Retest under similar conditions (fasted state, time of day, training load) so changes reflect biology, not noise.

Gut Microbiome Tests

Microbiome testing is best viewed as a structured experimentation tool. It can help you form hypotheses about food tolerance, fiber response, and gut ecosystem balance, then run a cleaner “test and learn” loop.

A quick decoder ring for the tech:

  • 16S sequencing is older and cheaper. It’s useful for broad bacterial patterns, but has limited resolution.
  • Shotgun metagenomics (DNA) is deeper. It can identify a wider range of organisms, but DNA doesn’t tell you whether microbes are active.
  • Metatranscriptomics (RNA) aims to show what microbes are doing right now, which can be more actionable.

No matter the method, results are not diagnoses. They’re directional signals that can inform diet experiments, symptom tracking, and follow-up care.

Viome

Viome is one of the most technology-forward microbiome platforms. It uses AI-driven metatranscriptomics (RNA sequencing), which aims to capture not only which microbes are present, but which ones are actively producing metabolites. That “activity” layer is the key reason people choose it over DNA-only options.

What you get:

  • A gut microbiome report paired with food guidance designed around your microbial activity signals
  • Optional upgraded packages that add additional sample types (depending on the current offering)
  • Subscription paths that can include custom-formulated supplements and periodic retesting

Who it’s best for:

  • People who want actionable food guidance and are willing to iterate
  • Anyone who prefers a more “systems” interpretation rather than a list of bacteria

Strengths:

  • One of the most advanced sequencing approaches in consumer gut testing
  • Recommendations tend to be framed as practical, experimentable steps

Limitations and watch-outs:

  • Subscription models can add up over time
  • Microbiome recommendations are probabilistic. The best outcomes come from pairing them with symptom tracking and disciplined re-testing

Tip: Don’t change everything at once. Pick 1–2 variables (fiber target, fermented foods, polyphenol intake) and retest after 8–12 weeks.

Tiny Health

Tiny Health uses deep shotgun metagenomics (DNA-based sequencing) to profile bacteria and other organisms in the gut. It originally built its reputation in pregnancy and infant microbiome testing, then expanded into adult gut options.

What you get:

  • A deep microbiome profile designed to surface patterns you can act on through diet and lifestyle
  • Optional coaching add-ons depending on the package

Who it’s best for:

  • People who want a DNA-deep microbiome profile and are comfortable waiting longer for results
  • Anyone interested in microbiome changes across life stages (for example pregnancy, postpartum, early childhood, then adult tracking)

Strengths:

  • Deeper sequencing than 16S-style tests
  • Strong fit for families who want consistent testing across stages

Limitations and watch-outs:

  • Turnaround can be slower than many competitors
  • DNA-based profiles can identify microbes that are present but not necessarily active

Tip: Microbiome testing is most useful when you pair it with a simple tracker (stool consistency, bloating, energy, skin, cravings). Otherwise you’re looking at a map with no compass.

Other Microbiome Options (Quick View)

BrandMethodTypical StrengthTradeoff
Ombre16S sequencingOften cheaper entryLess depth than shotgun methods
BIOHMDNA-based approachIncludes fungi angleLess standardized across the space
FloréWhole genome + custom blendsCustom probiotic formulationsPremium pricing

Accuracy, Regulation, and the “Can I Trust This?” Question

There’s a big difference between a cheap retail self-test and a lab-processed kit.

CLIA-Certified Processing

CLIA (Clinical Laboratory Improvement Amendments) is the U.S. framework that regulates clinical lab testing to support accurate, reliable, and timely results.

In practice, it means a lab has to meet standards for quality systems, personnel qualifications, and ongoing performance monitoring.

That’s why it’s a good sign when your kit is processed through a CLIA-certified laboratory, including Jinfiniti’s high-complexity CLIA lab.

The 2025 BMJ Warning About DIY Tests

In 2025, two BMJ papers raised concerns about many over-the-counter self-tests sold in retail settings.[1][2]

The key takeaway was not “all at-home testing is bad.” It was simpler: cheap, off-the-shelf tests often had weak evidence, confusing instructions, or poor guidance on what to do next.

Lab-processed platforms are different because you’re relying on regulated lab systems, not only a consumer-operated strip test.

Finger-Prick vs Venous Draw

Venous draws are often the precision leader.

Capillary tests can still be useful for trend tracking, especially when you repeat under similar conditions.

If you’re comparing results over time, consistency is your best friend.

  • Test at the same time of day when possible
  • Follow fasting instructions
  • Avoid heavy training right before the draw
  • Retest borderline results instead of spiraling over one number

How to Choose the Best At-Home Health Test Kit for You

Start with your goal. Everything gets easier after that.

If Your Goal Is Longevity and Aging Tracking

Pick a panel that includes advanced cardiovascular risk markers and aging-related signals.

  • Jinfiniti AgingSOS Ultimate Panel is built for this use case.
  • Broad wellness panels can still help, but they may miss the rarer longevity markers.

If You Want a Big Annual Health Snapshot

Choose a comprehensive blood platform.

  • Function Health is often chosen for breadth.
  • OneTwenty can be appealing if you want bundled action tools.

If You Want Frequent Tracking Without Lab Visits

At-home recurring testing models can make compliance easier.

  • SiPhox Health is built around repeatable at-home collection.

If You Have One Specific Question

Go targeted.

  • Everlywell and LetsGetChecked are often used for narrow testing needs.
  • imaware can be a strong fit if validation is your top concern.

If Your Symptoms Are Gut-Centered

Microbiome testing can help you build a structured elimination and reintroduction plan.

  • Viome emphasizes activity-based insights.
  • Tiny Health emphasizes deep DNA-based profiling.

What to Do After You Get Your Results

The real win is not the PDF. It’s the loop.

  1. Pick one focus area (metabolic health, inflammation, lipids, micronutrients, hormones).
  2. Make one meaningful change you can stick to for 6 to 12 weeks.
  3. Retest strategically, not impulsively.
  4. Escalate to a clinician if you see red flags or symptoms that need medical evaluation.

If you’re using a longevity panel like AgingSOS, the best approach is simple: baseline, intervene, and retest on a schedule that matches your goals.

FAQ

Are at-home health test kits accurate?

They can be, especially when the sample is processed by a CLIA-certified laboratory and you follow collection instructions carefully.

What does “CLIA-certified lab” mean?

CLIA is the U.S. regulatory program that sets standards for clinical lab testing quality. CLIA-certified labs are required to meet defined requirements for reliability and oversight.

Is finger-prick blood as accurate as a venous blood draw?

Venous draws typically have higher precision. Finger-prick data can still be useful for screening and trend tracking when you test consistently.

How often should you retest biomarkers?

Many people retest every 3 to 12 months depending on the goal. If you’re making a focused intervention, 8 to 12 weeks is often enough to see direction.

Which at-home test is best for longevity tracking?

Look for panels that include advanced cardiovascular risk markers and aging-related signals. Jinfiniti’s AgingSOS Ultimate Panel is built specifically for longevity and prevention.

Can these tests diagnose disease?

No. They can highlight risk signals or abnormal values, then guide follow-up with a clinician.

What should you do if a result is out of range?

Retest if the result is borderline or unexpected, and talk with a clinician if it’s meaningfully abnormal or you have symptoms.

Are gut microbiome tests actually useful?

They can be useful for structured experimentation with diet and lifestyle. Treat them as directional tools, not definitive diagnoses.

Why are some cheap retail self-tests unreliable?

Some rely on weaker evidence, unclear instructions, or poor guidance on interpretation and next steps. Lab-processed testing tends to be more robust.

Do you need to fast before at-home blood testing?

Often yes, especially for lipids, glucose, and insulin-related markers. Always follow the kit’s instructions.

Bottom Line

If you want the most longevity-relevant picture, you’ll get more value from panels built around aging mechanisms and processed at a regulated lab, not a basic retail test.

If you want a broad annual snapshot, comprehensive blood platforms can cover a lot of ground.

If you want to track change week-to-week or month-to-month, convenience matters more than perfect comprehensiveness.

Referenced Sources

  1. Davenport C, Richter A, Hillier B, Scandrett K, Agarwal R, Baldwin SW, et al. Direct-to-consumer self-tests sold in the UK in 2023: cross sectional review of information on intended use, instructions for use, and post-test decision making. BMJ; 2025. https://doi.org/10.1136/bmj-2025-085546
  2. Hillier B, Deeks JJ, Alderman J, Kale AU, Macdonald T, Baldwin SW, et al. Direct-to-consumer self-tests sold in the UK in 2023: cross sectional review of regulation and evidence of performance. BMJ; 2025. https://doi.org/10.1136/bmj-2025-085547

Account Access

Welcome back

Continue your health journey with a secure login.